Draw trendline
EA, indicators & objects (PC)
EA, indicators & objects (PC)

This article was :
published
updated
On MetaTrader4 (MT4) / MetaTrader5 (MT5), you can draw trendlines, trendlines by angle, and cycle lines. They are often used to read and analyze trends, momentum, and cycles of the market.
Here, we'll take a look at how to draw and set up the trendline, the most often used line.
Switch between MT4/MT5 tabs to check the steps for each.
Trendlines can be displayed from the menu or toolbar.
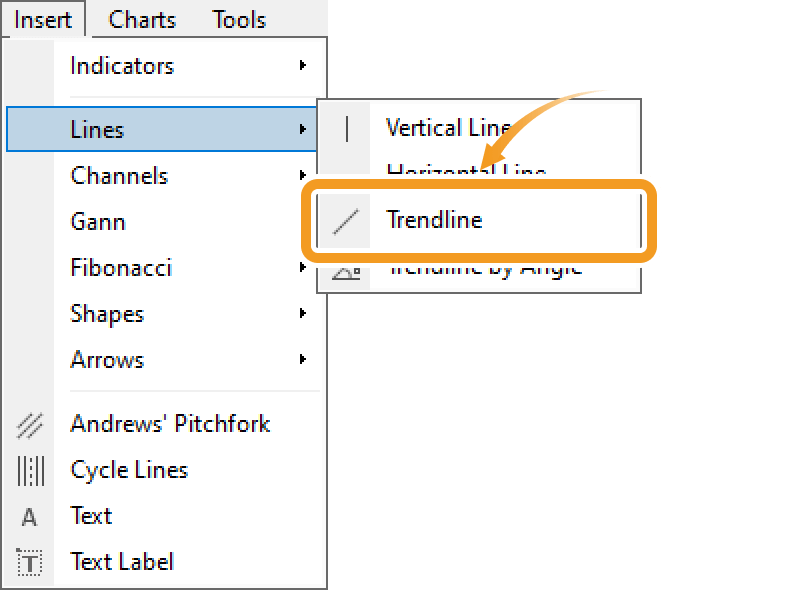
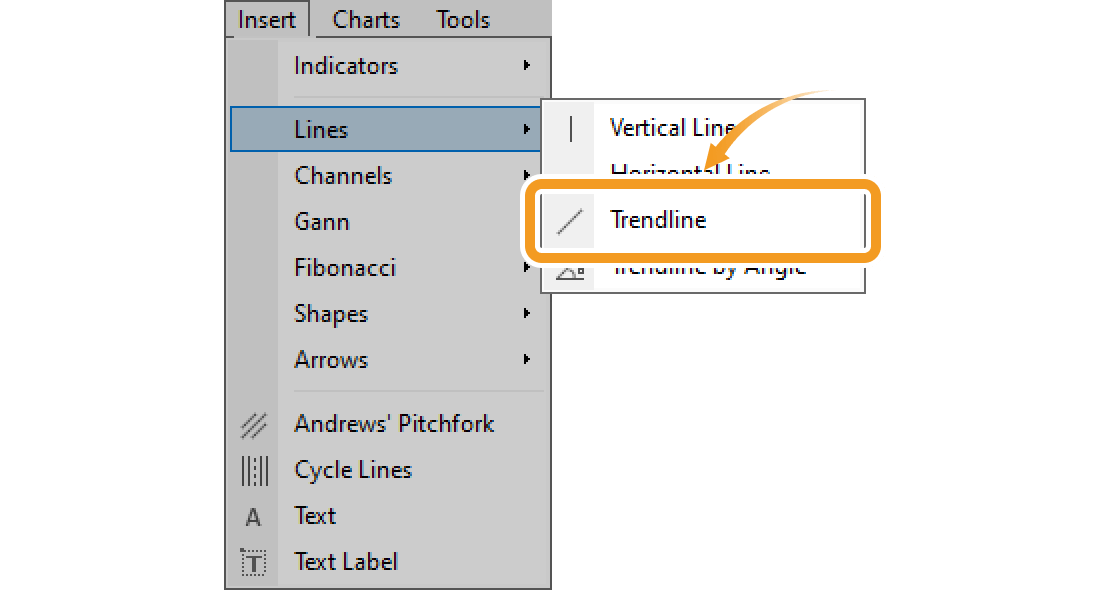
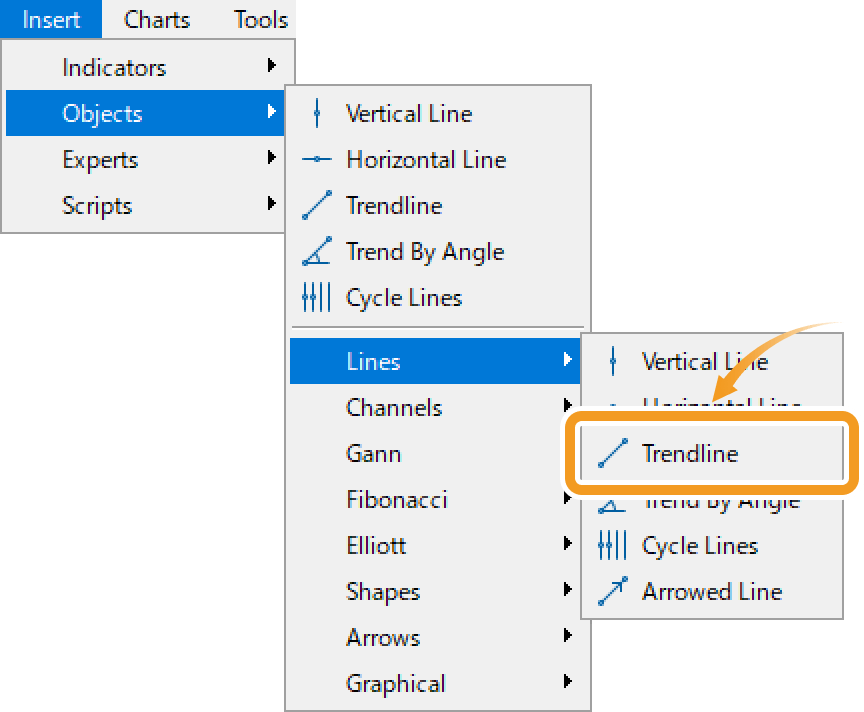
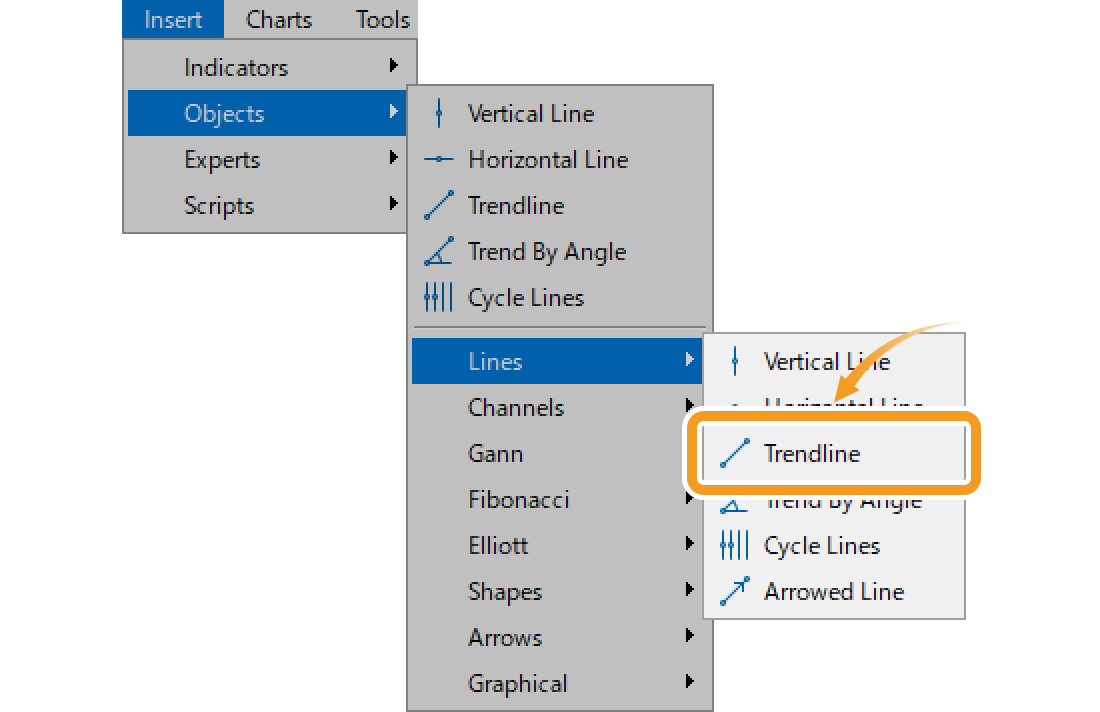
Click "Insert" in the menu. Hover the pointer over "Lines" and select "Trendline".
Trendline
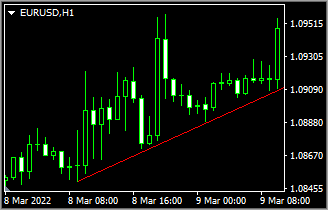
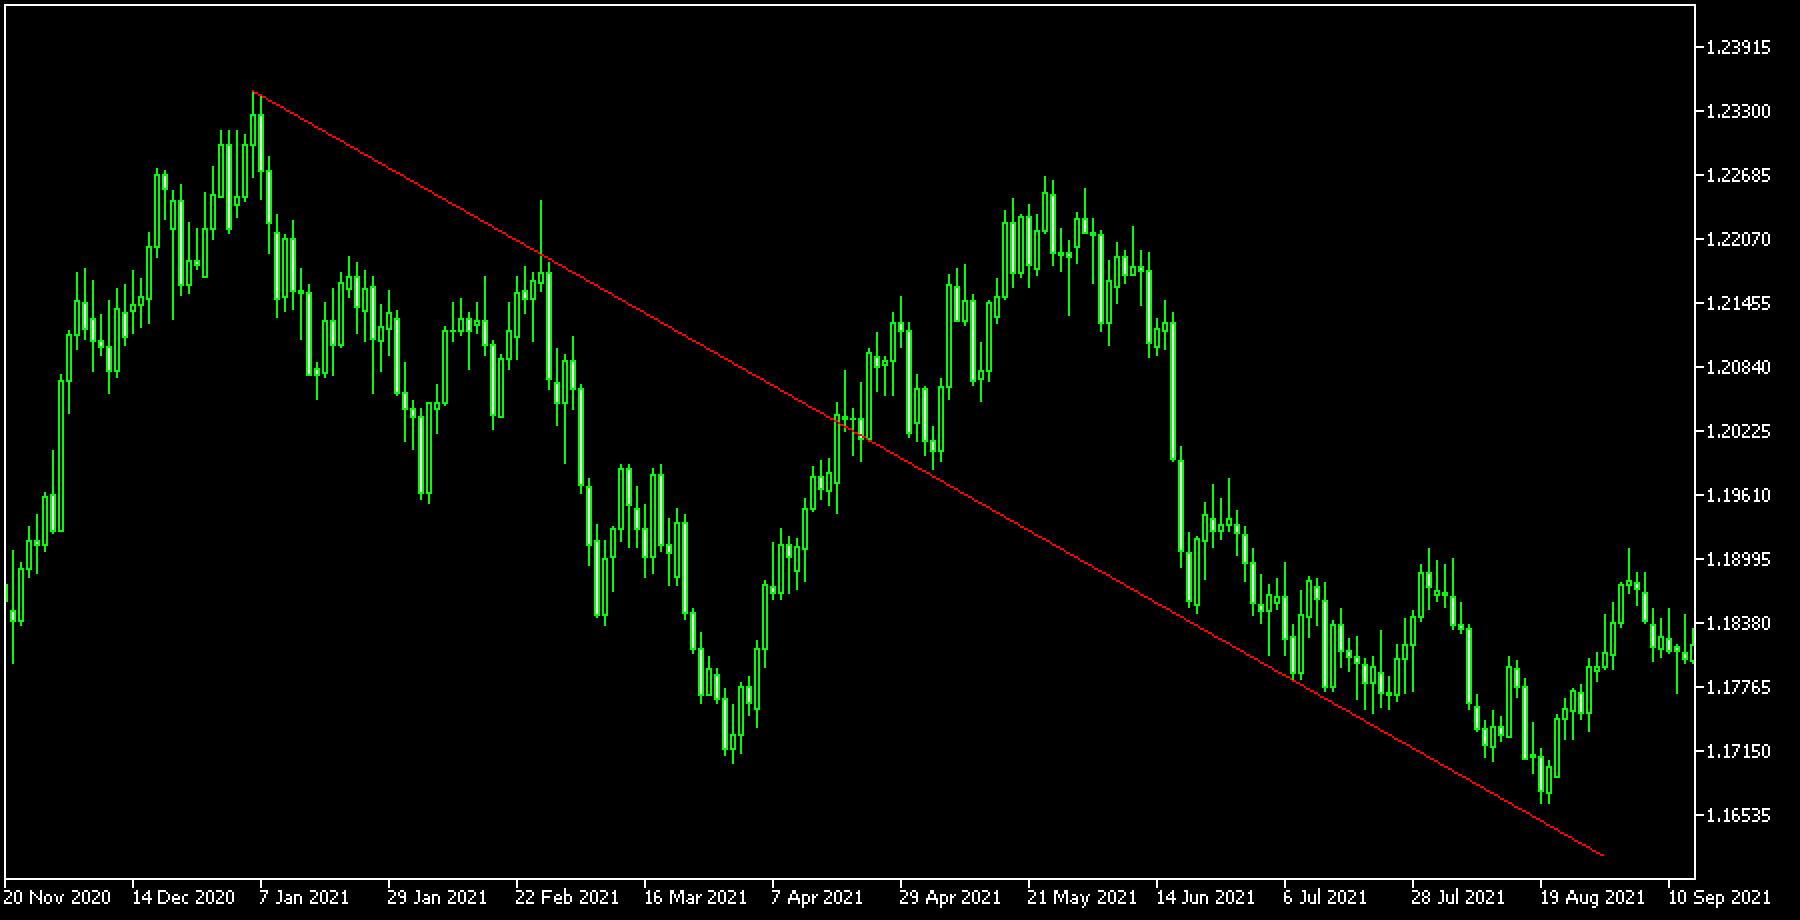
Trendline connects the low, high, or close prices to read the trend. The trendline will help you determine the direction and momentum of a trend.
Trend by Angle
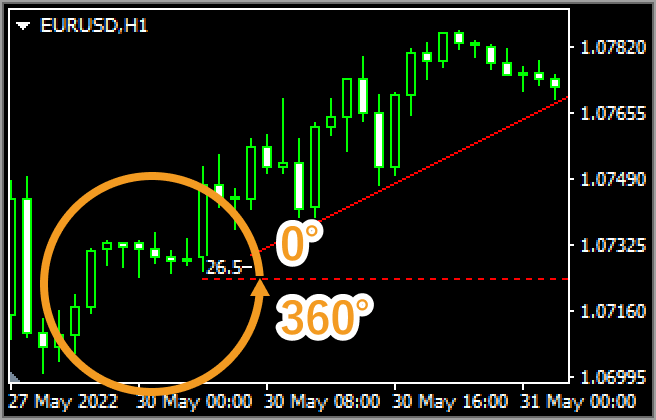
Trendline by Angle is the trendline with a specified angle. The angle relative to the horizontal line will be displayed. Analyze the angle of the trend line to determine the strength of a trend.
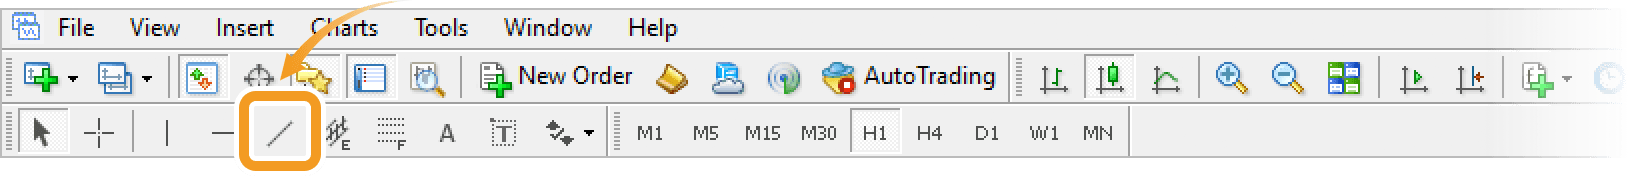
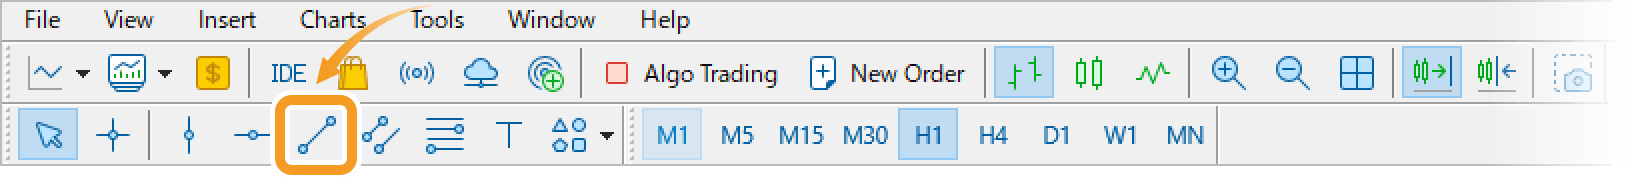
Click the "Draw trendline" button on the toolbar.
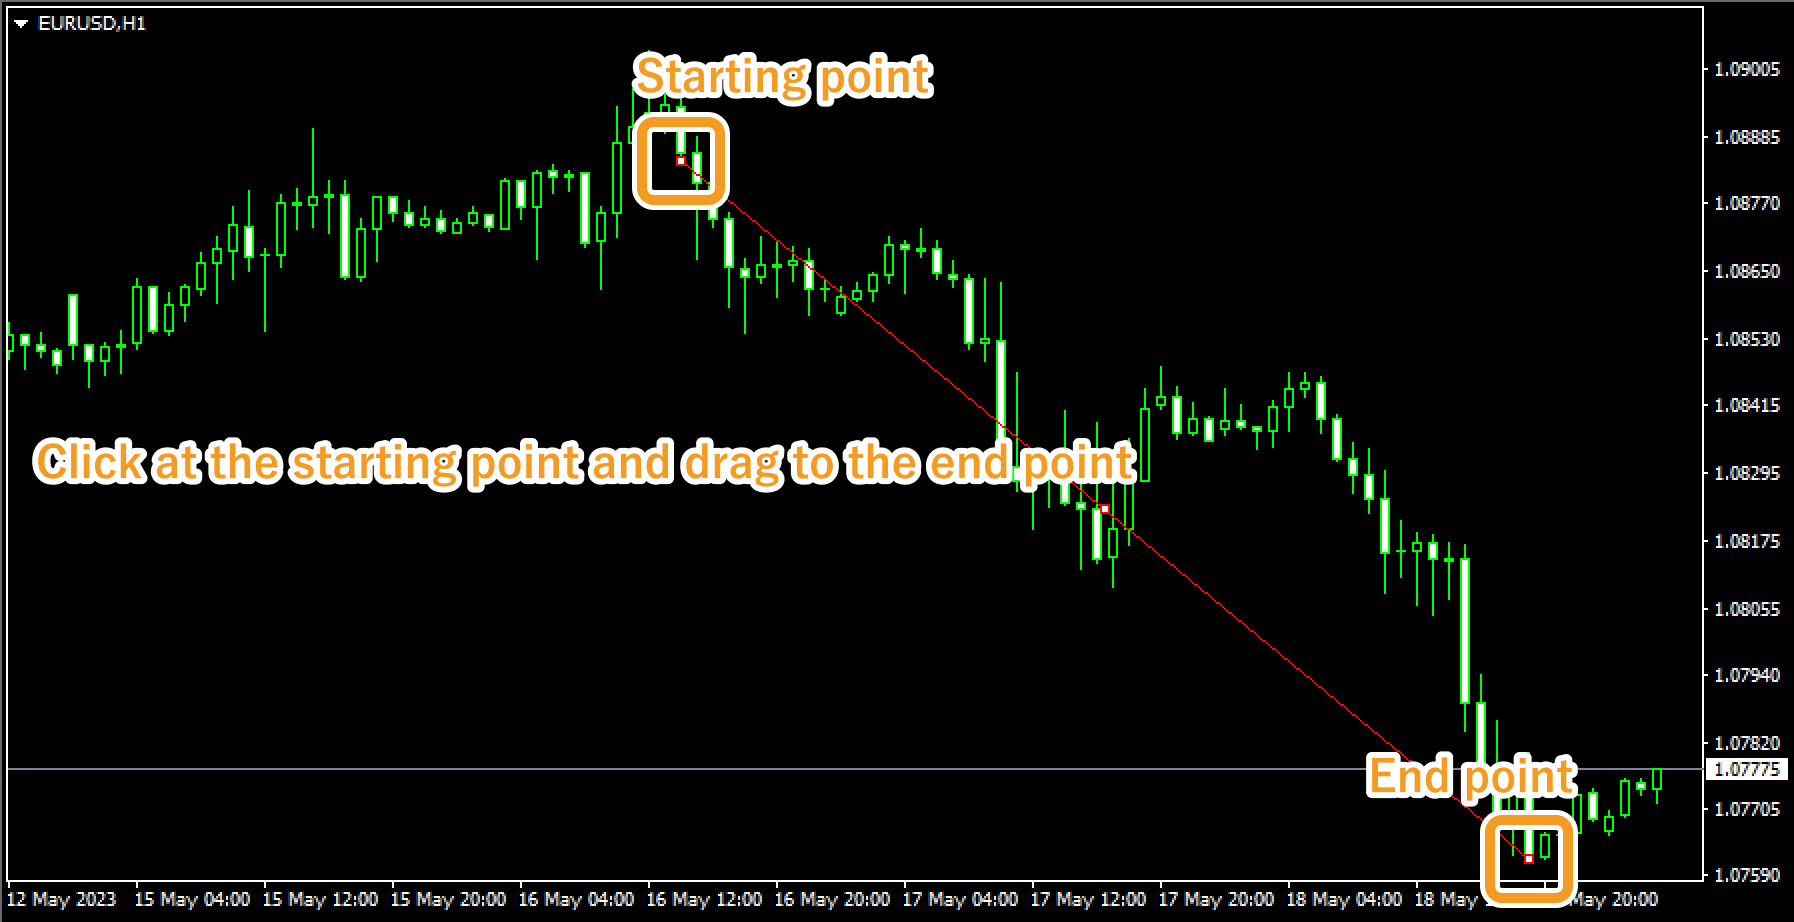
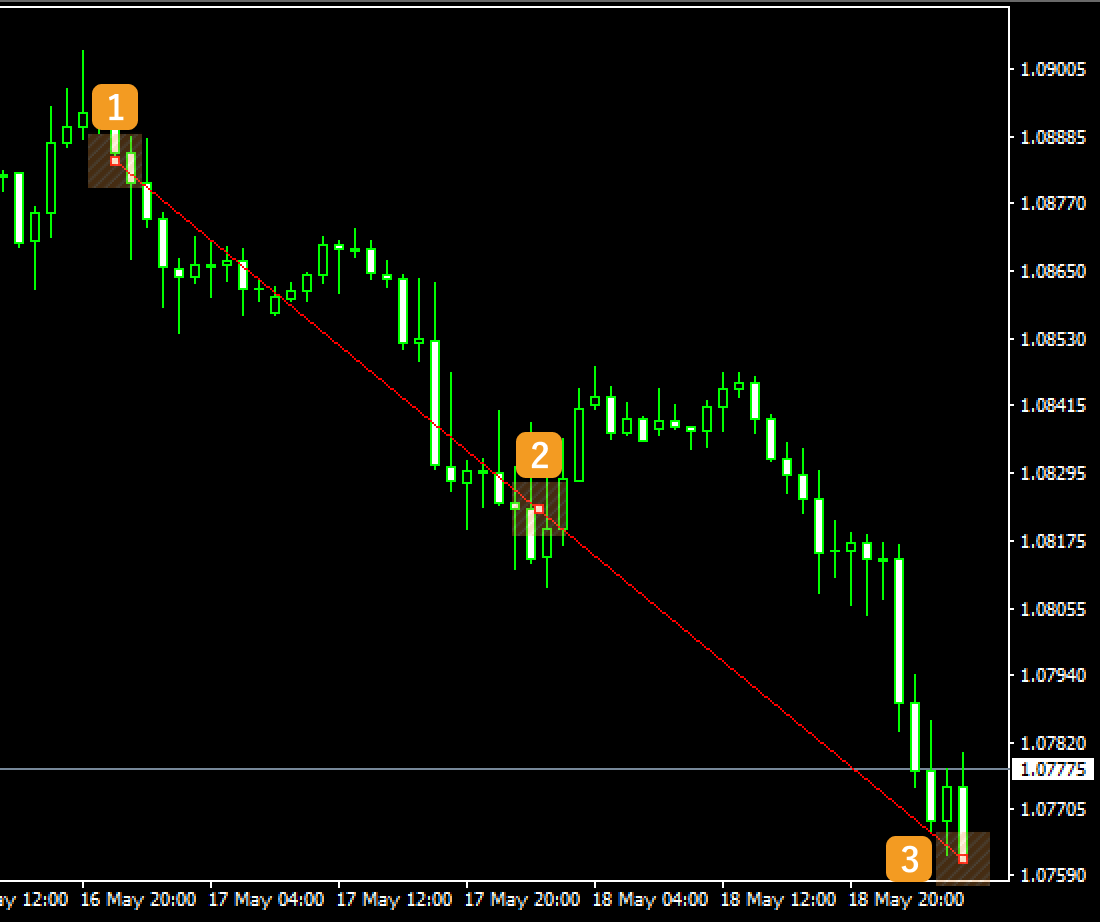
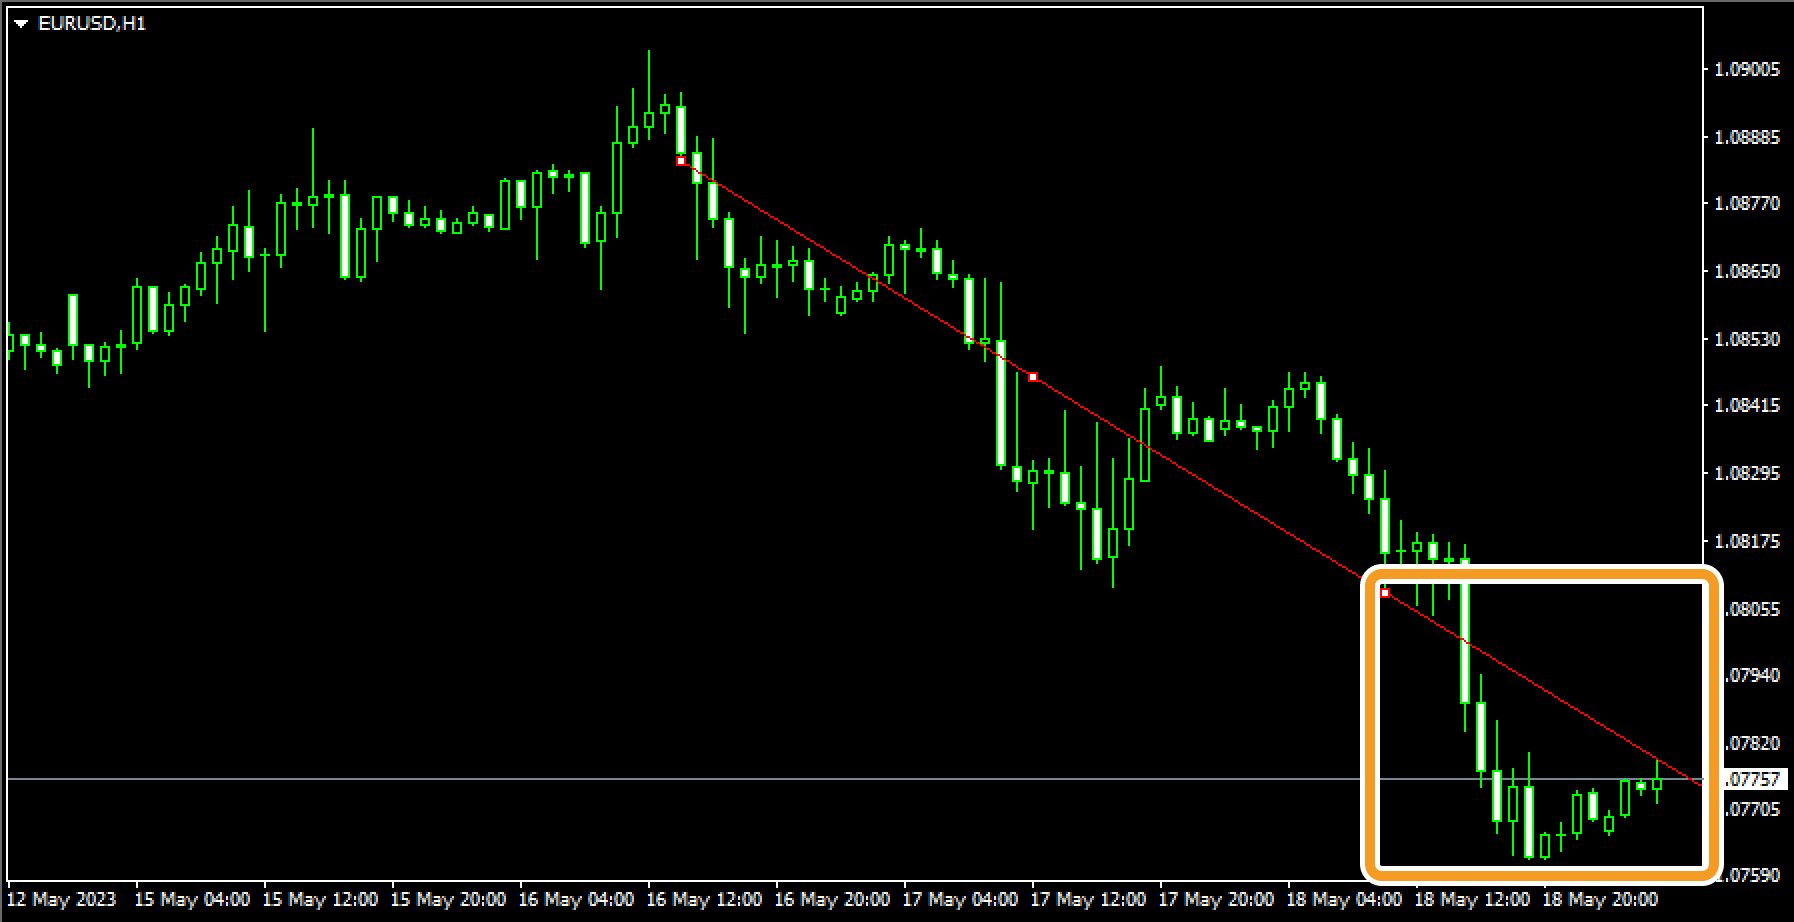
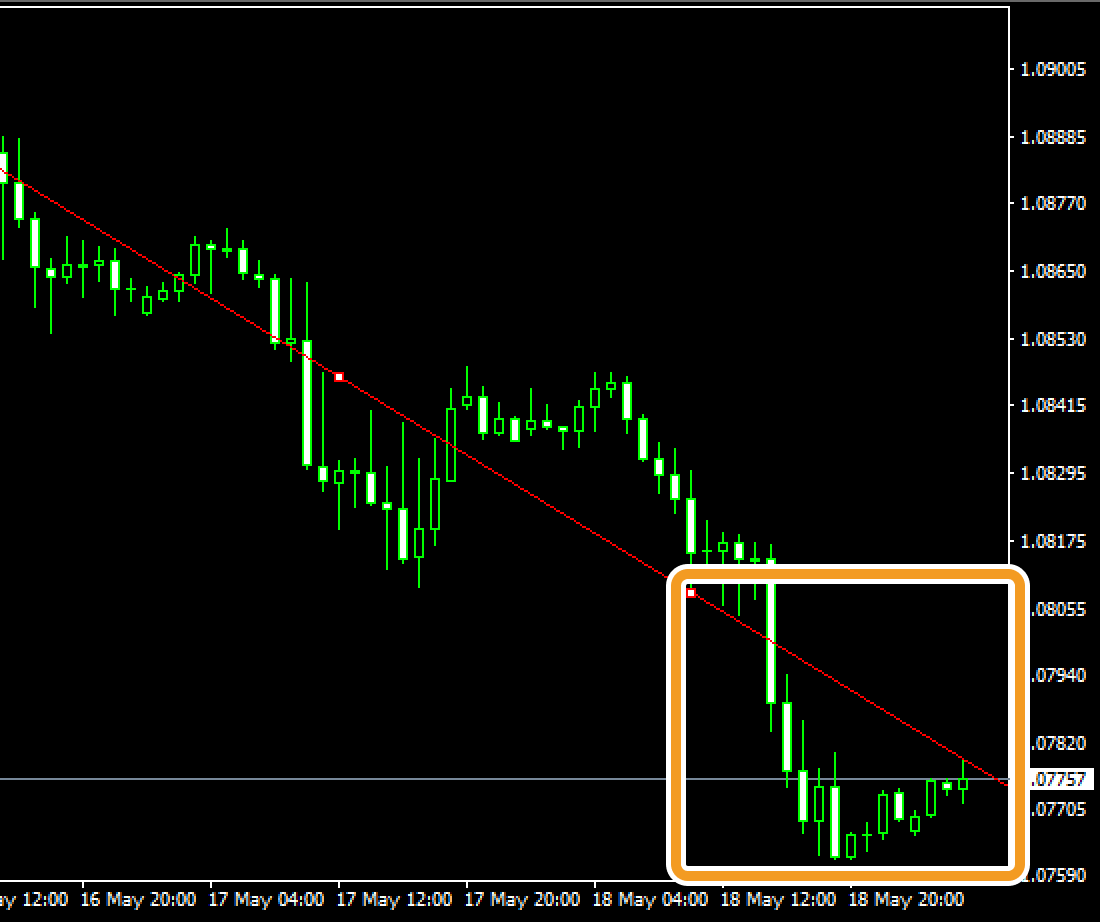
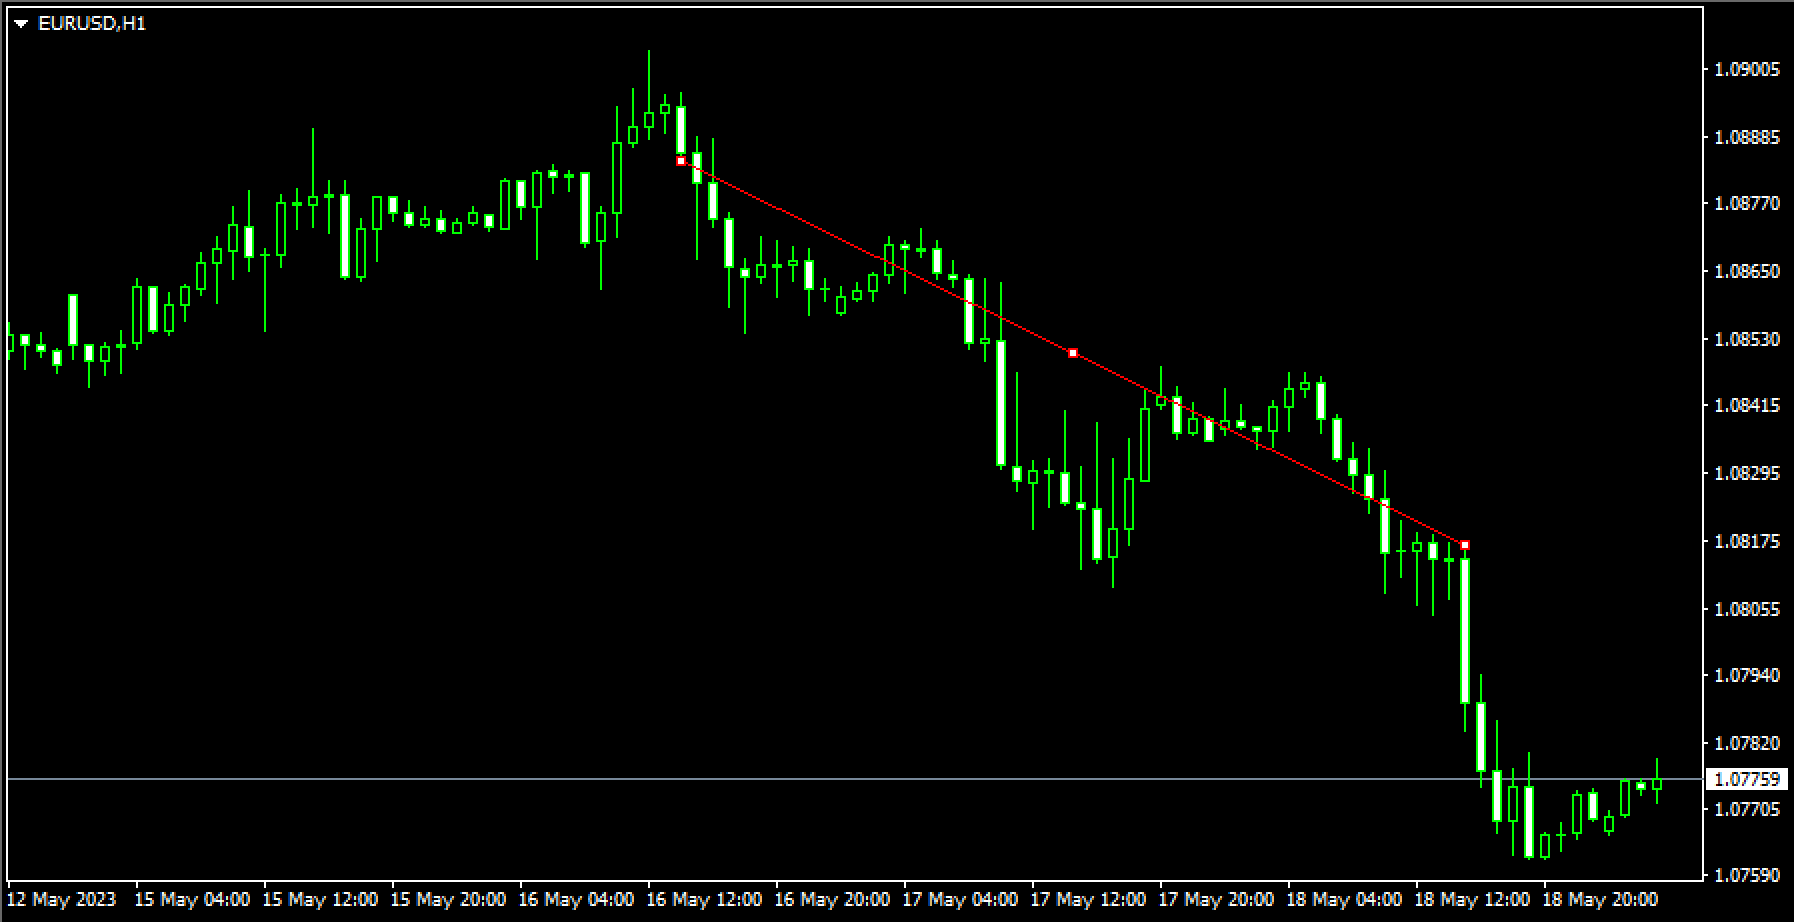
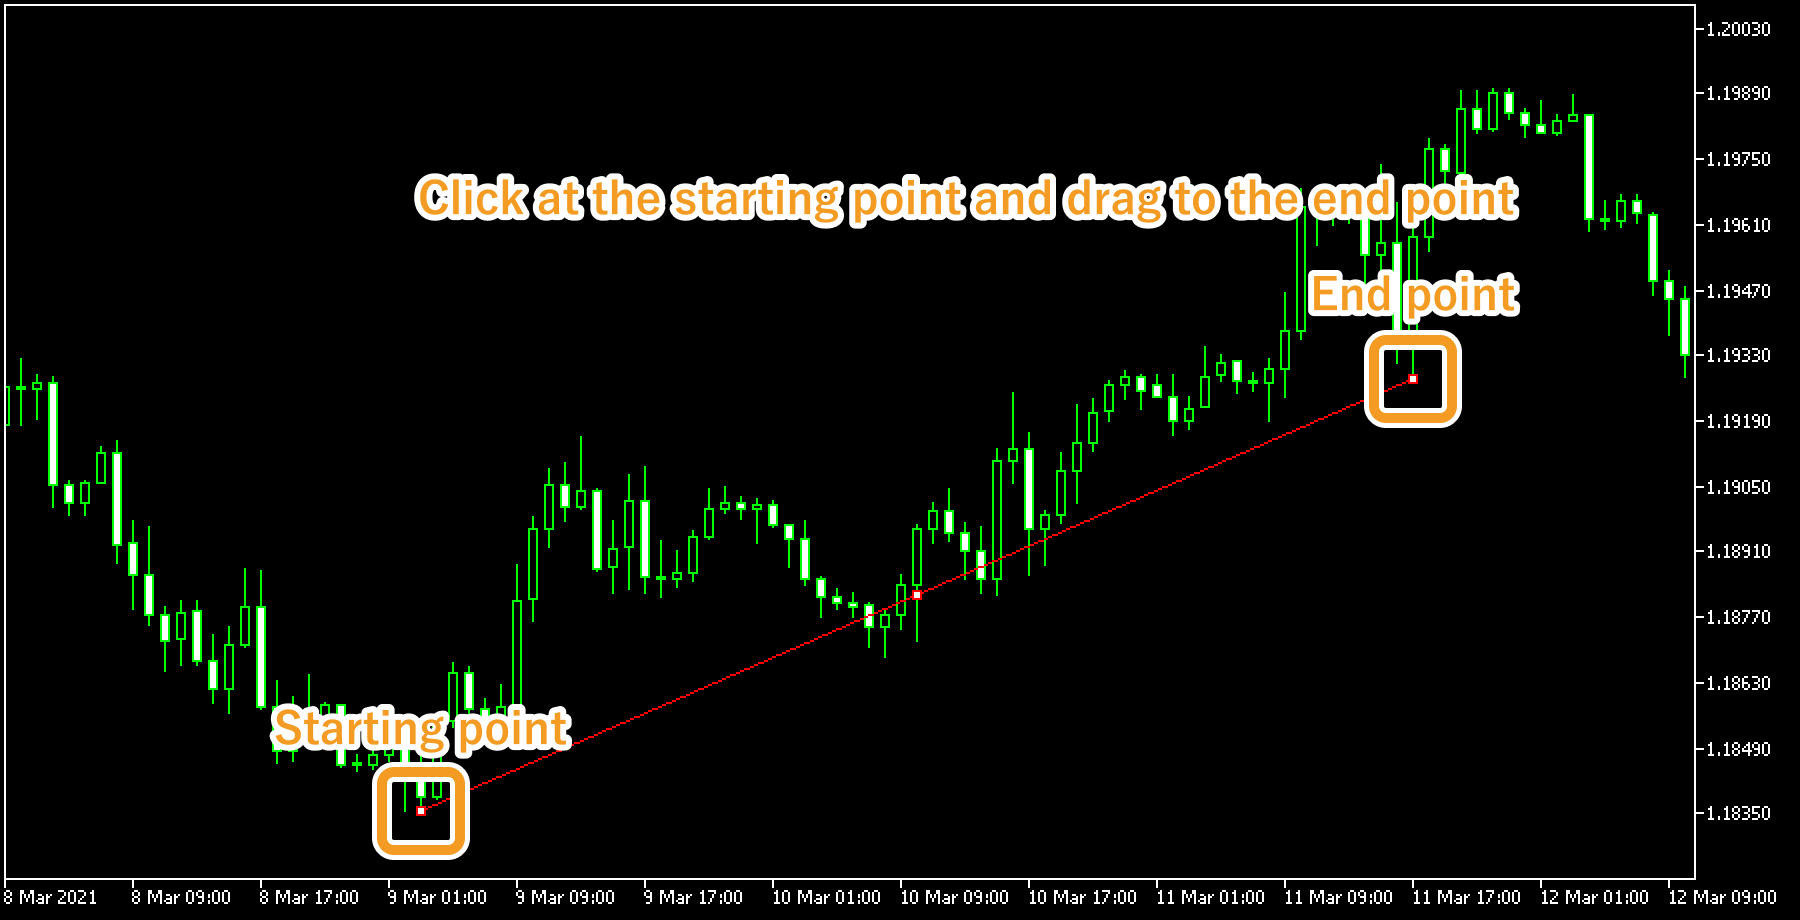
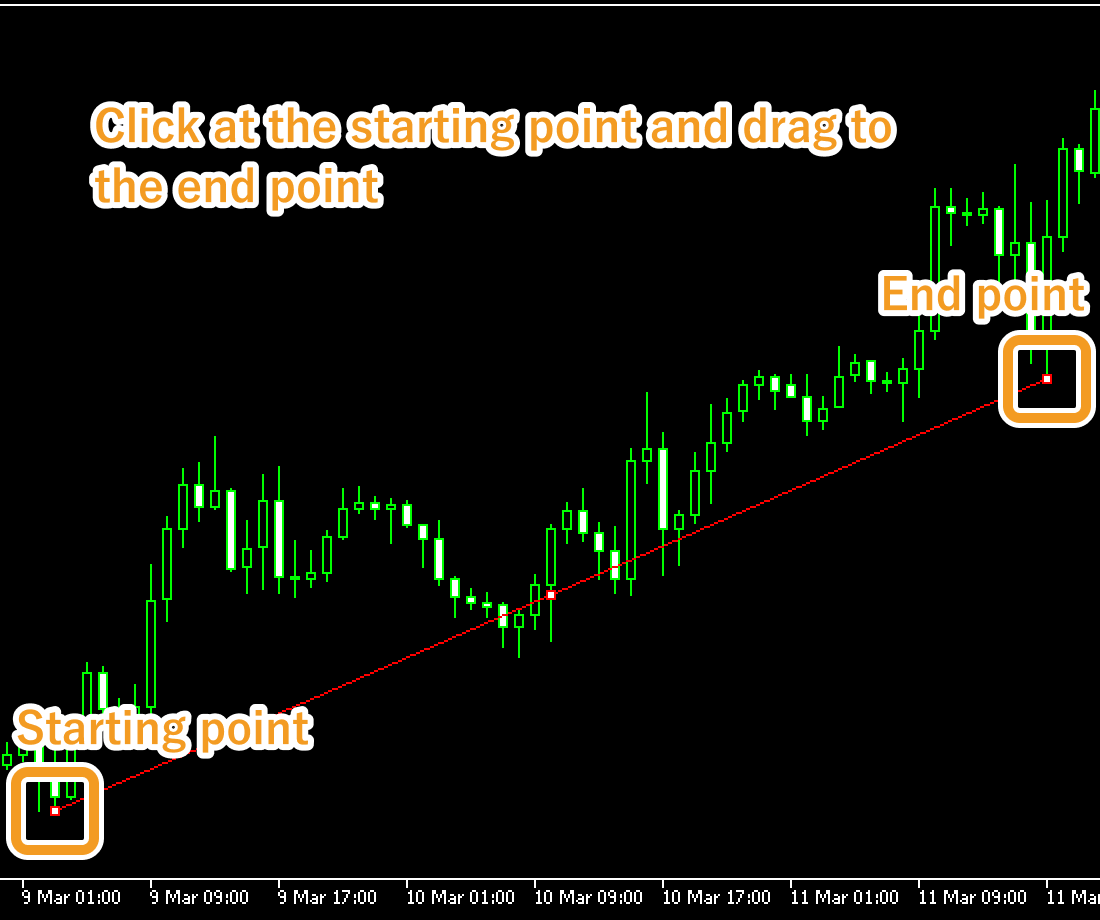
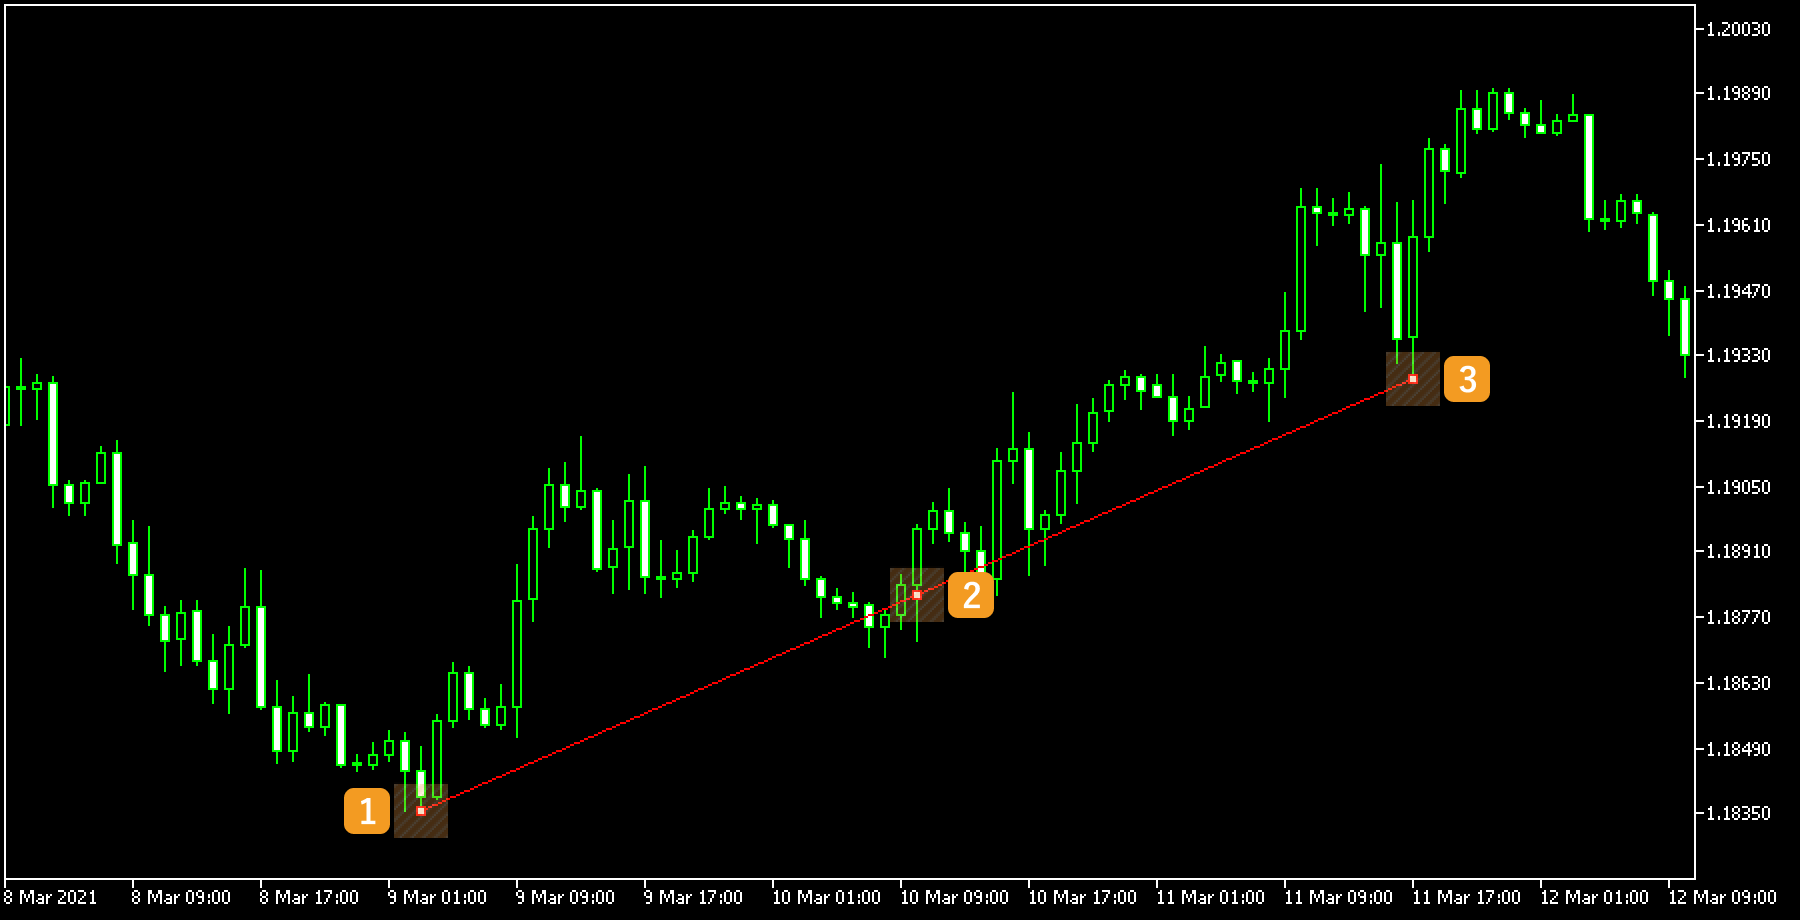
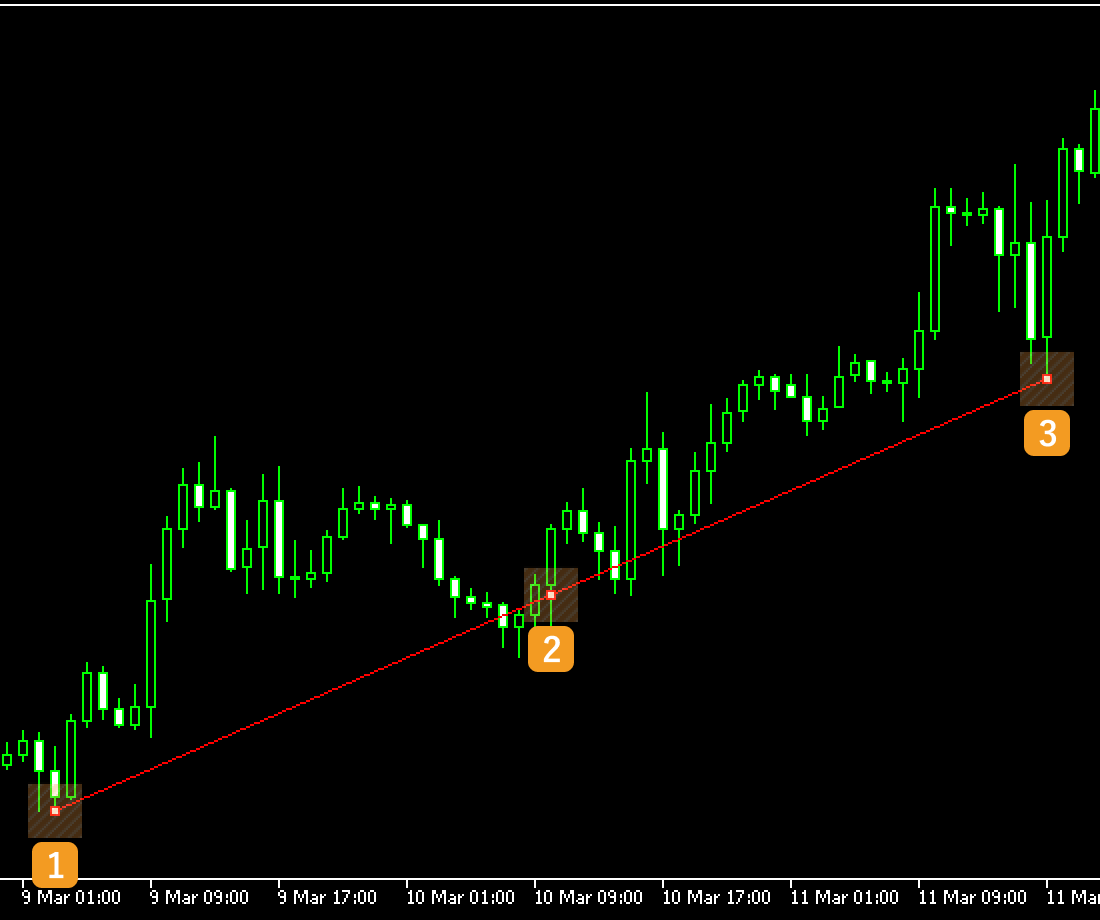
Click at the starting point of the trendline on the chart and drag to the end point.
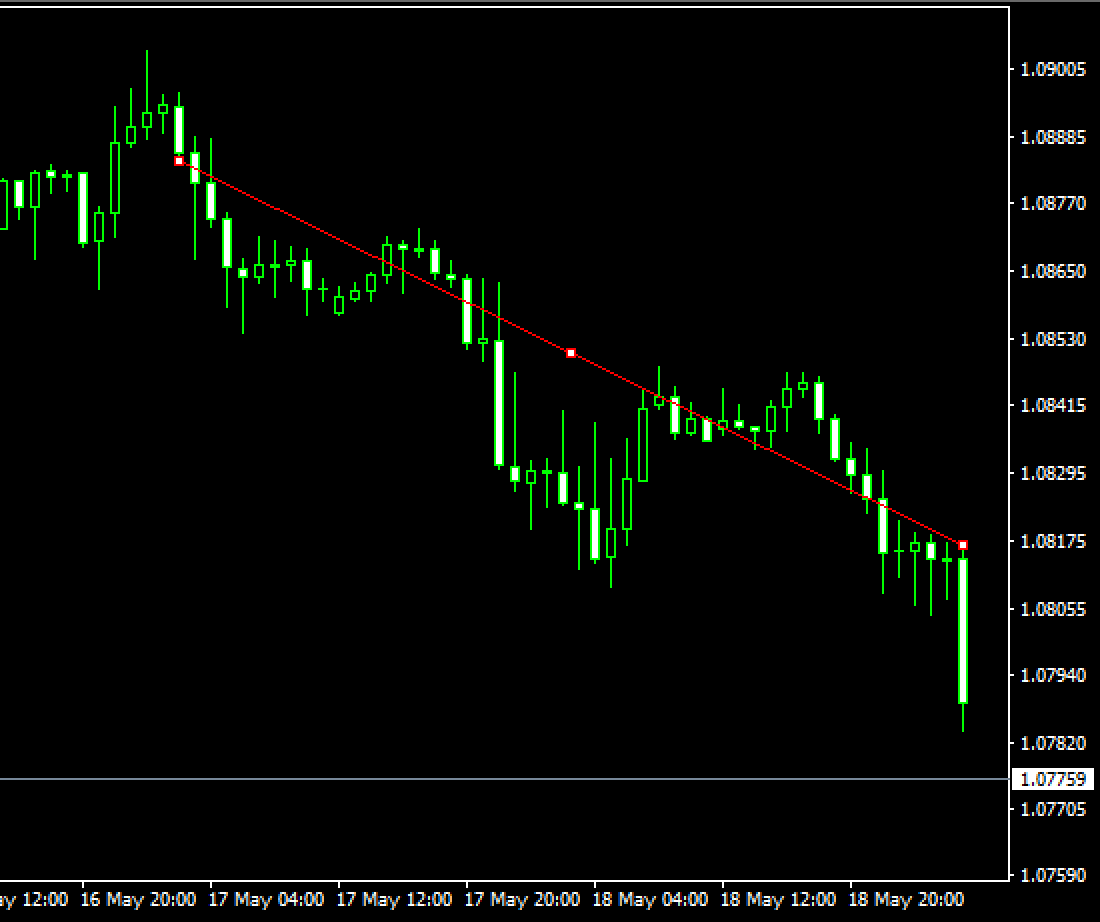
If you want to adjust the position of trendline, make sure the white dots are being displayed on the trendline and move each dot as necessary. If you cannot see the white dots, double-click near the trendline to display the white dots.
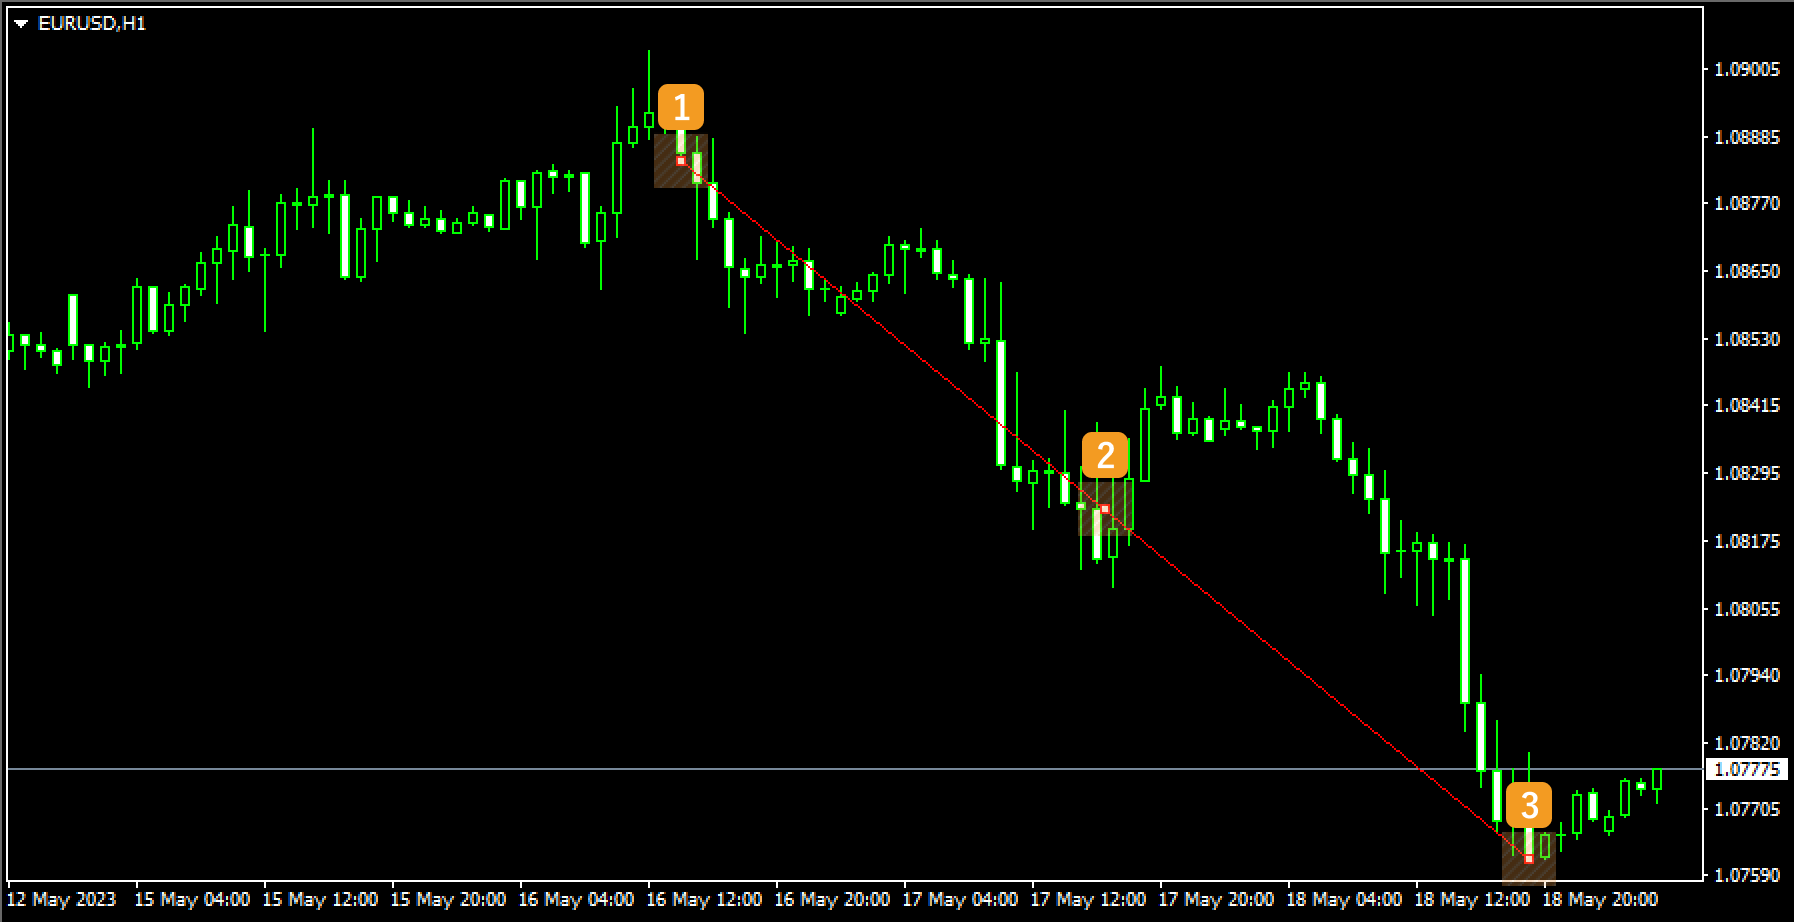
|
Number |
Descriptions |
|---|---|
|
1 |
Change the starting point of the trendline. |
|
2 |
Change the position of the trendline. |
|
3 |
Change the end point of the trendline. |
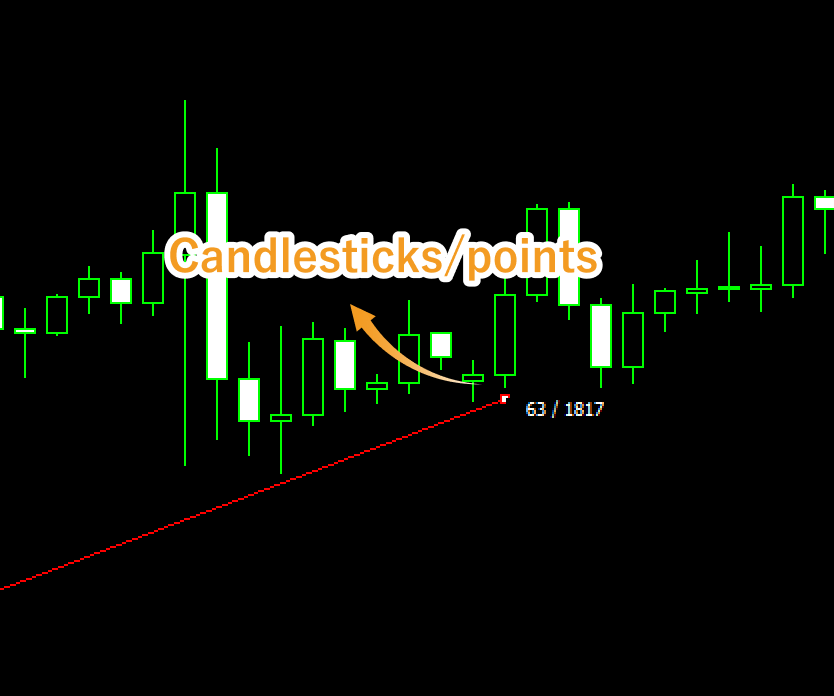
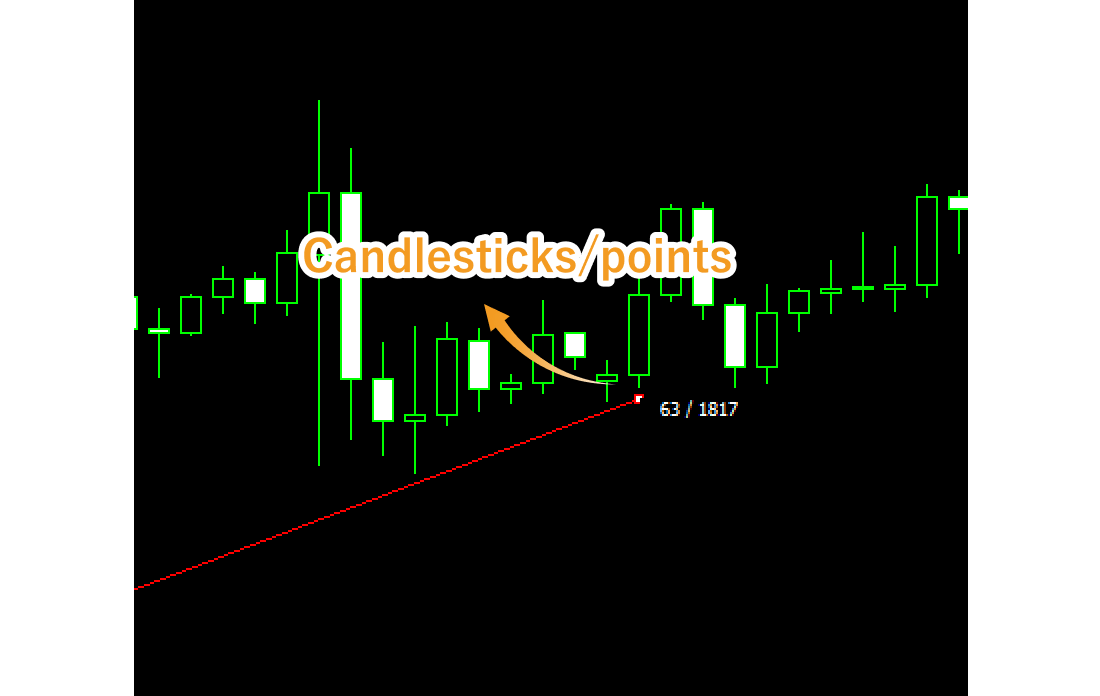
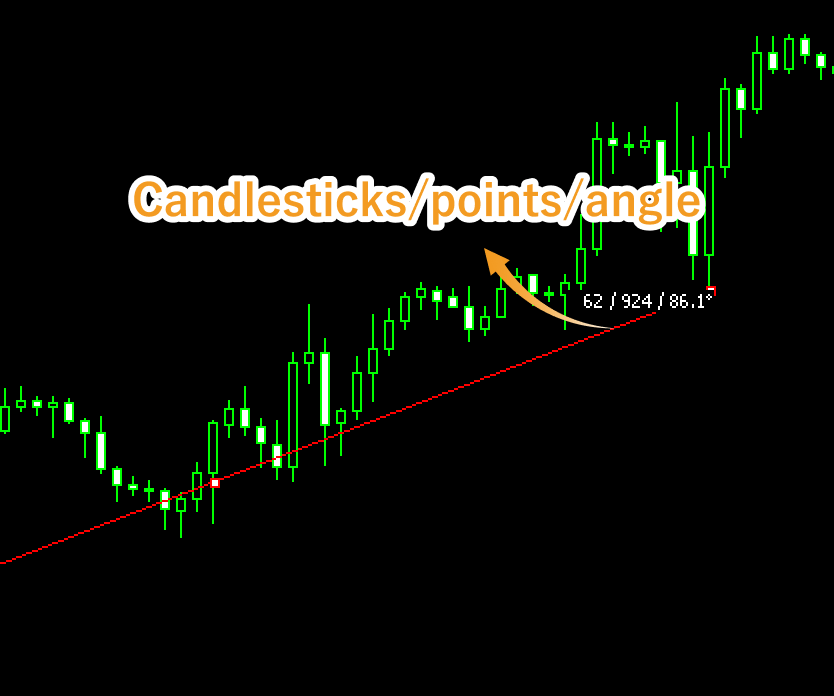
Values displayed when dragging indicate the numbers of candlesticks and points from the starting point to the end point.
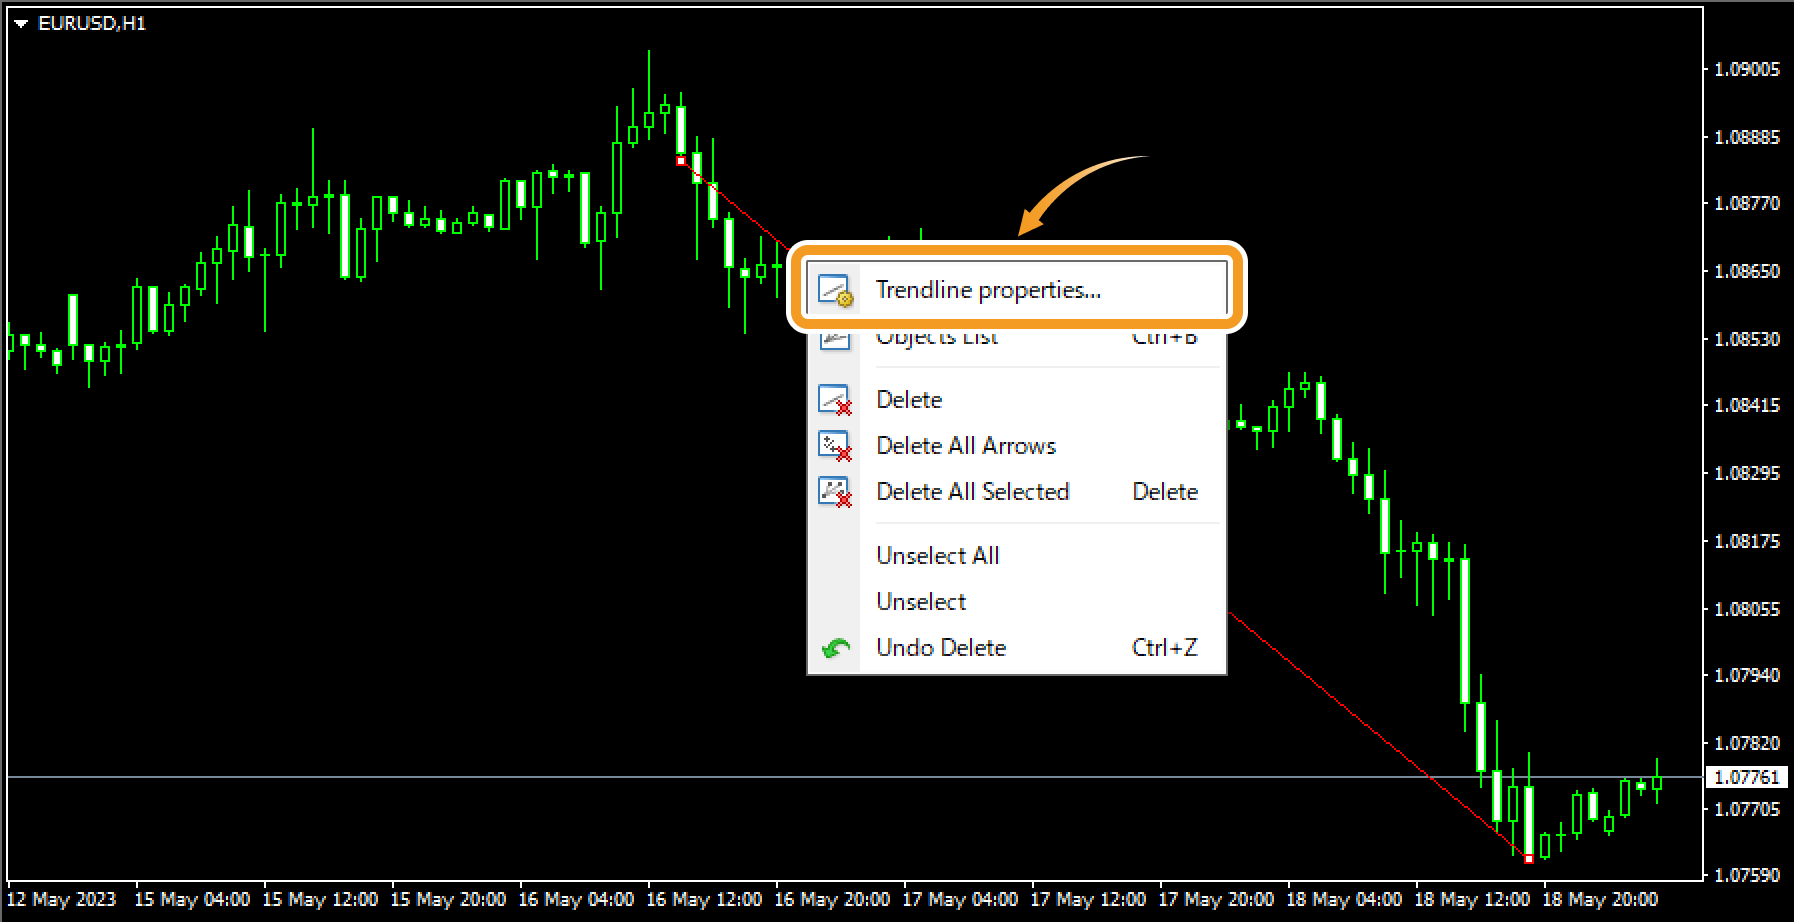
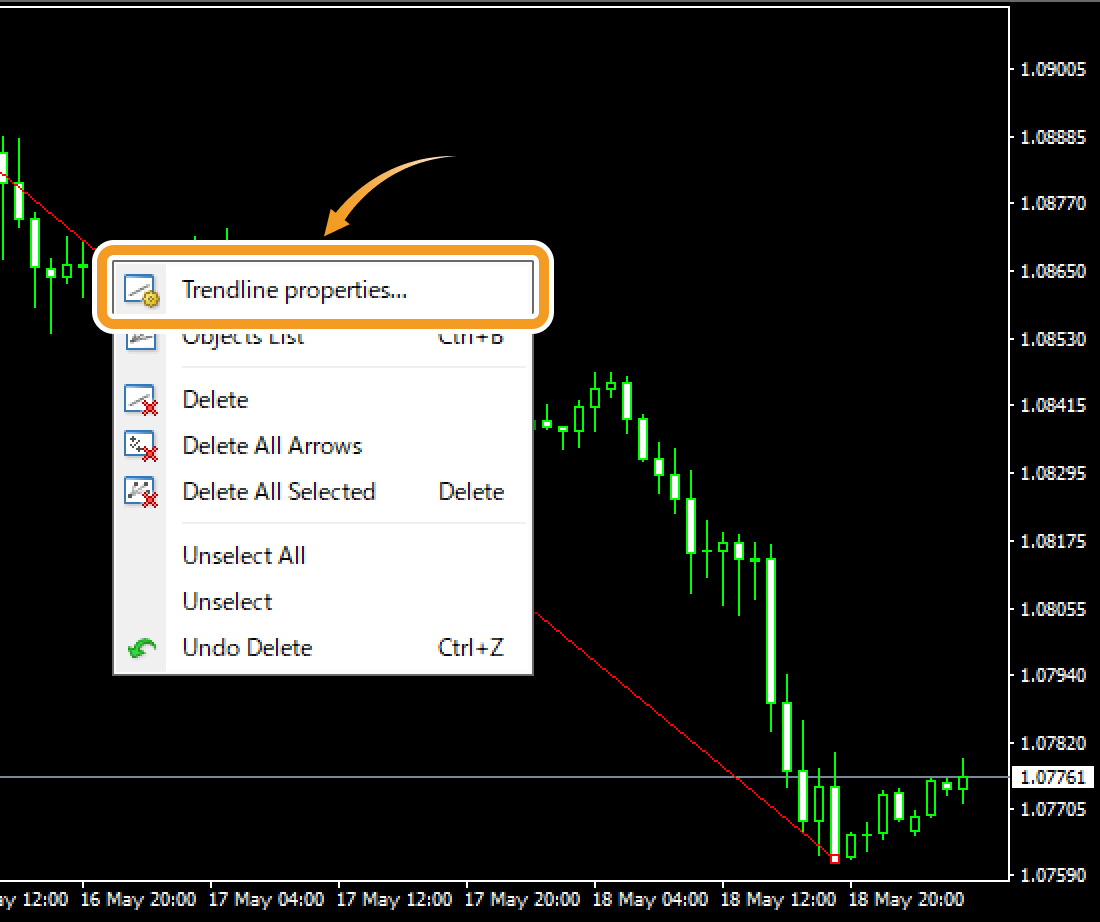
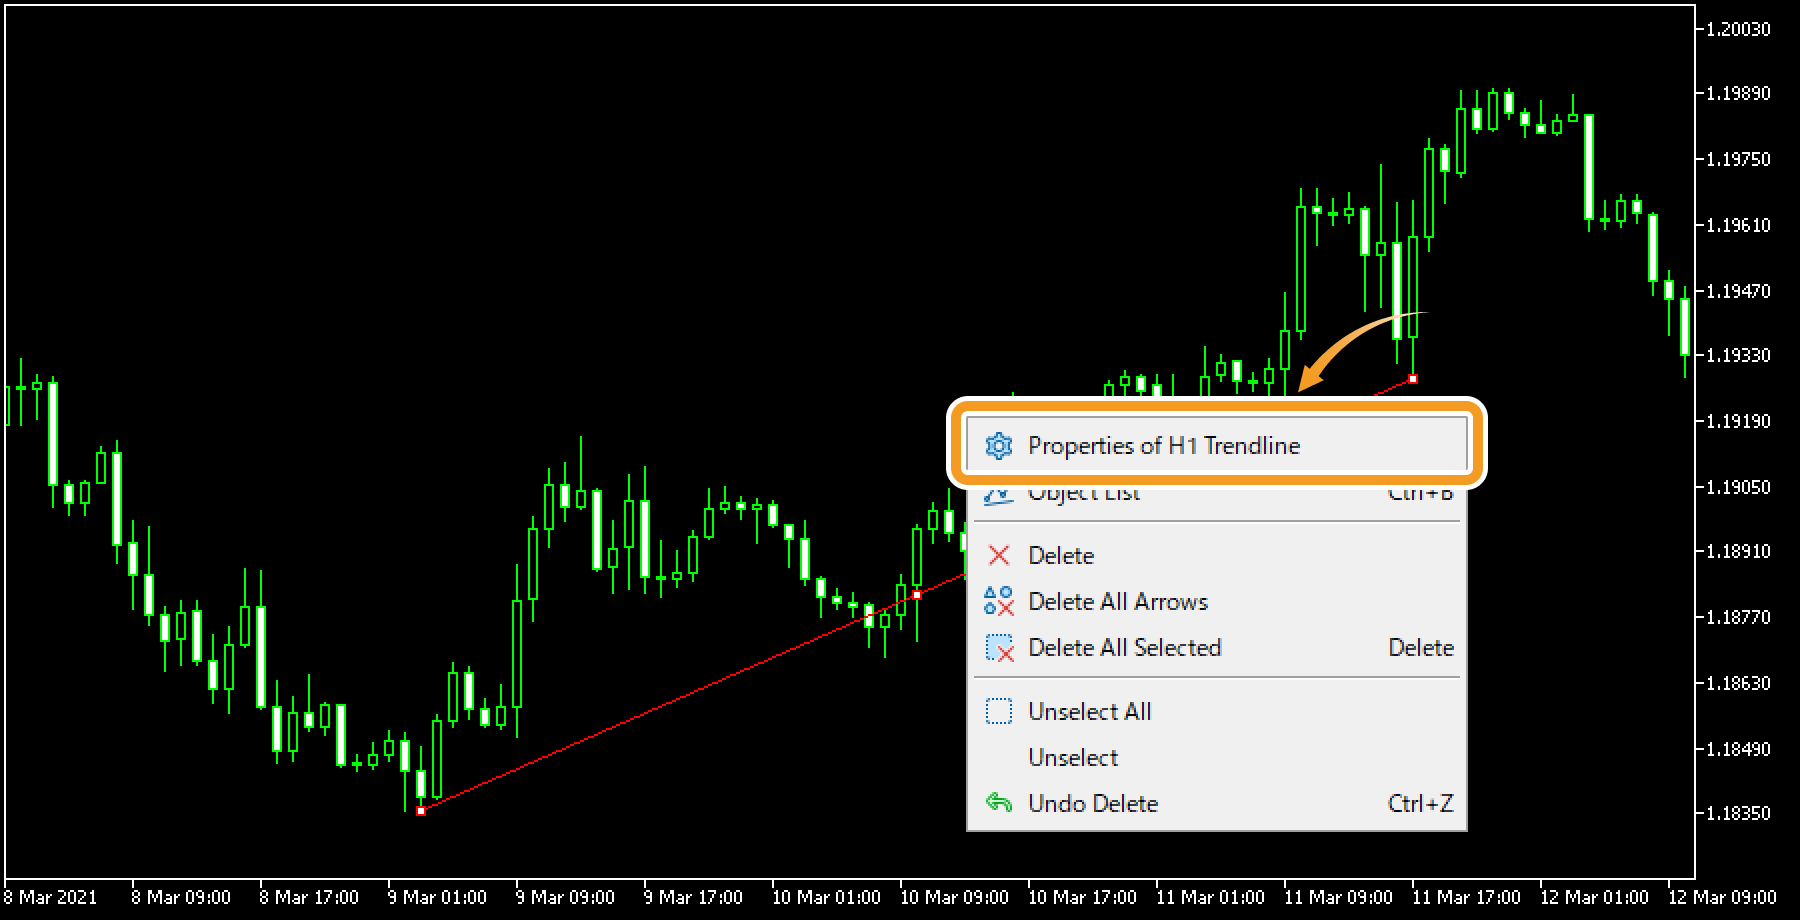
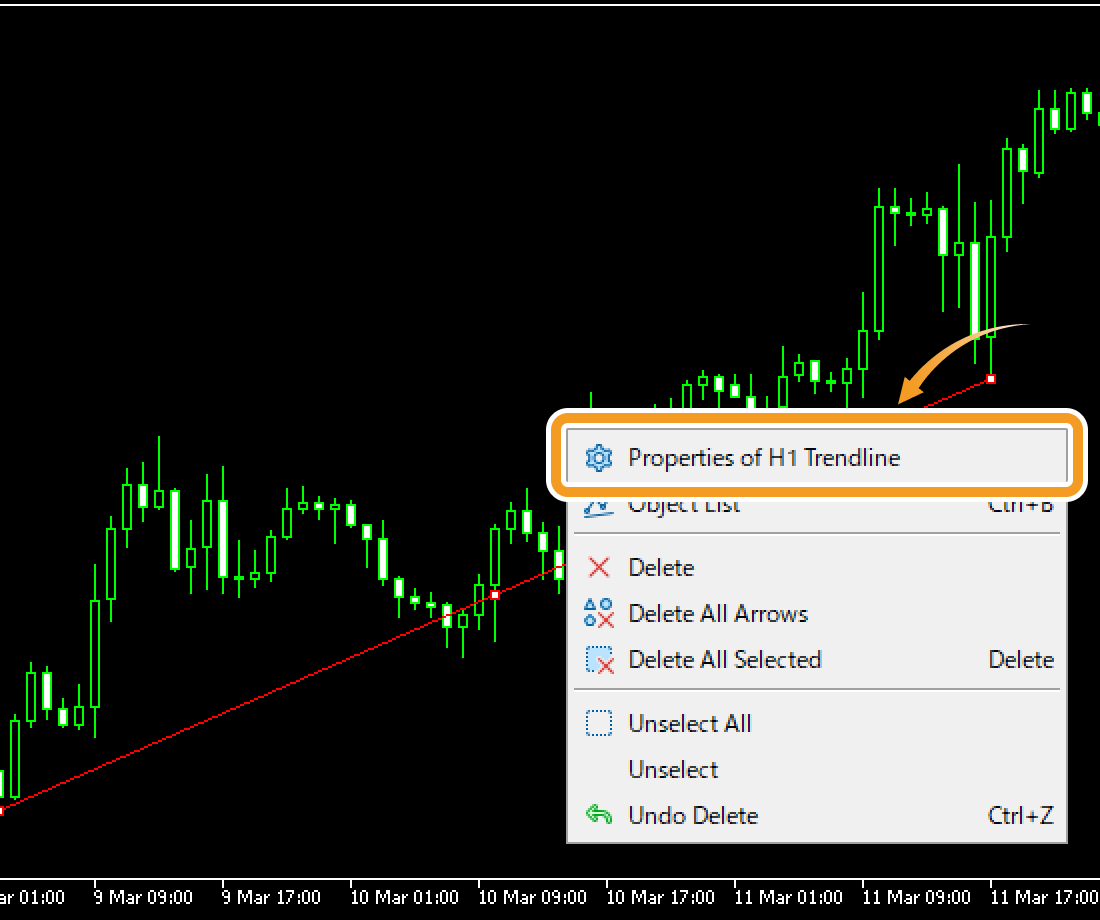
To modify the trendline settings, right-click near the trendline and select "Trendline properties...".
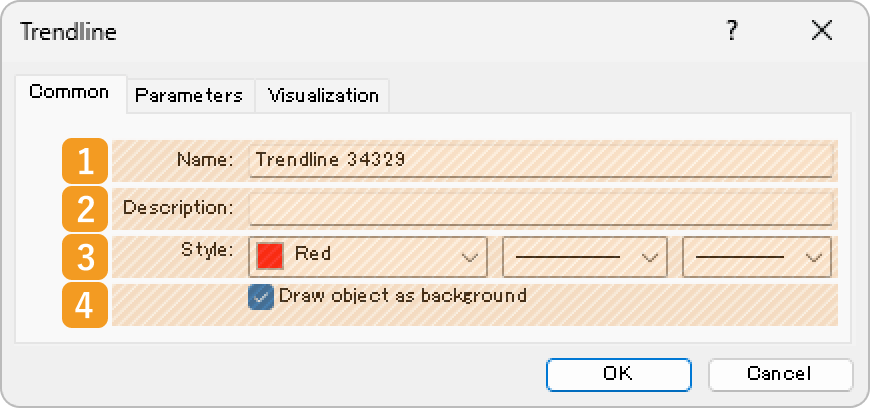
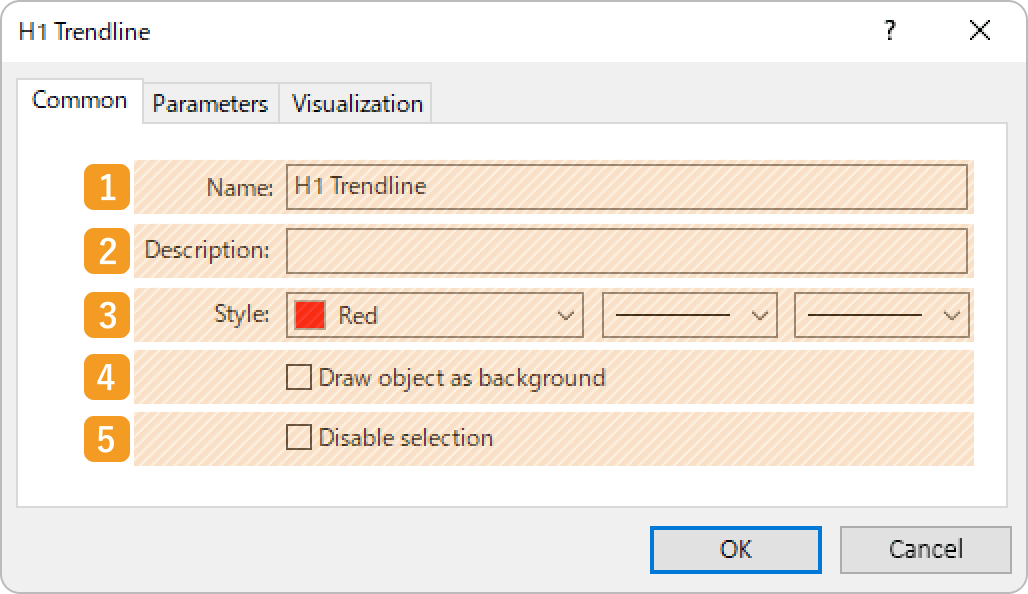
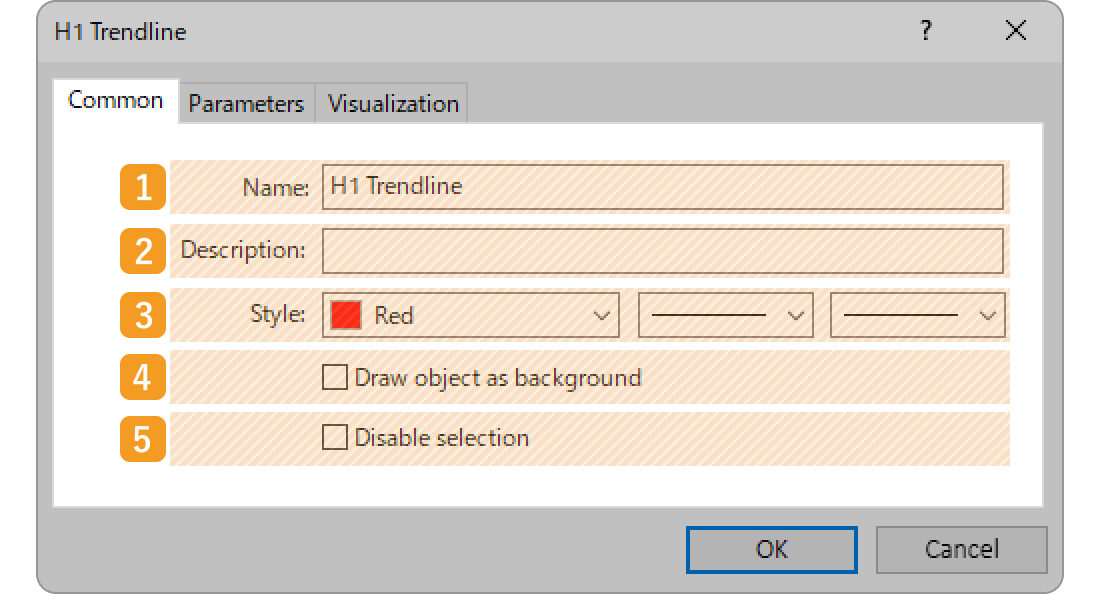
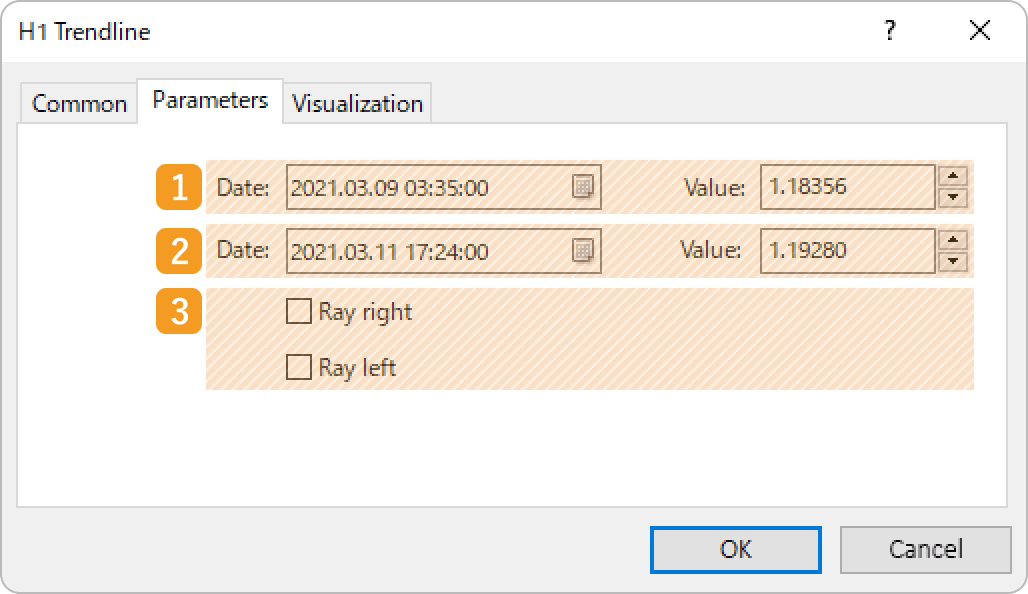
Edit the parameters of the trendline in the three tabs, "Common", "Parameters", and "Visualization", and click "OK".
|
Number |
Item name |
Descriptions |
|---|---|---|
|
1 |
Name |
Name the trendline. |
|
2 |
Description |
The description can be displayed on the chart when hovering the pointer over the trendline. |
|
3 |
Style |
Set the color, line type, and line thickness for the trendline. |
|
4 |
Draw object as background |
Check this box if you want to place the trendline behind the chart. |
|
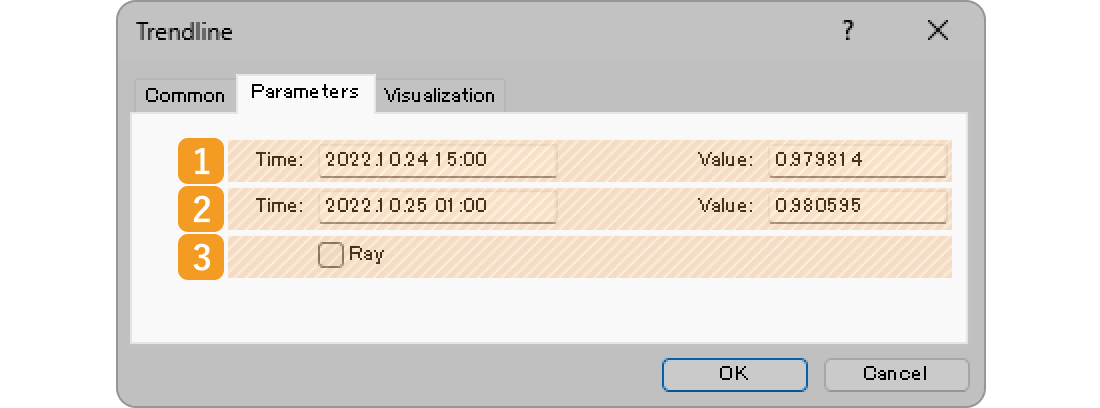
Number |
Item name |
Descriptions |
|---|---|---|
|
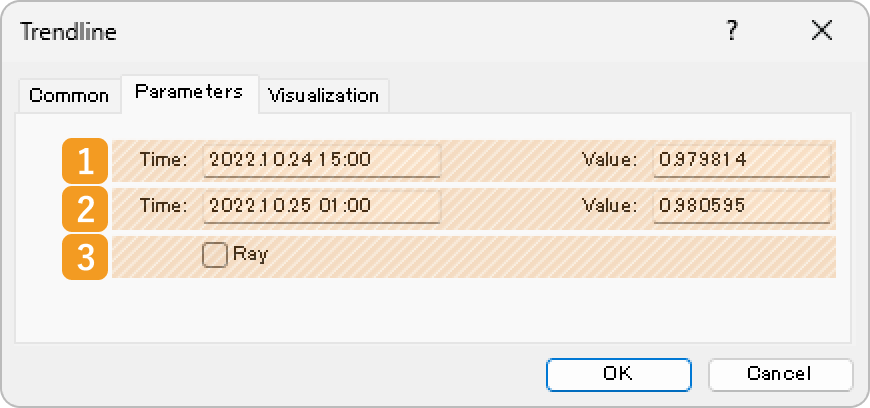
1 |
Starting point position |
Specify the starting point position by date and price. |
|
2 |
End point position |
Specify the end point position by date and price. |
|
3 |
Ray |
Check this box to extend the trendline beyond its end point. |
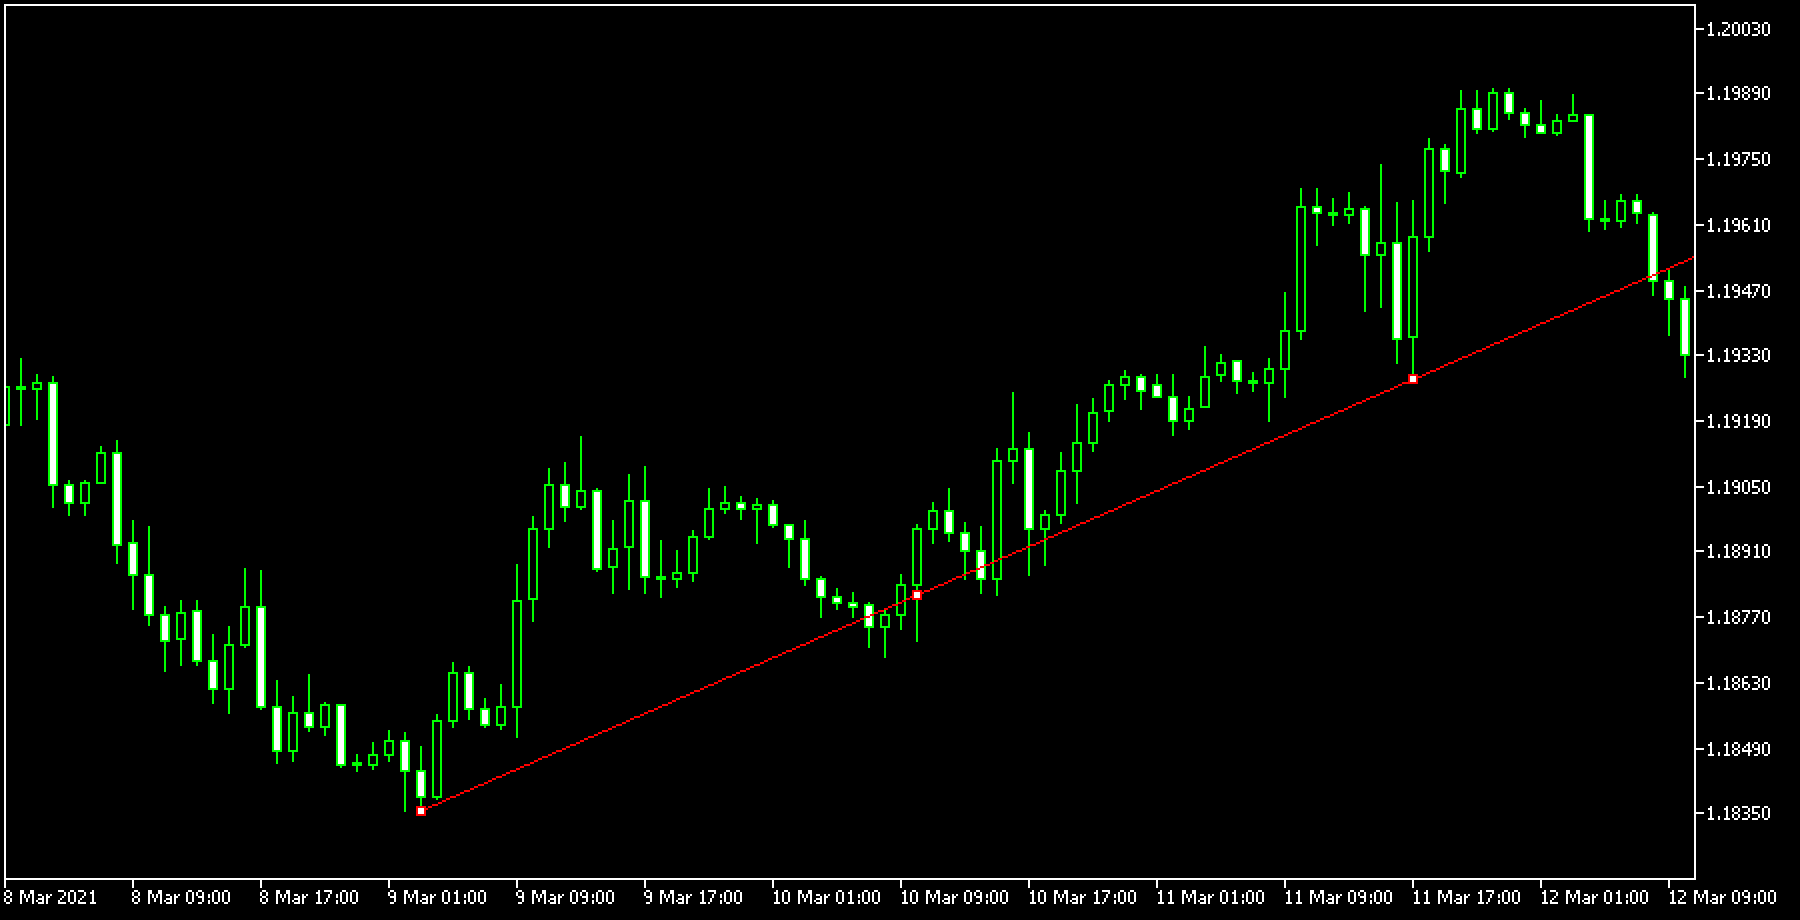
"Ray" is a parameter that can be set on an object such as a channel to extend the line beyond its end point. This makes it easier to analyze, as the line will be extended into the future, based on the price movement between the starting point and the end point at a certain point in time.
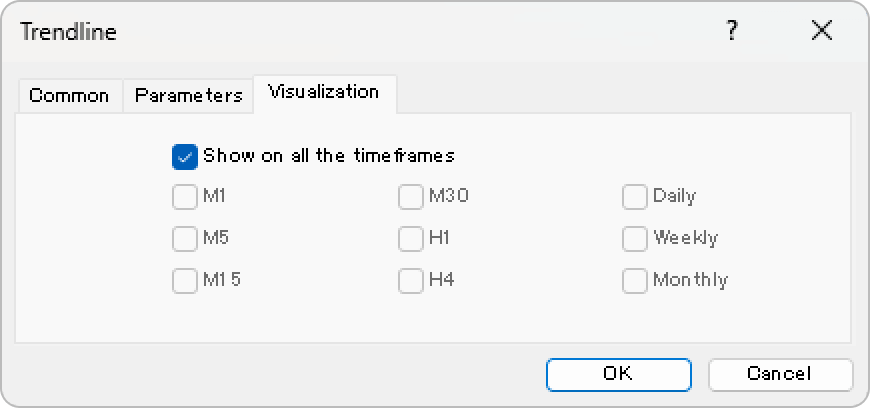
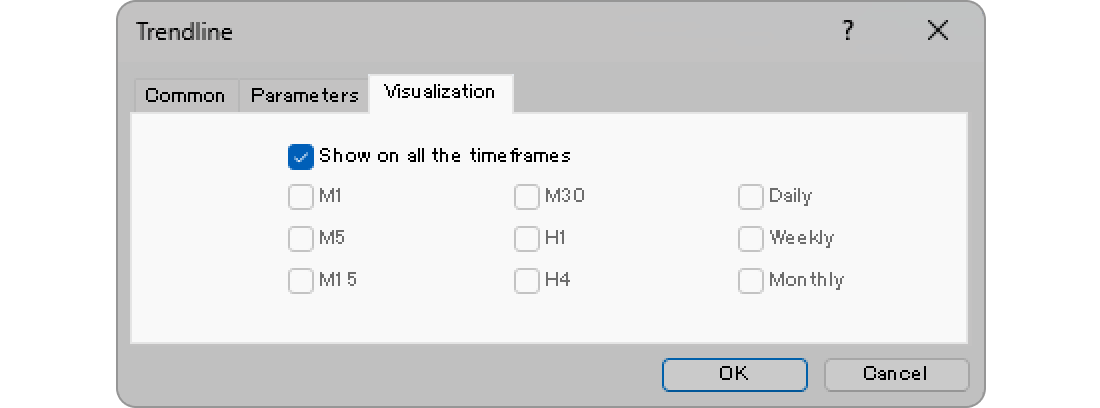
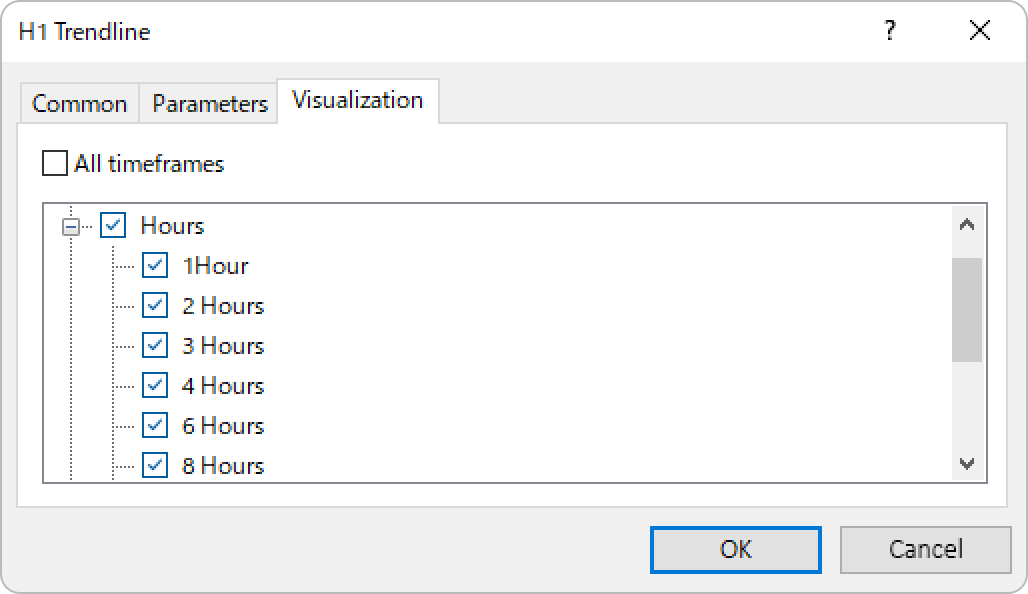
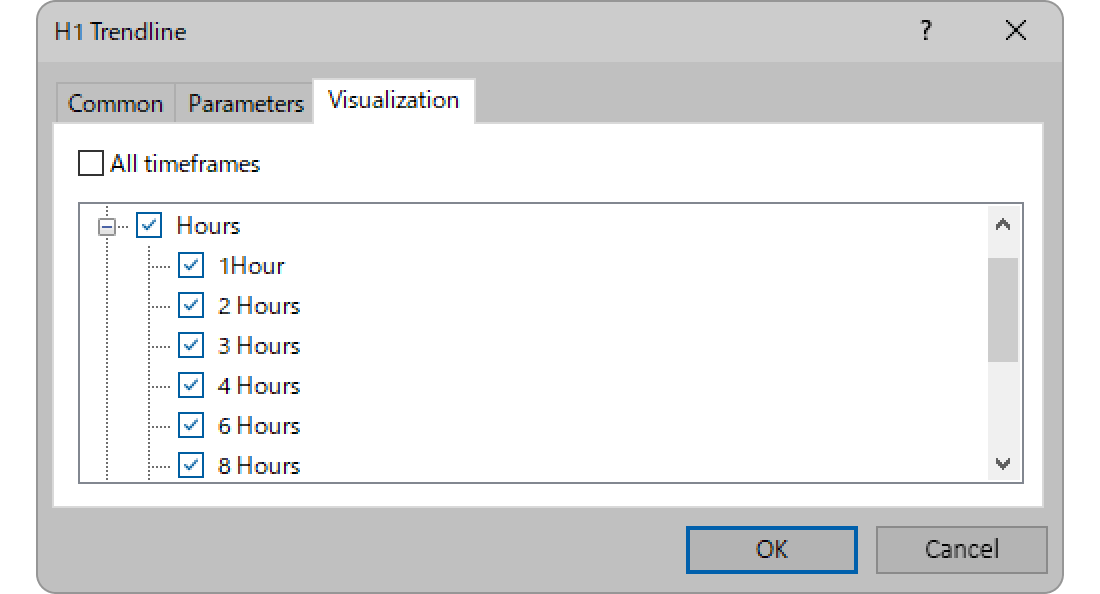
On the "Visualization" tab, you can specify the timeframes to use the trendline with.
Unlike conventional trendlines, which connect two highs or two lows, internal trendlines are drawn between various points, such as highs and lows or closes and lows. This approach offers greater flexibility and a fresh analytical perspective but can also introduce a high degree of subjectivity.
Trendlines can be displayed from the menu or toolbar.
Click "Insert" in the menu. Hover the pointer over "Objects" > "Lines" and select "Trendline".
Trendline
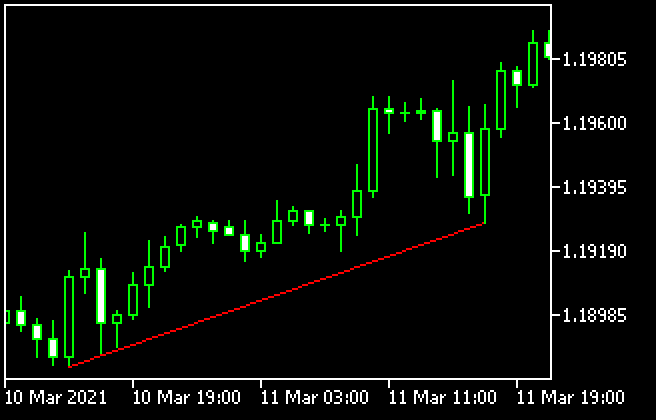
Trendline connects the low, high, or close prices to read the trend. The trendline will help you determine the direction and momentum of a trend.
Trend By Angle
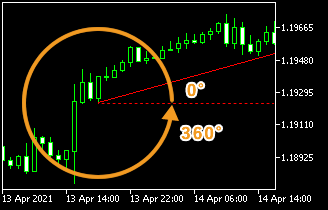
Trendline by Angle is the trendline with a specified angle. The angle relative to the horizontal line will be displayed. Analyze the angle of the trend line to determine the strength of a trend.
Cycle Lines
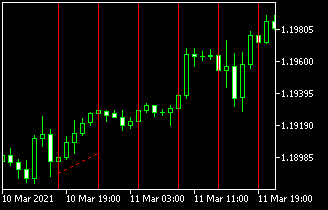
Cycle lines are made up of multiple evenly-spaced vertical lines. This tool is based on the theory that a trend repeats itself in cycles. Analyze the cycle line to help you determine the ceiling and floor of a trend.
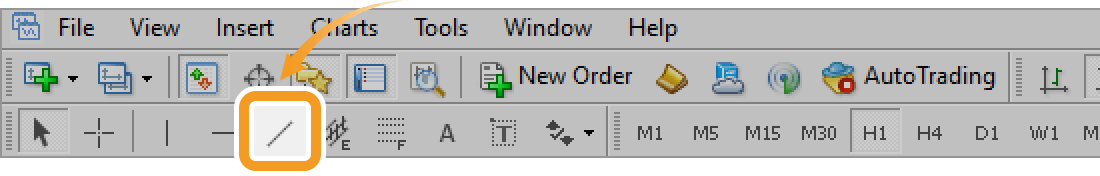
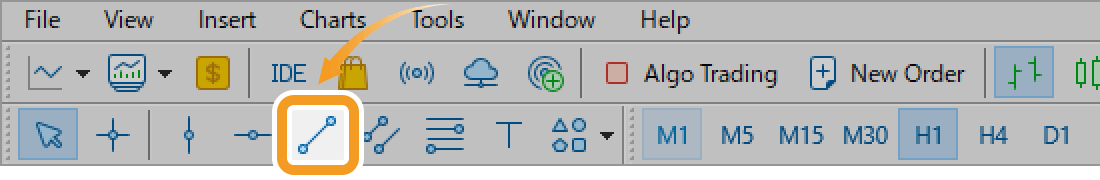
Click the "Draw trendline" button on the toolbar.
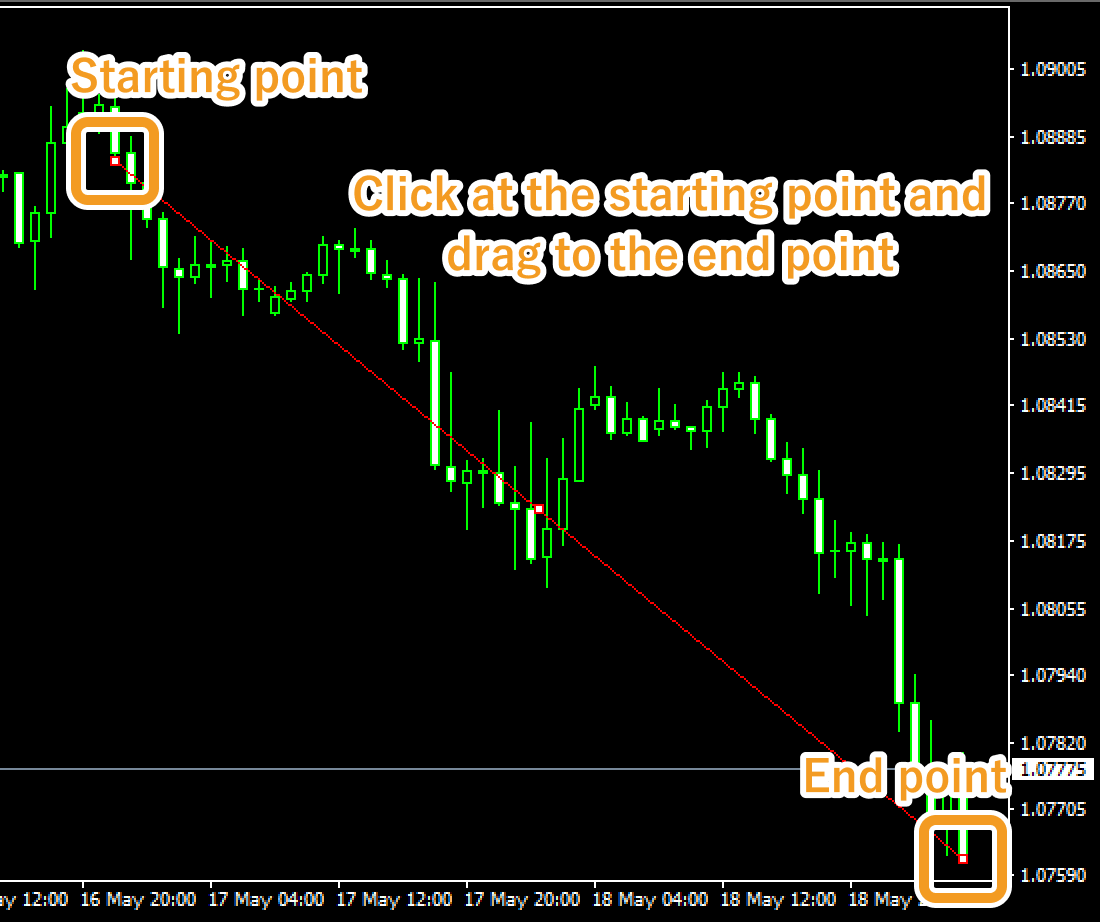
Click at the starting point of the trendline on the chart and drag to the end point.
If you want to adjust the position of trendline, make sure the white dots are being displayed on the trendline and move each dot as necessary. If you cannot see the white dots, double-click near the trendline to display the white dots.
|
Number |
Descriptions |
|---|---|
|
1 |
Change the starting point of the trendline. |
|
2 |
Change the position of the trendline. |
|
3 |
Change the end point of the trendline. |
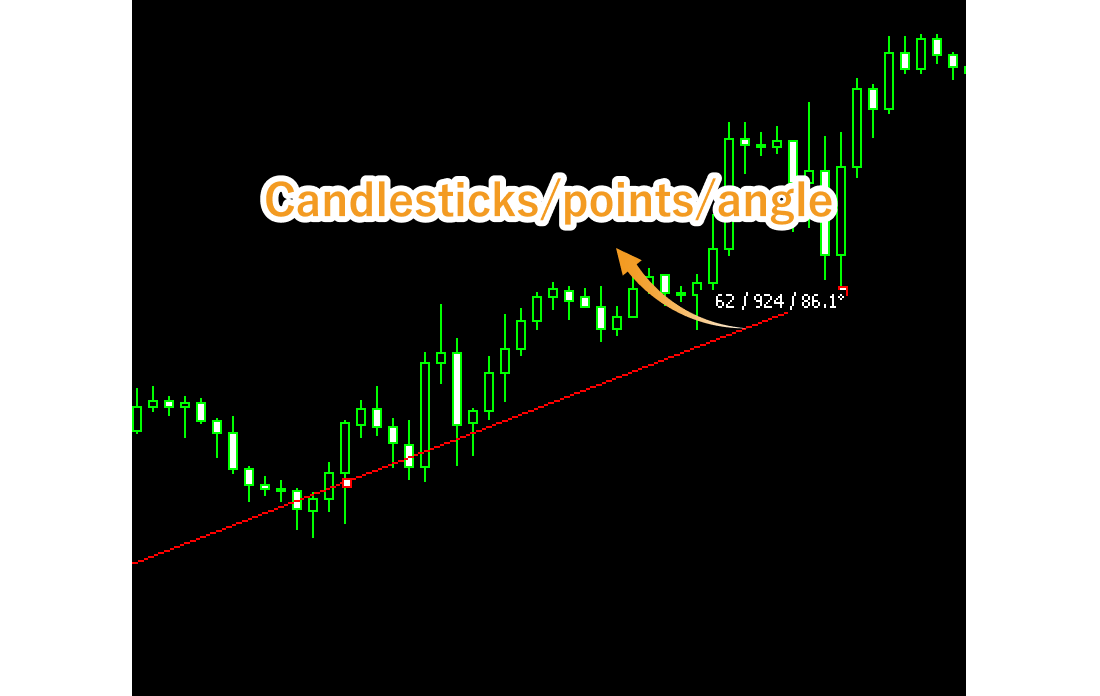
Values displayed when dragging indicate the numbers of candlesticks and points from the starting point to the end point.
To modify the trendline settings, right-click near the trendline and select "Properties".
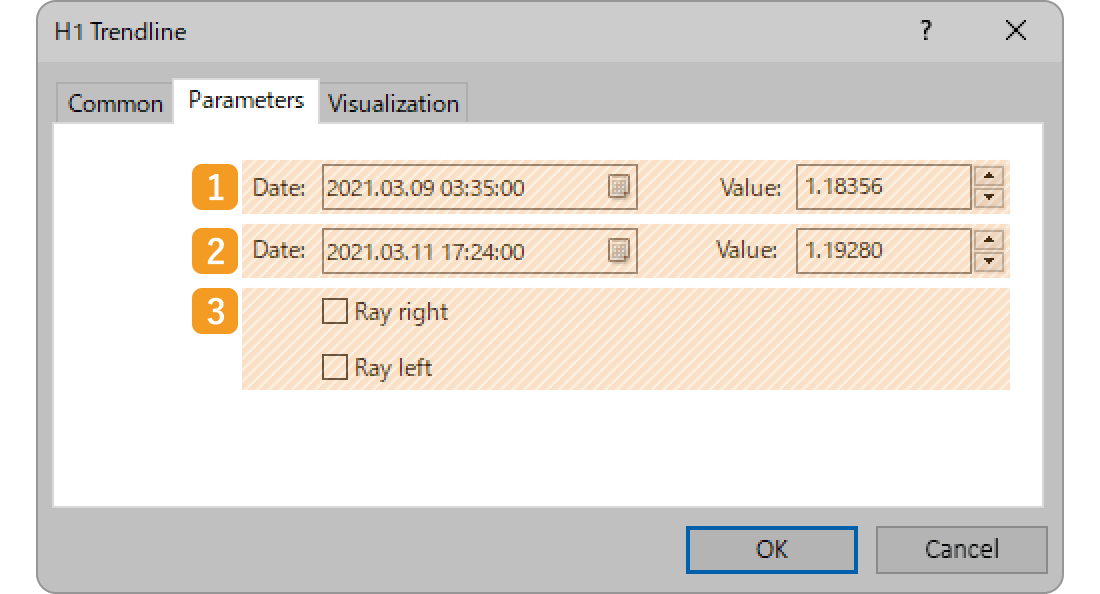
Edit the parameters of the trendline in the three tabs, "Common", "Parameters", and "Visualization", and click "OK".
|
Number |
Item name |
Descriptions |
|---|---|---|
|
1 |
Name |
Name the trendline. |
|
2 |
Description |
The description of the trendline can be displayed on the chart. |
|
3 |
Style |
Set the color, line type, and line thickness for the trendline. |
|
4 |
Draw object as background |
Check this box if you want to place the trendline behind the chart. |
|
5 |
Disable selection |
Check this box if you want to disable the editing of the trendline. |
|
Number |
Item name |
Descriptions |
|---|---|---|
|
1 |
Starting point position |
Specify the starting point position by date and price. |
|
2 |
End point position |
Specify the end point position by date and price. |
|
3 |
Ray |
Check each box to extend the trendline to the left and right. |
"Ray" is a parameter that can be set on an object such as a channel to extend the line beyond its starting or end point. This makes it easier to analyze, as the line will be extended into the past or future, based on the price movement between the starting point and the end point at a certain point in time.


On the "Visualization" tab, you can specify the timeframes to use the trendline with.
Unlike conventional trendlines, which connect two highs or two lows, internal trendlines are drawn between various points, such as highs and lows or closes and lows. This approach offers greater flexibility and a fresh analytical perspective but can also introduce a high degree of subjectivity.

Was this article helpful?
0 out of 0 people found this article helpful.
Thank you for your feedback.