Use the crosshair mode
Charts (PC)
Charts (PC)

This article was :
published
updated
On MetaTrade4 (MT4) / MetaTrader5 (MT5), you can use the crosshair mode to analyze the time and price transition from point A to point B, as well as the time and price at the given point.
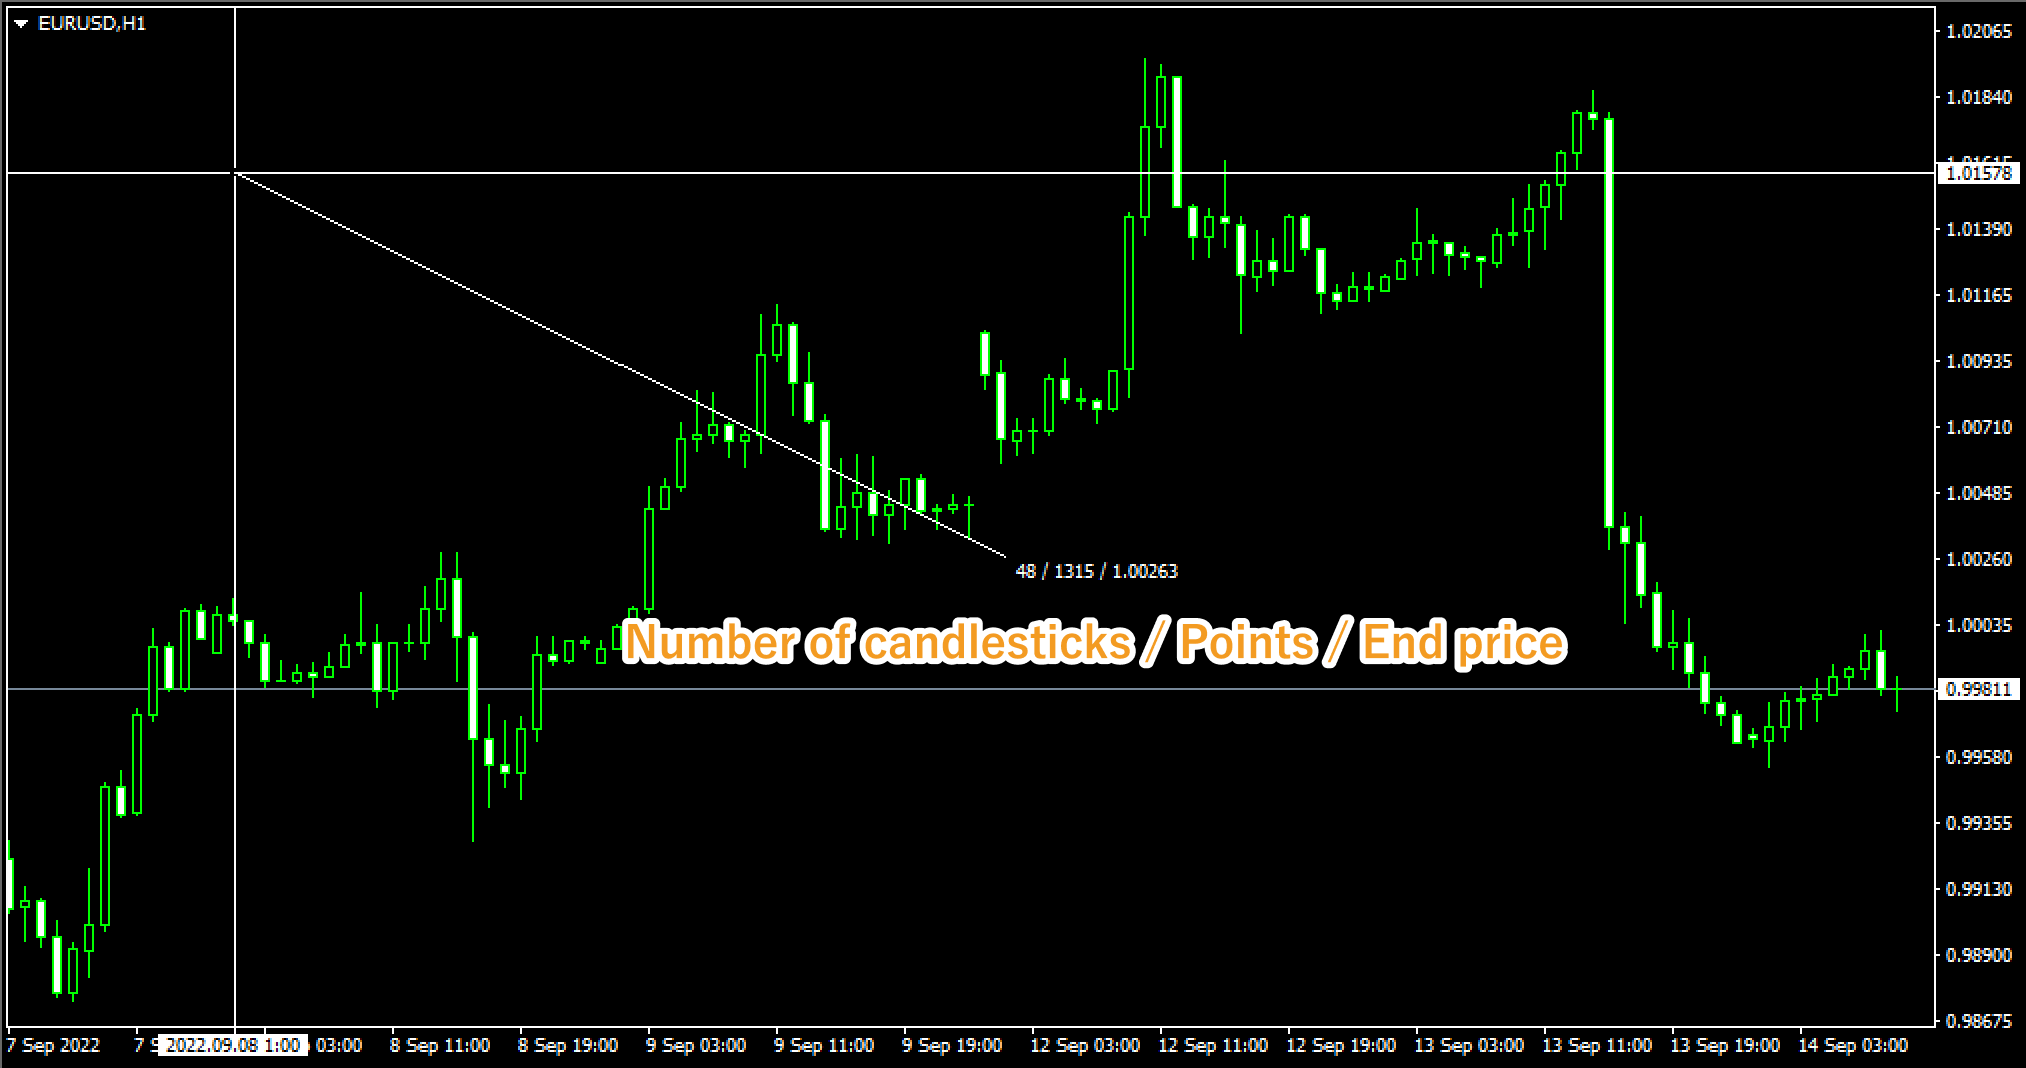
Drag the crosshair on the chart from start to end to show the following information: number of candlesticks in between, points, and end price on MT4, and additionally the price change on MT5.
Here we will look at how to use the crosshair mode on MT4/MT5.
Switch between MT4/MT5 tabs to check the steps for each.
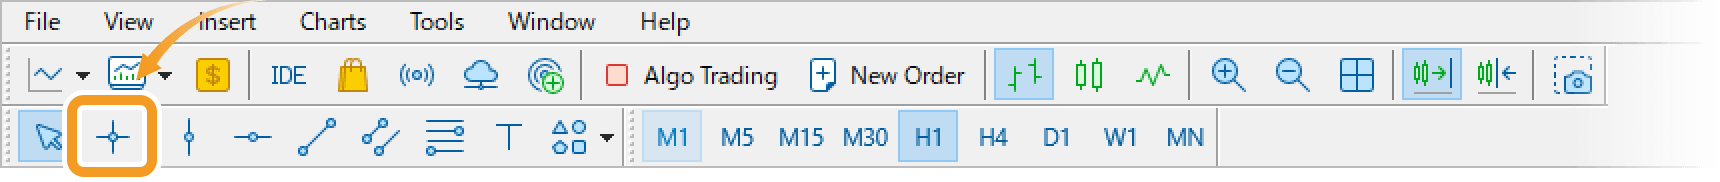
Click the "Crosshair" button in the toolbar.
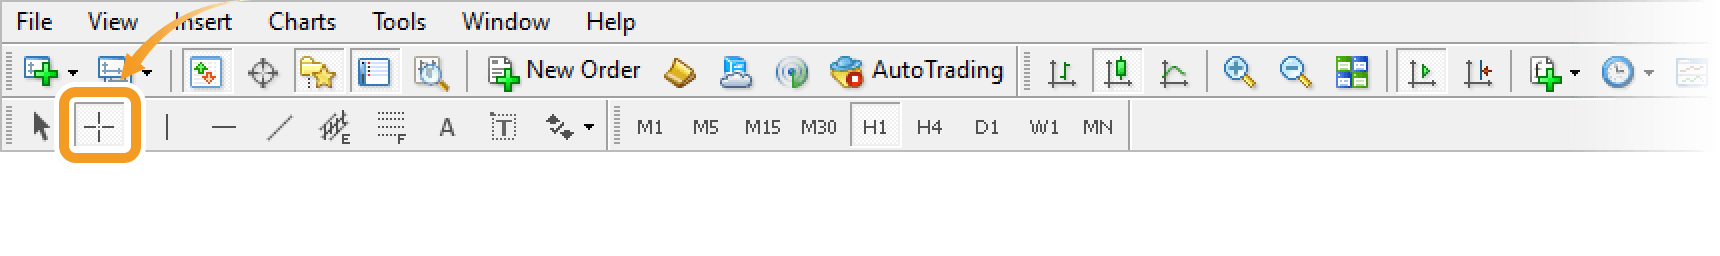
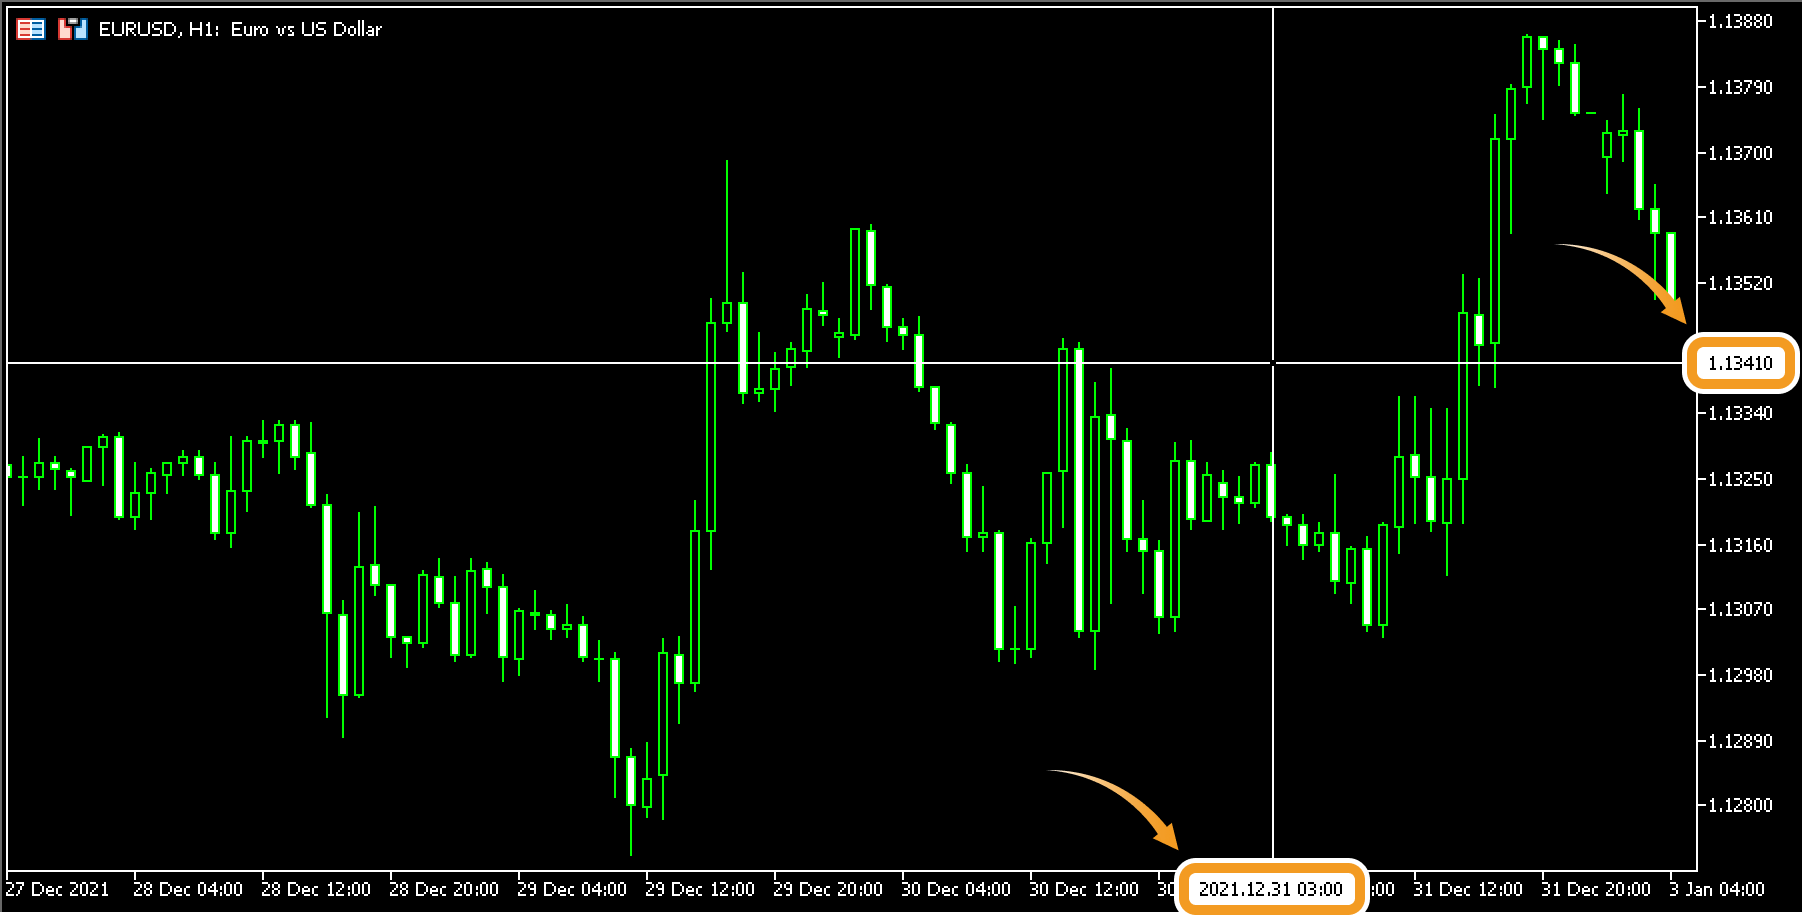
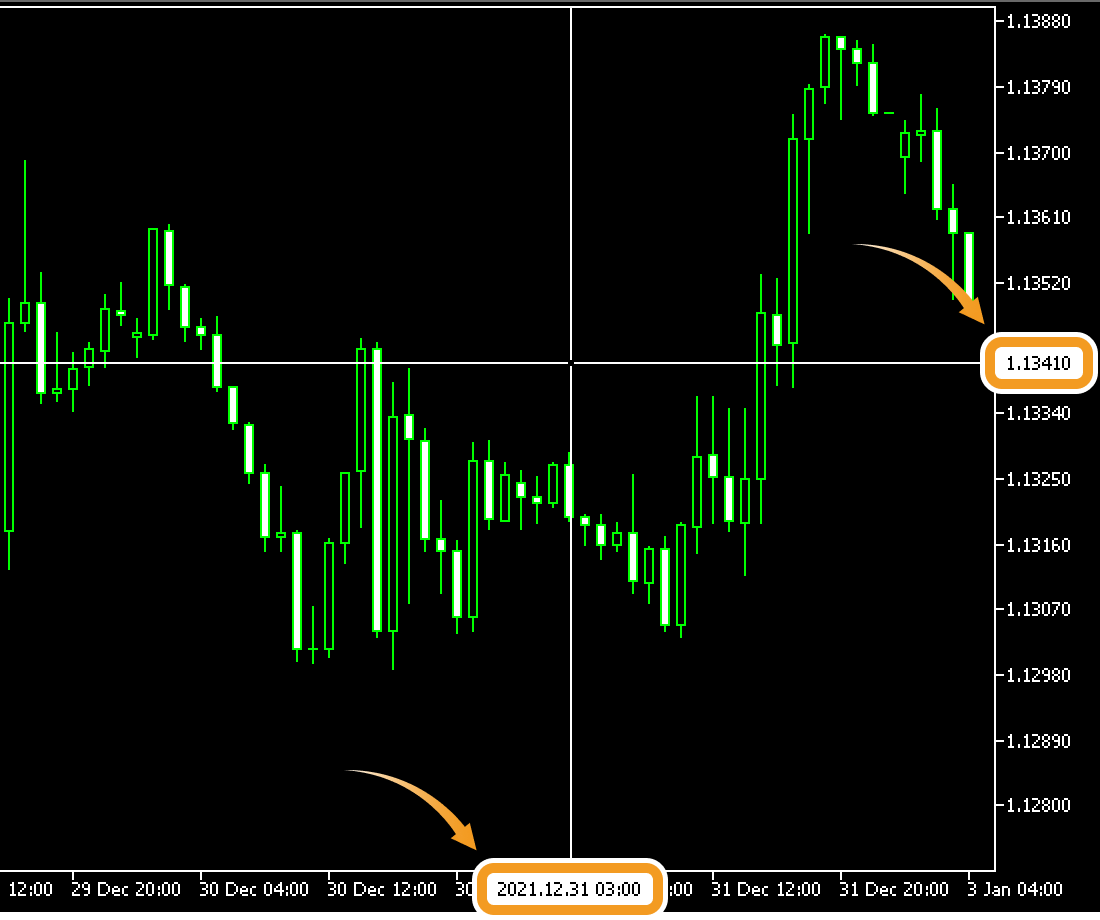
The pointer on the chart will change to a crosshair. By moving it to the place you like, you can check the price on the vertical axis and the time on the horizontal axis. To end this feature, click on the chart.
When using a mouse, you can change the pointer to a crosshair by pressing the scroll wheel on a chart.
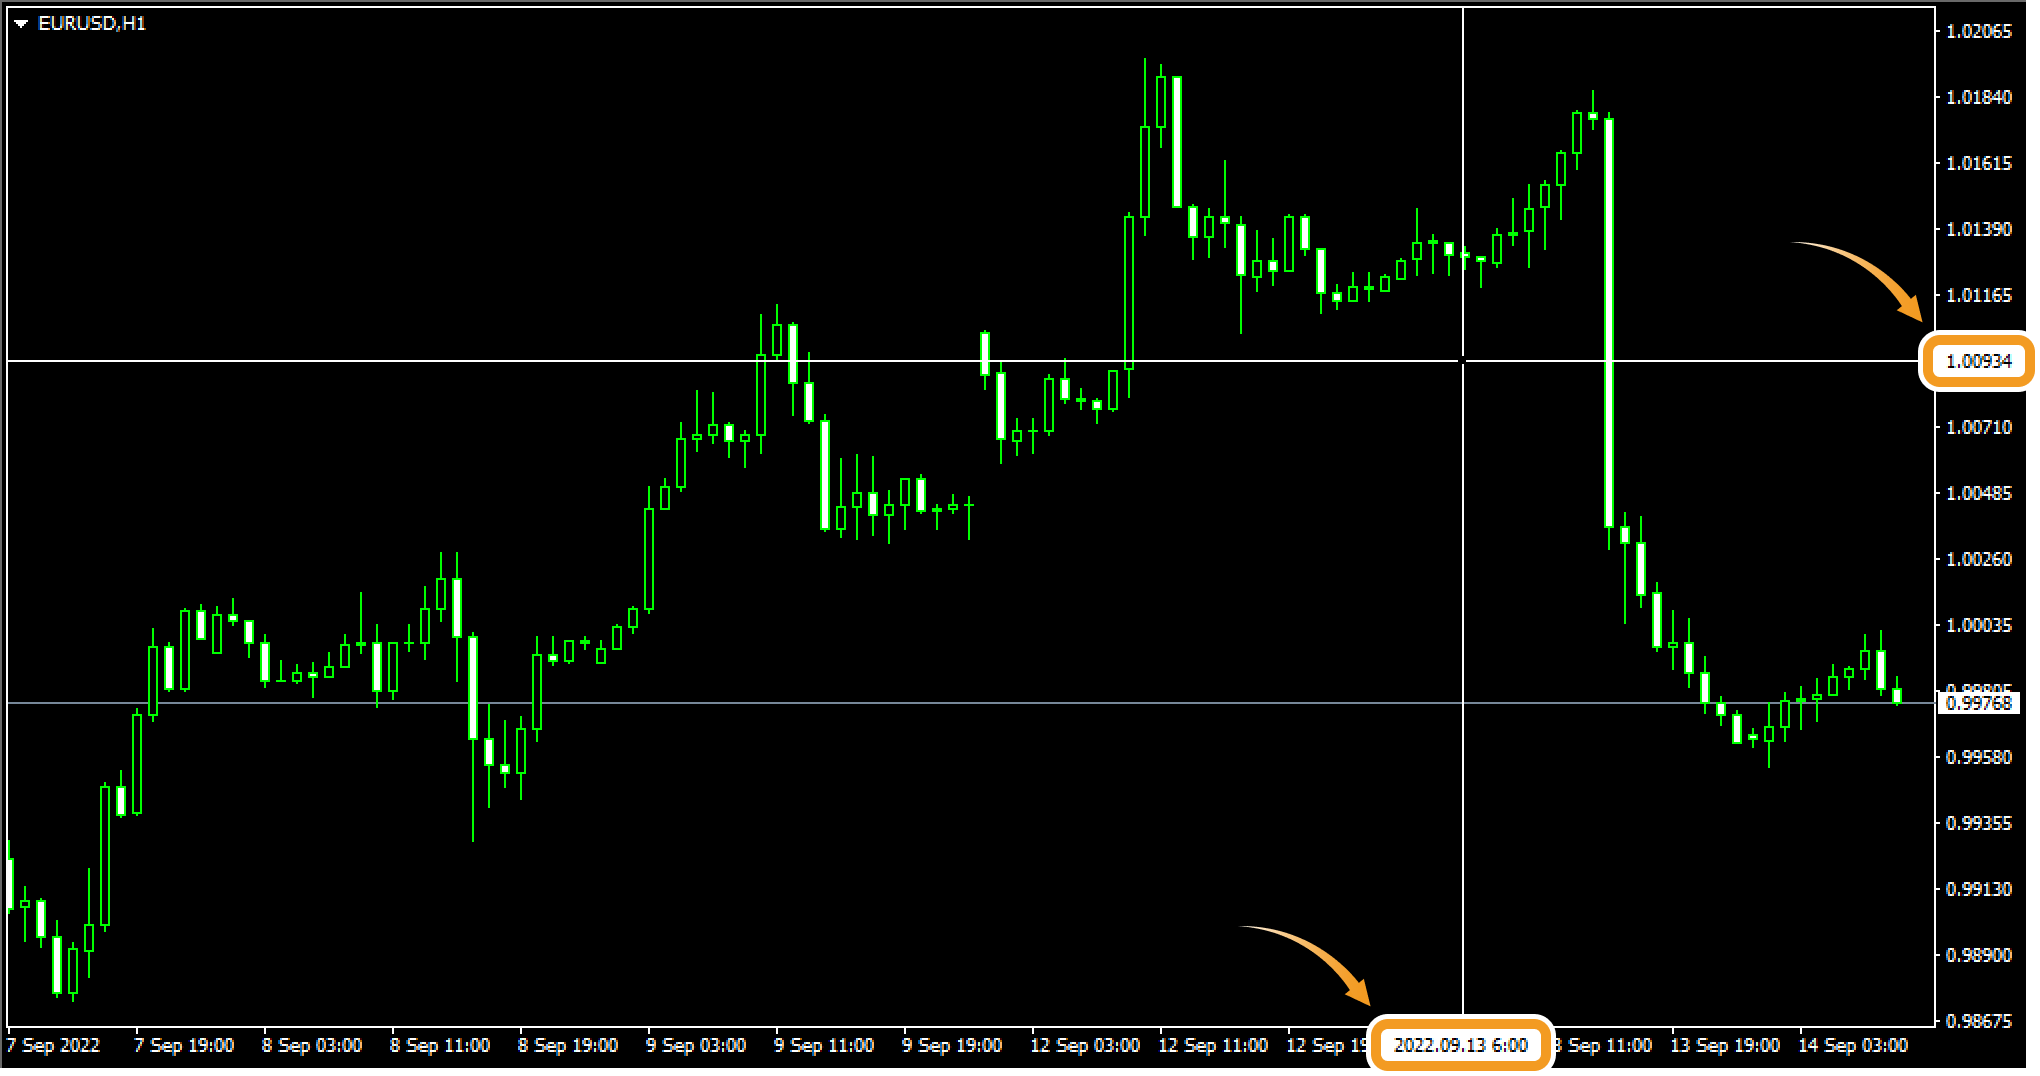
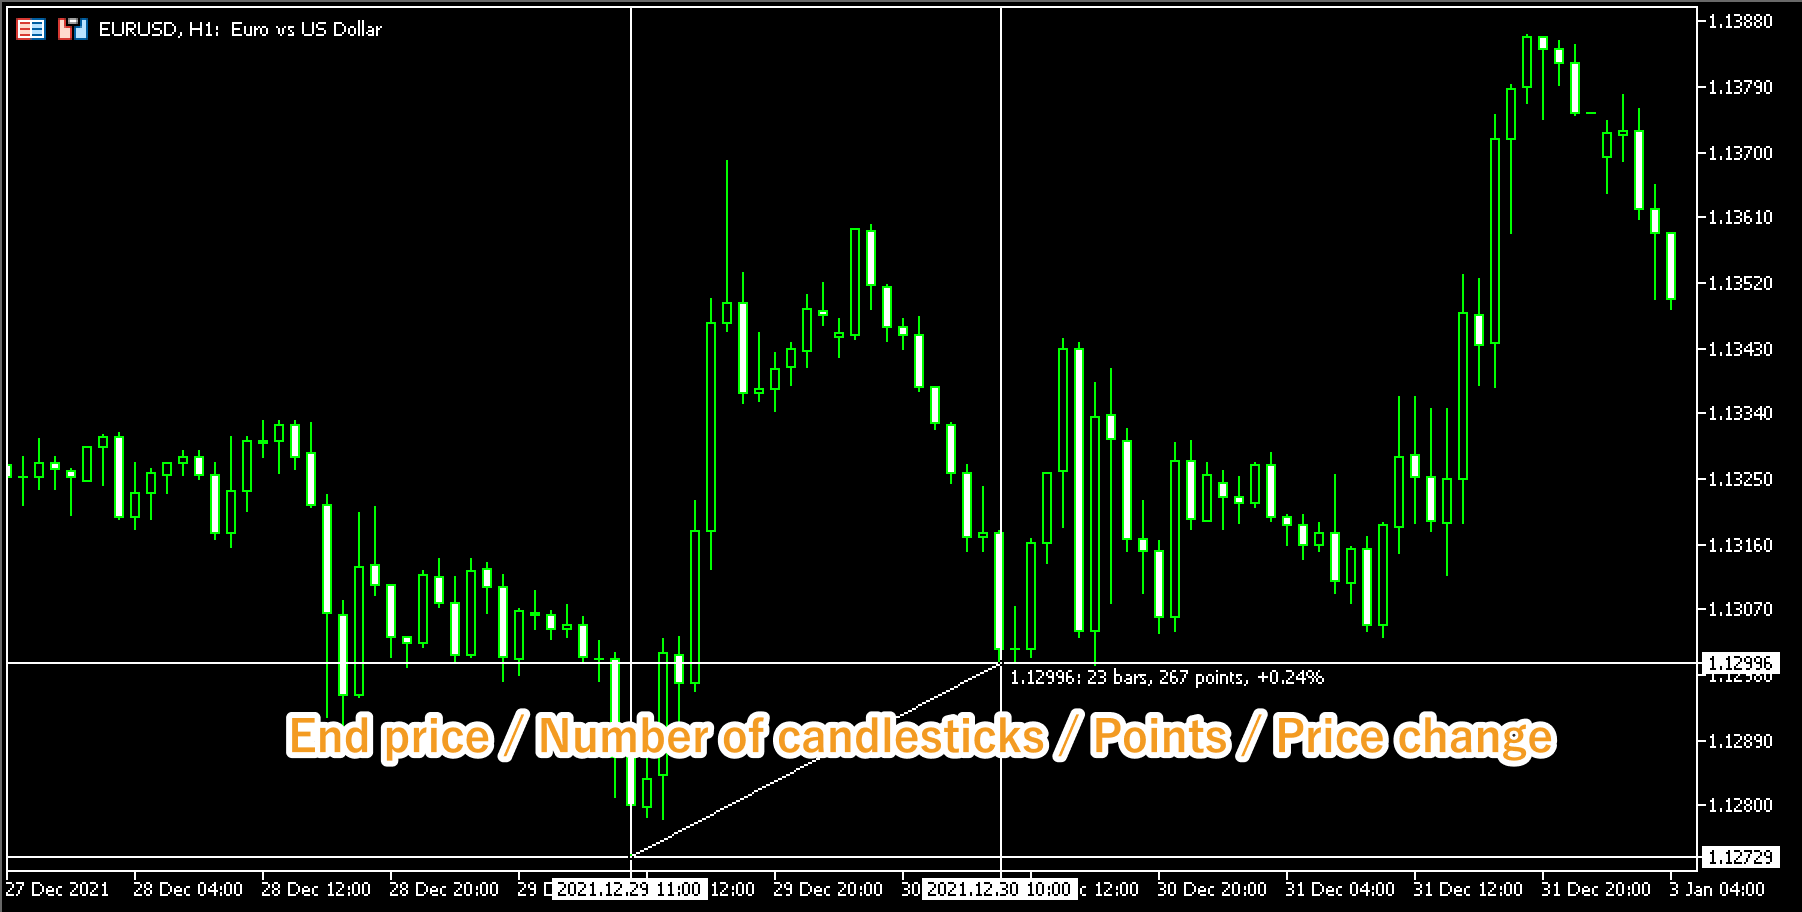
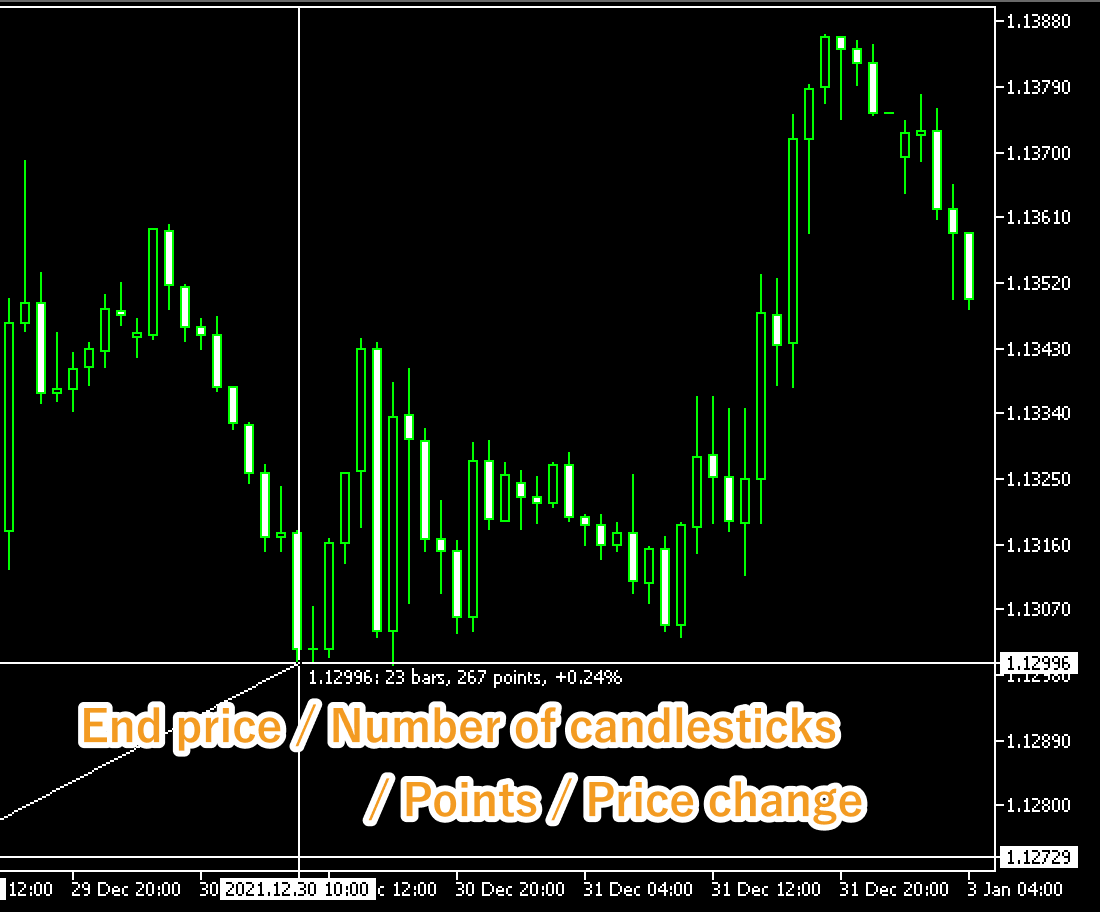
Left-click at one point and drag to another point to see the time and price transition between them. Note that if you release the button, the crosshair will disappear. The number of candlesticks in between, points, and end price will be displayed at the end point until you release the button.
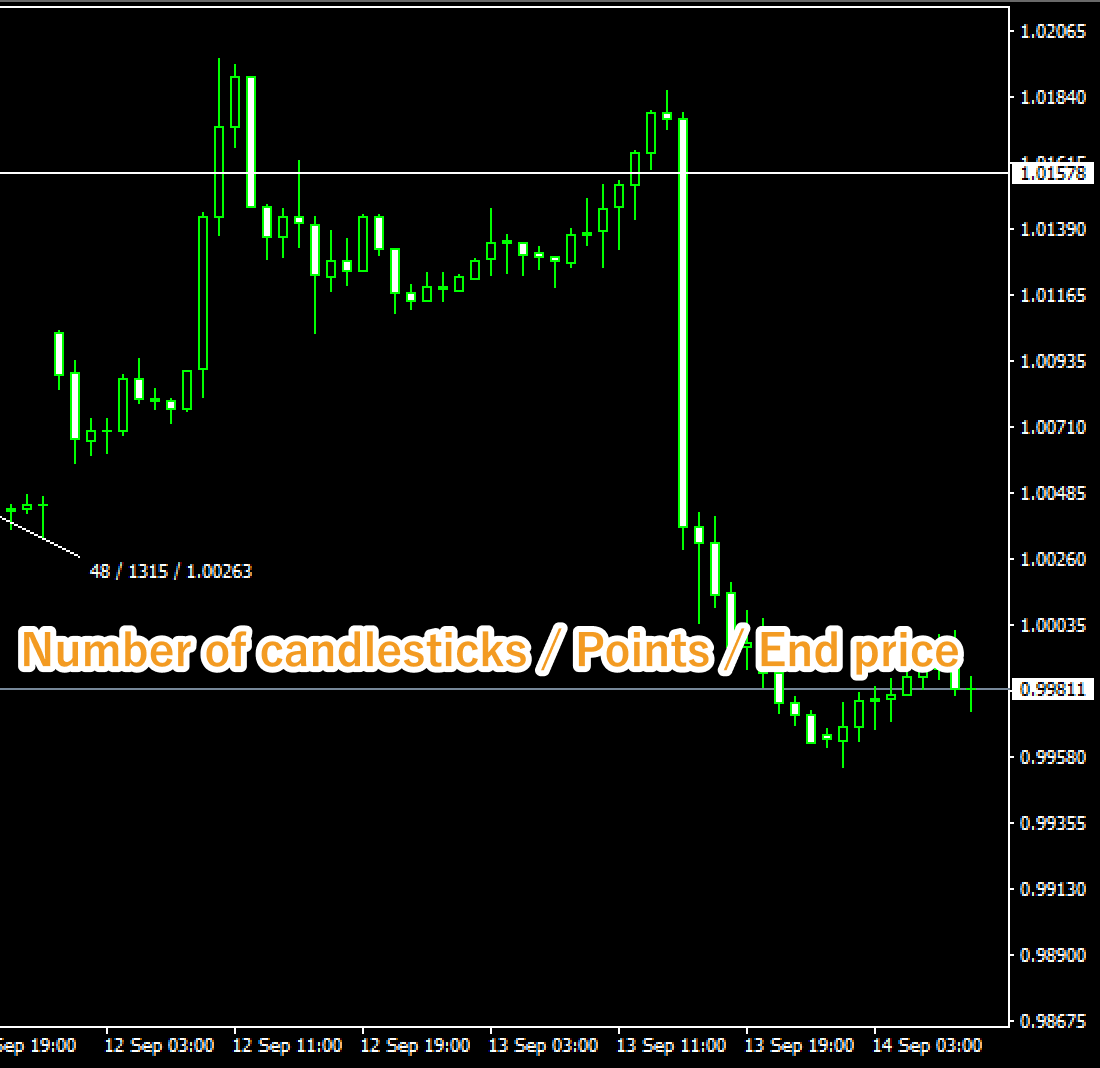
On MT5, the crosshair mode shows the price change in addition to the number of candlesticks in between, points, and end price.
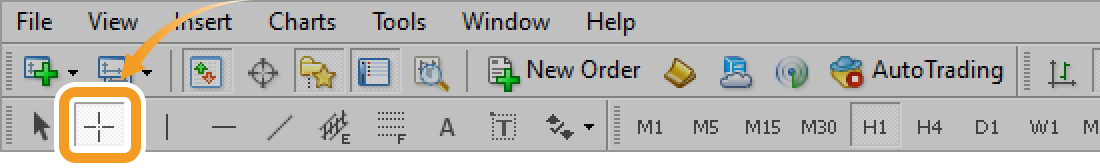
Click the "Crosshair" button in the toolbar.
The pointer on the chart will change to a crosshair. By moving it to the place you like, you can check the price on the vertical axis and the time on the horizontal axis. To end this feature, click on the chart.
When using a mouse, you can change the pointer to a crosshair by pressing the scroll wheel on a chart.
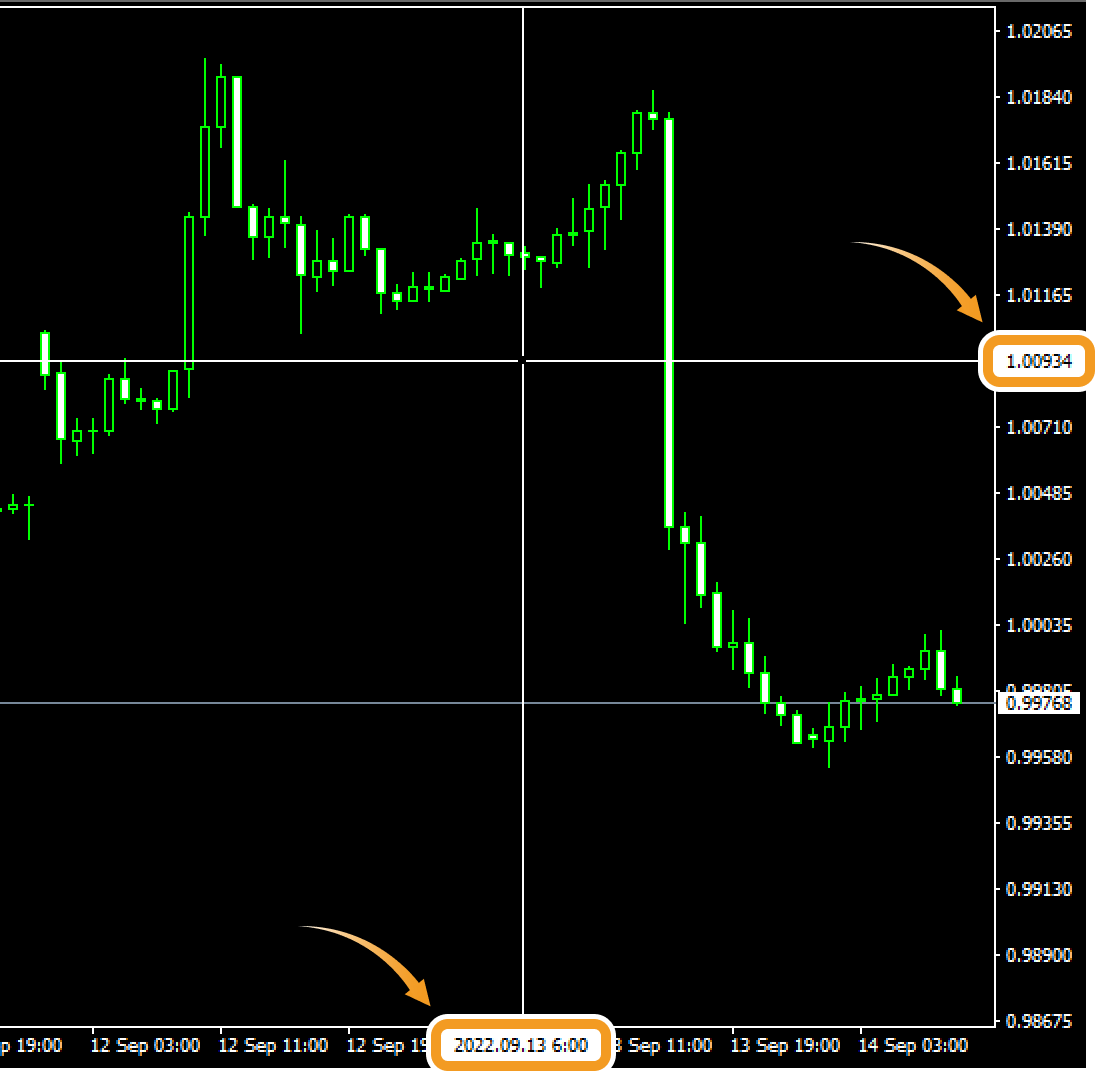
Left-click at one point and drag to another point to see the time and price transition between them. Note that if you release the button, the crosshair will disappear. The number of candlesticks in between, points, the end price, and the price change will be displayed at the end point until you release the button.
Was this article helpful?
0 out of 0 people found this article helpful.
Thank you for your feedback.