MT4/MT5: Add RSI to chart
EA, indicators & objects (PC)
EA, indicators & objects (PC)

This article was :
published
updated
In MetaTrader 4 (MT4) and MetaTrader 5 (MT5), you can display the Relative Strength Index (RSI), a technical indicator developed by J.W. Wilder. The RSI evaluates overbought or oversold conditions based on price movements.
Here we will look at how to add RSI to a chart on MT4/MT5.
Switch between MT4/MT5 tabs to check the steps for each.
RSI can be set up from the menu or the Navigator.
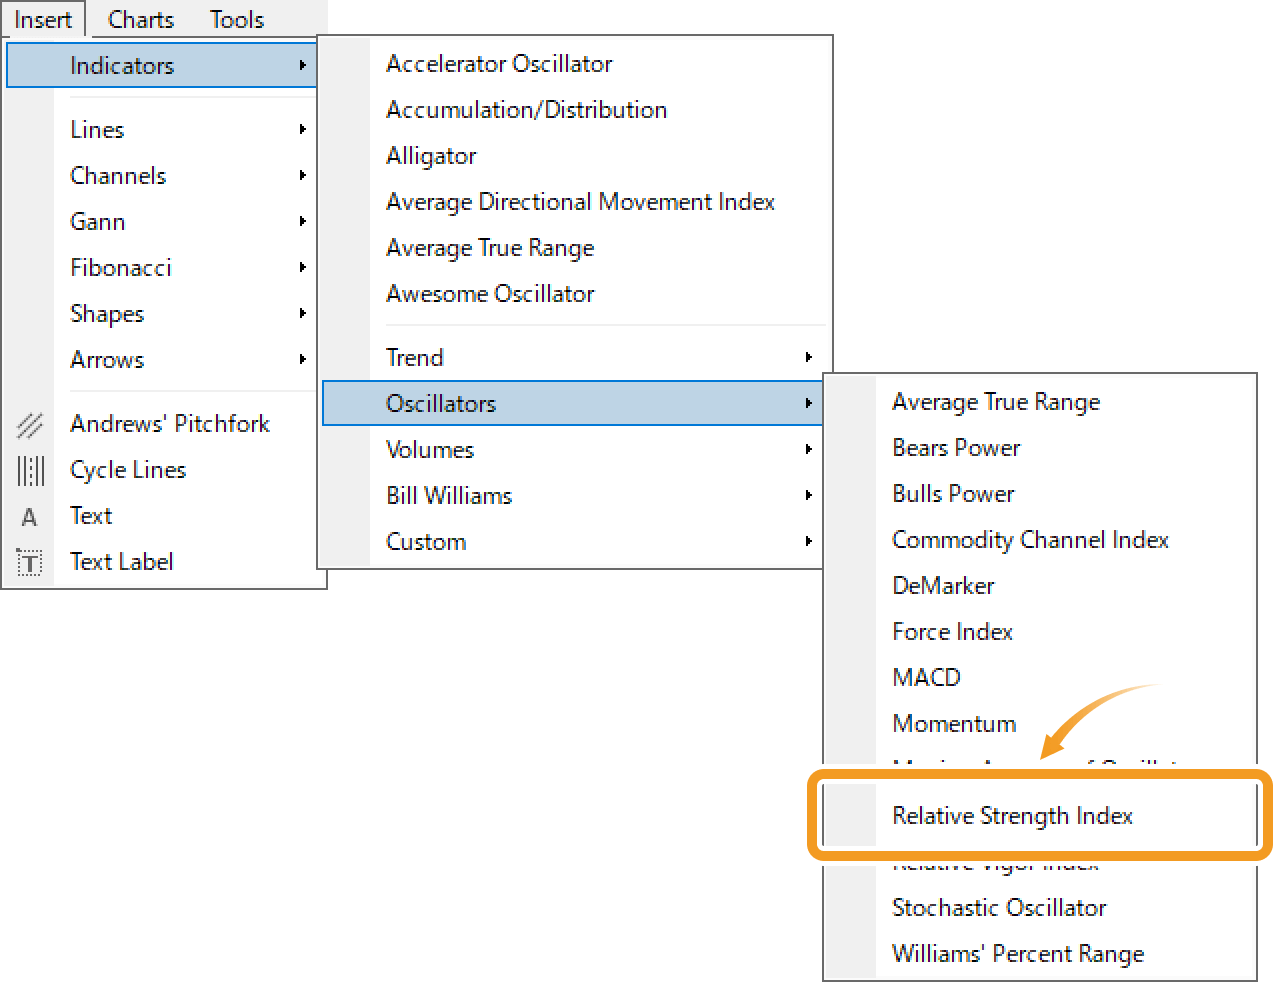
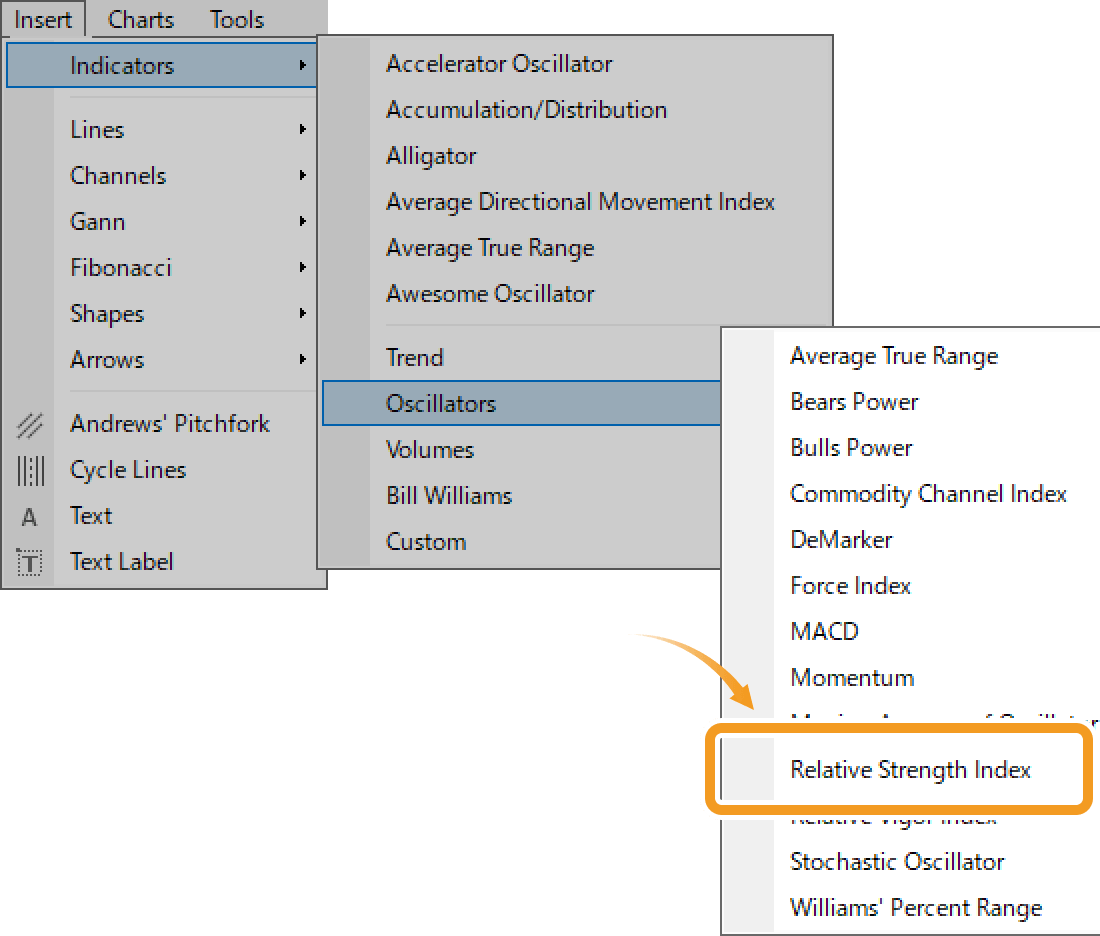
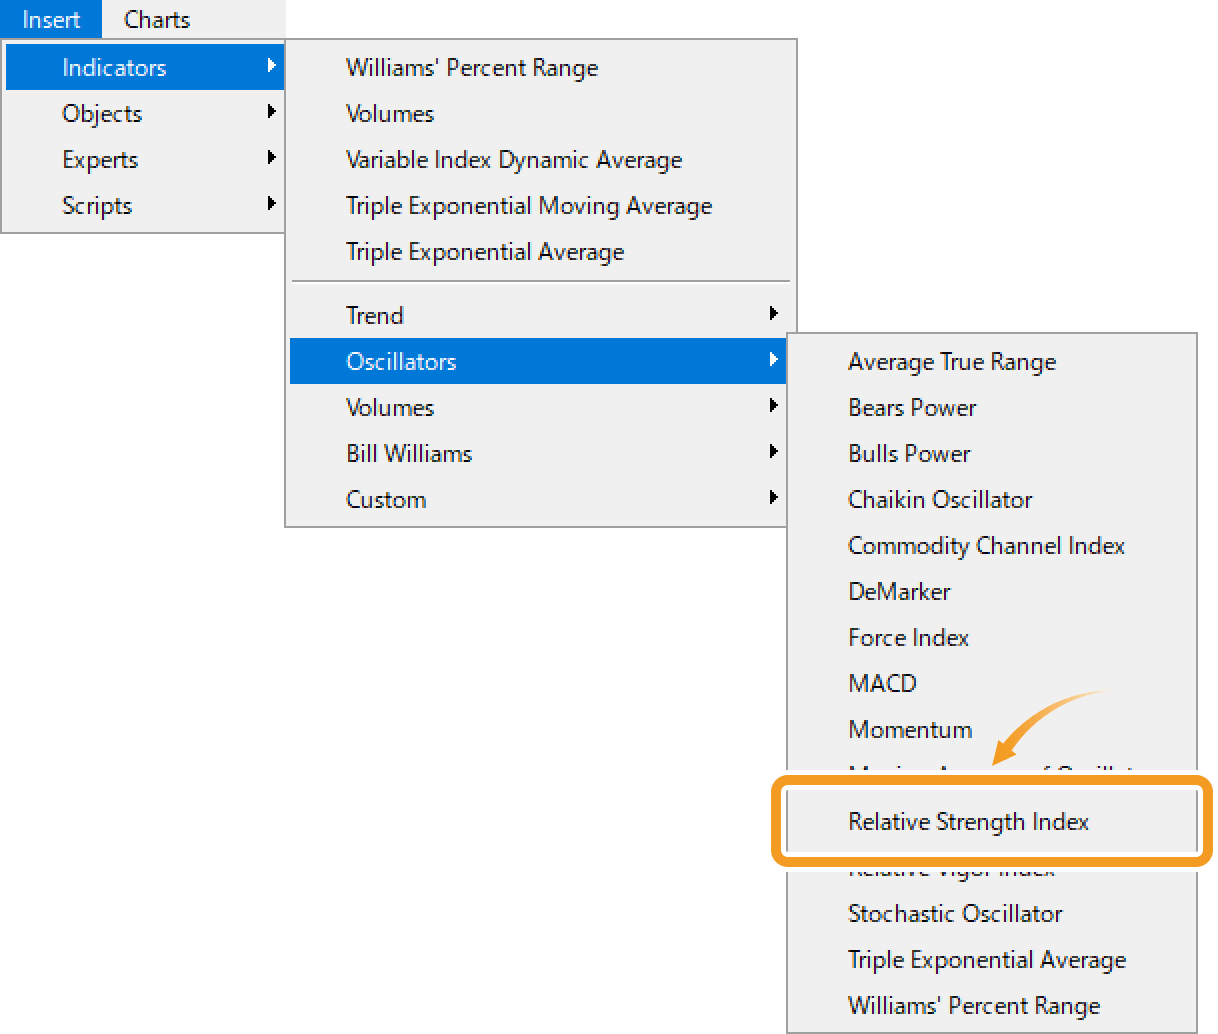
Click "Insert" in the menu. Hover the pointer over "Indicators" > "Oscillators" and select "Relative Strength Index".
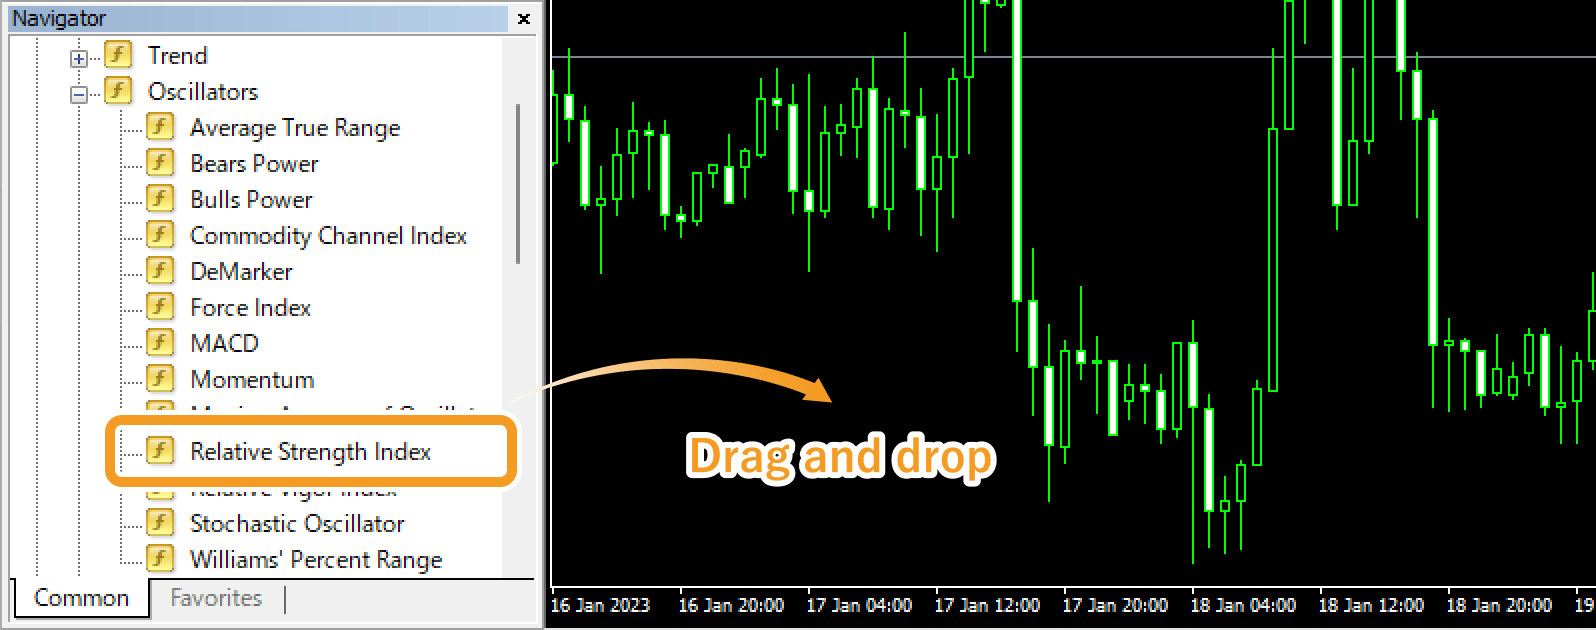
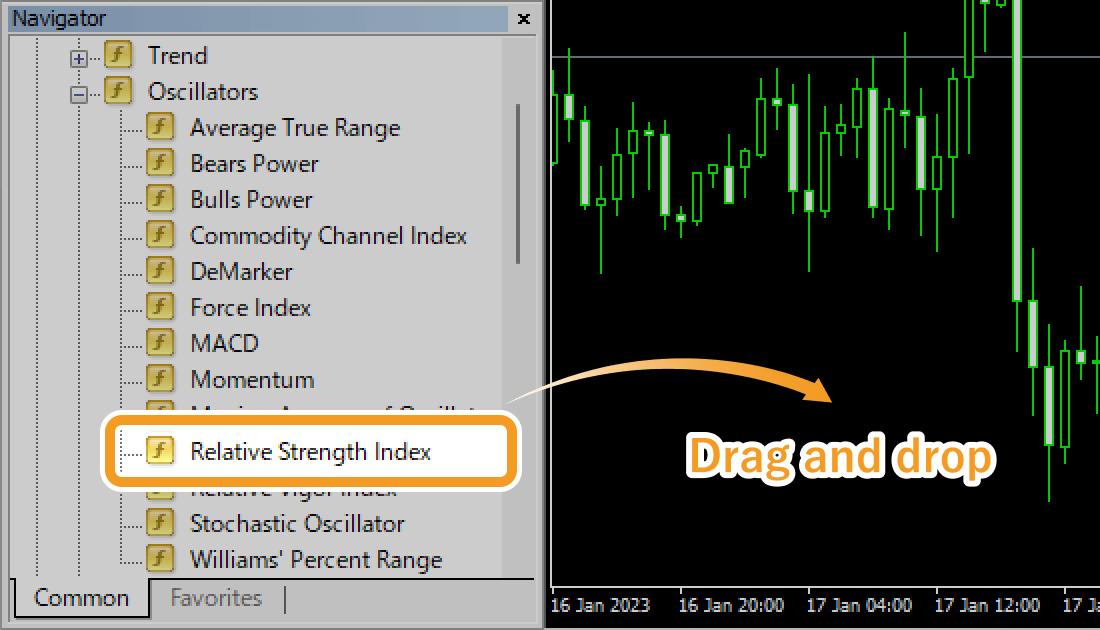
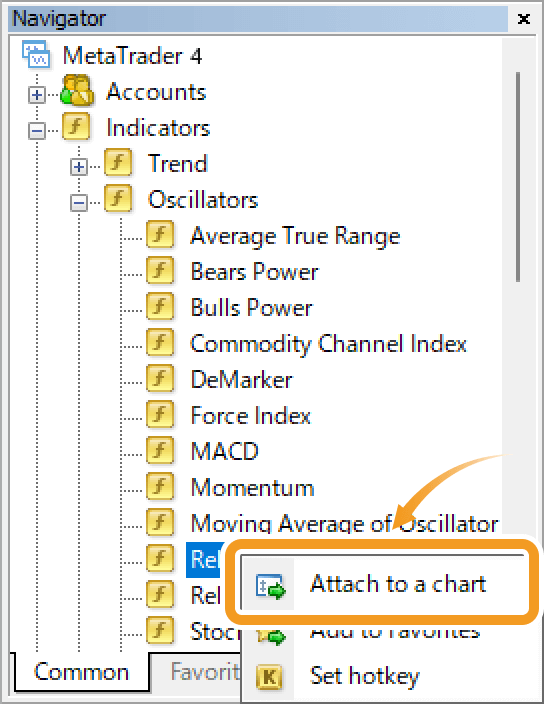
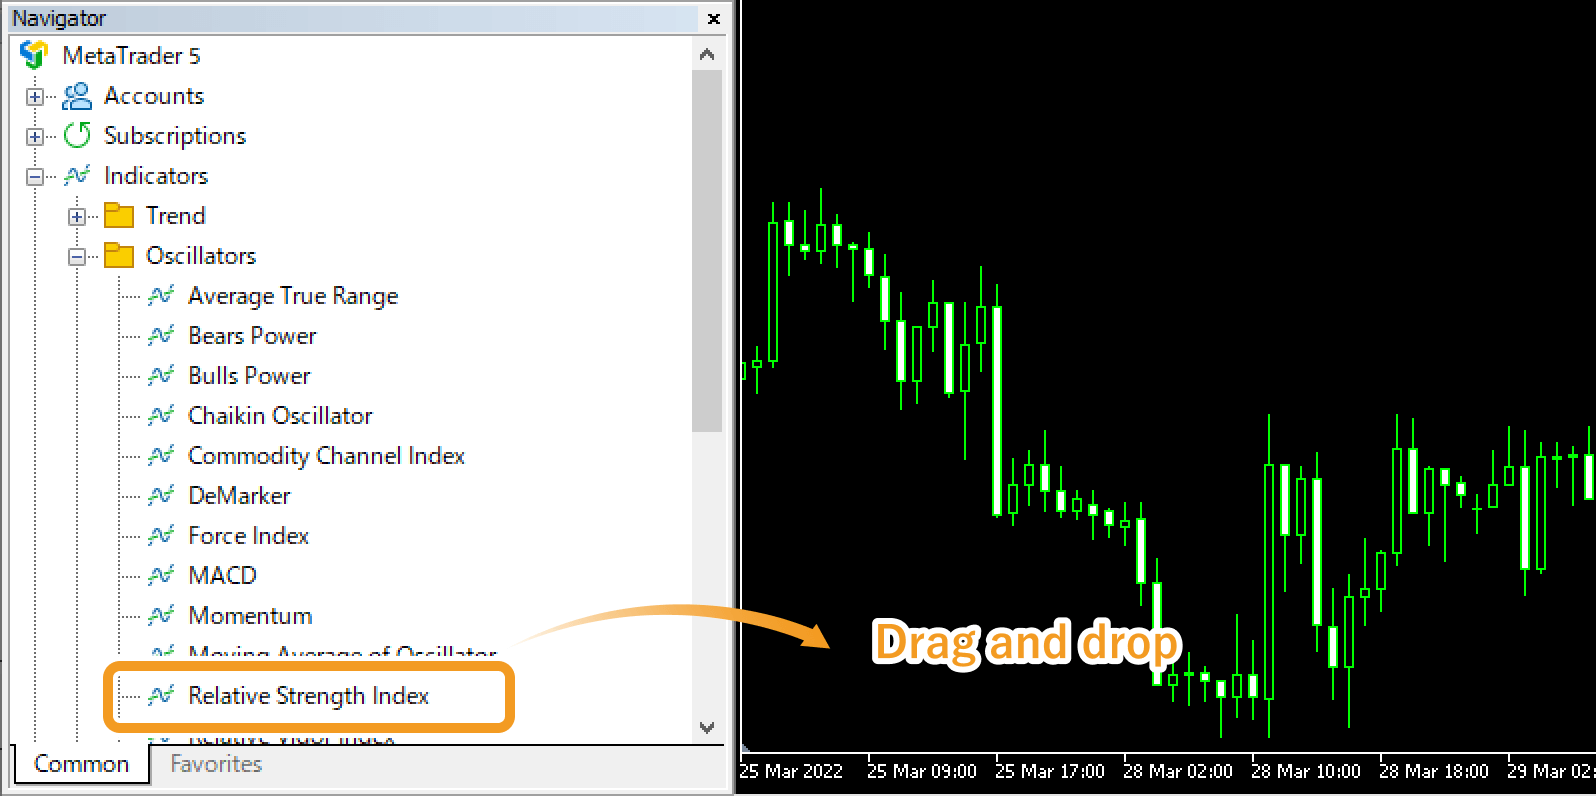
On the Navigator, click on the "+" signs next to "Indicators" and then "Oscillators". Select "Relative Strength Index" and drag it onto the chart you wish to apply it to.
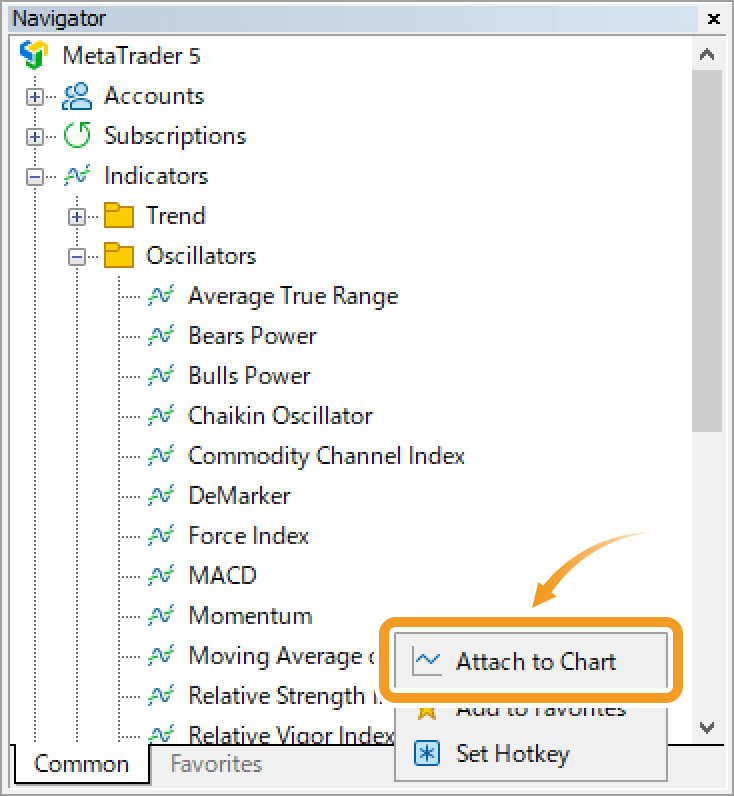
Or, right-click on "Relative Strength Index" and select "Attach to a chart".
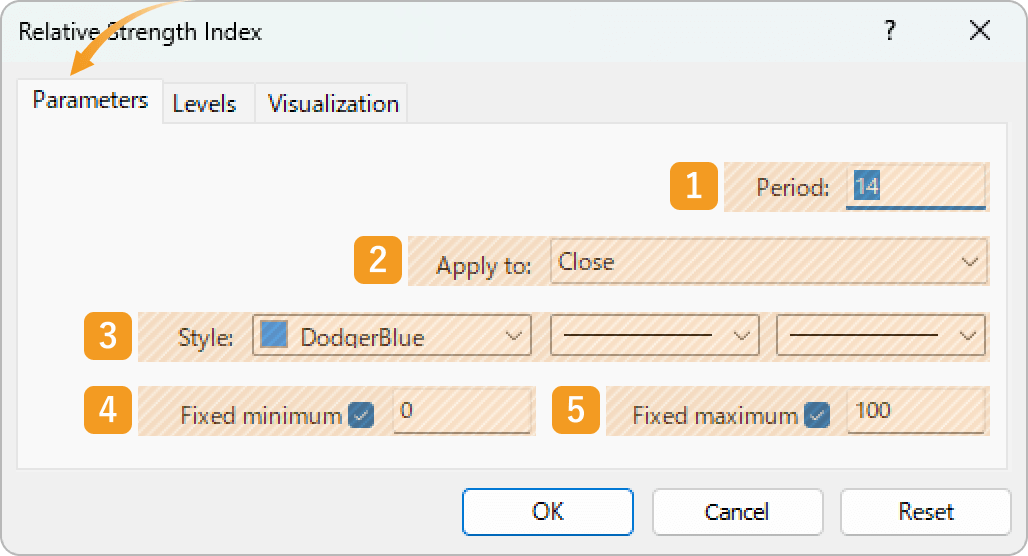
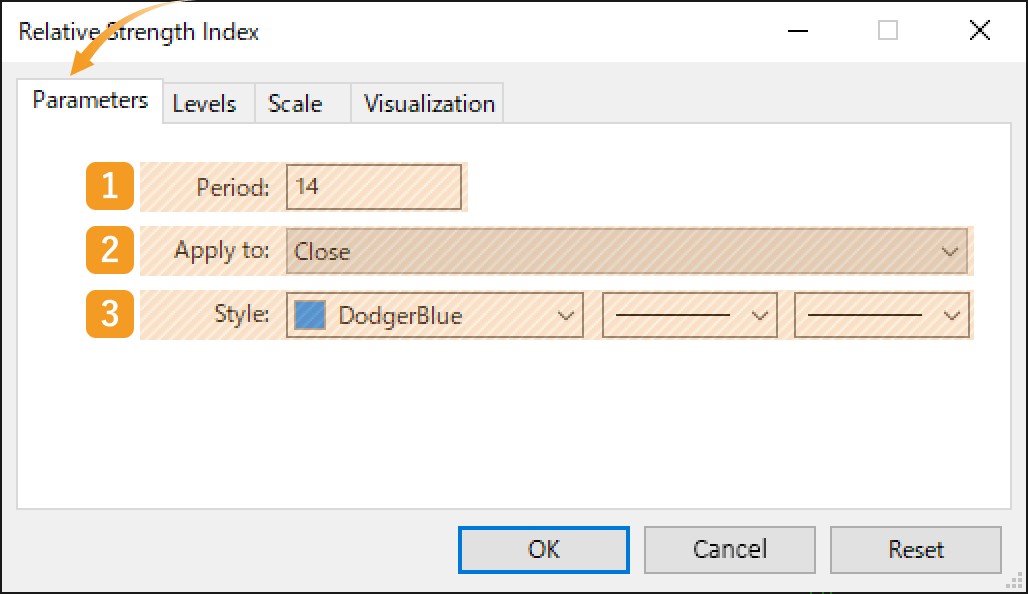
The setting window for RSI will appear. Set the parameters in the "Parameters", "Levels", and "Visualization" tabs and click "OK".
|
Number |
Item name |
Descriptions |
|---|---|---|
|
1 |
Period |
Set the period for the RSI. The unit here is the number of candlesticks. If you select the daily chart and set it to "14", the RSI for the past 14 days will be generated. |
|
2 |
Apply to |
Price to use for calculating RSI. Close: close price Open: open price High: high price Low: low price Median Price (HL/2): (high price + low price) ÷2 Typical Price (HLC/3): (high price + low price + close price) ÷3 Weighted Close (HLCC/4): (high price + low price + close price×2) ÷4 Previous Indicator's Data: the value of the indicator displayed last First Indicator's Data: the value of the indicator displayed first |
|
3 |
Style |
Set the color, line type, and line thickness for RSI. |
|
4 |
Fixed minimum |
Set the minimum value of the RSI in the sub-window. |
|
5 |
Fixed maximum |
Set the maximum value of the RSI in the sub-window. |
Among the options in the "Apply to" field, "Previous Indicator's Data" and "First Indicator's Data" use the values of an indicator displayed in a sub-window, rather than the price of the chart's symbol.
For example, if volume is shown as the first indicator in a sub-window and you select First Indicator's Data, the RSI will be calculated based on the volume.
On MT4, these options remain visible even when not available, but if selected in such cases, they will automatically default to Close.
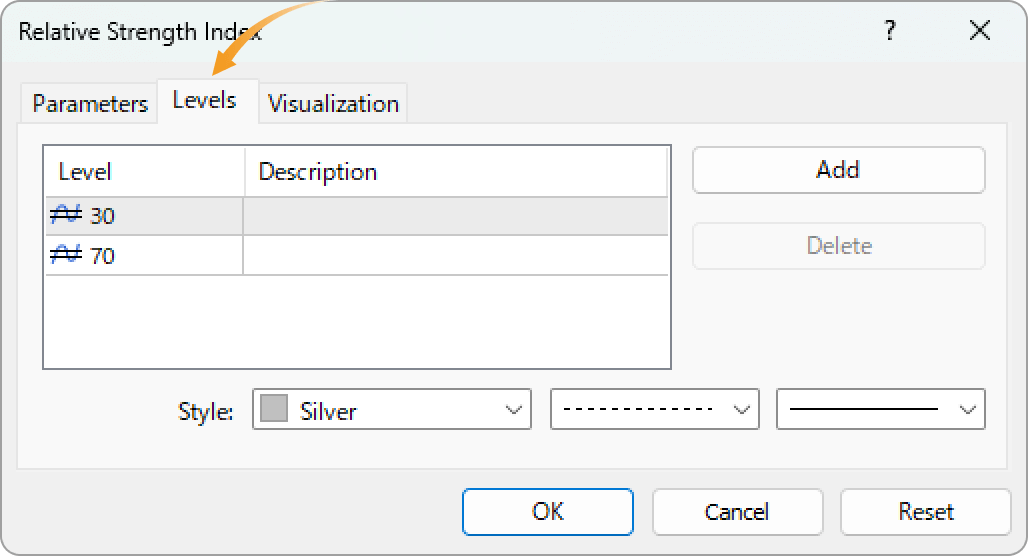
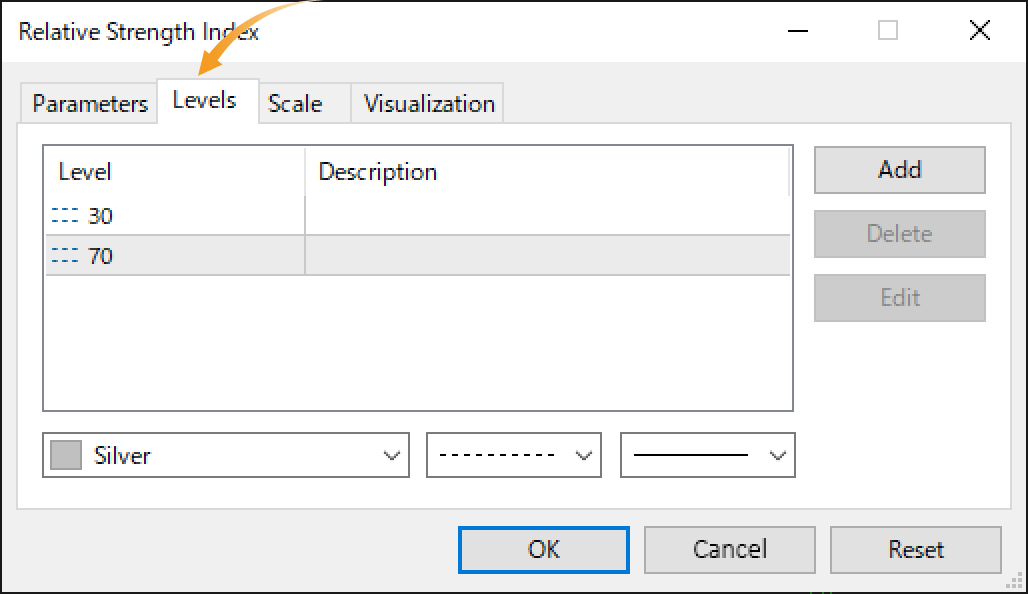
IIn the RSI sub-window, you can display horizontal lines at given levels. They are set to 30% and 70% by default. If you wish to change them, double-click the numbers and enter the number of your choice. If you want to add another horizontal line, click "Add" and enter the number. RSI fluctuates from 0~100% so pick a number from 0~100.
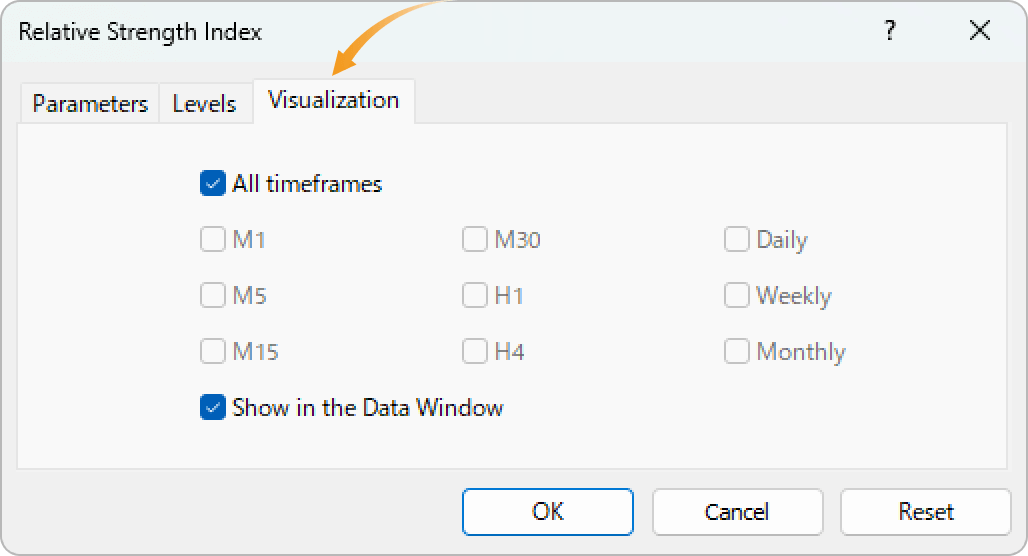
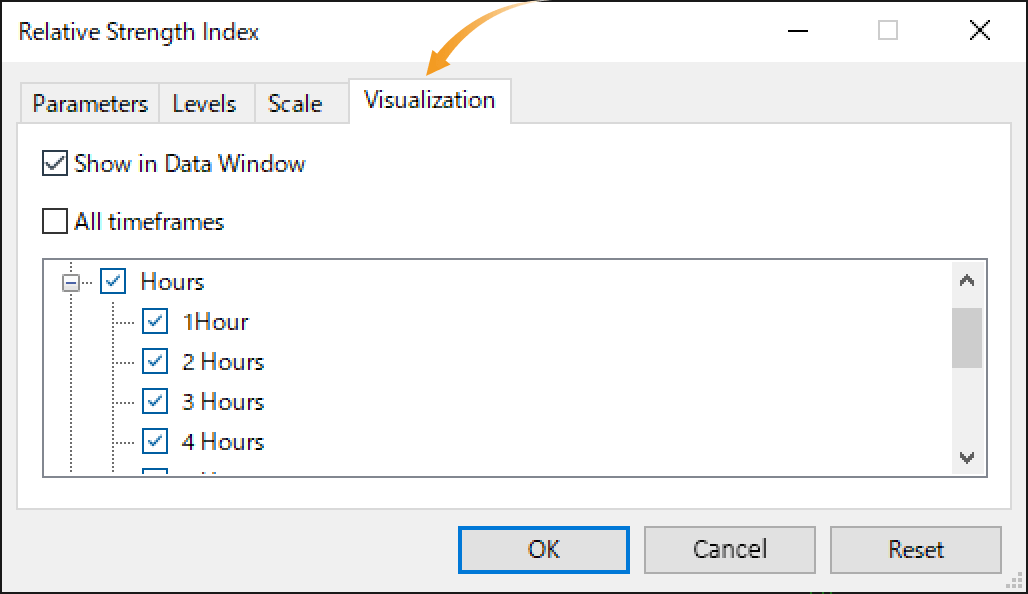
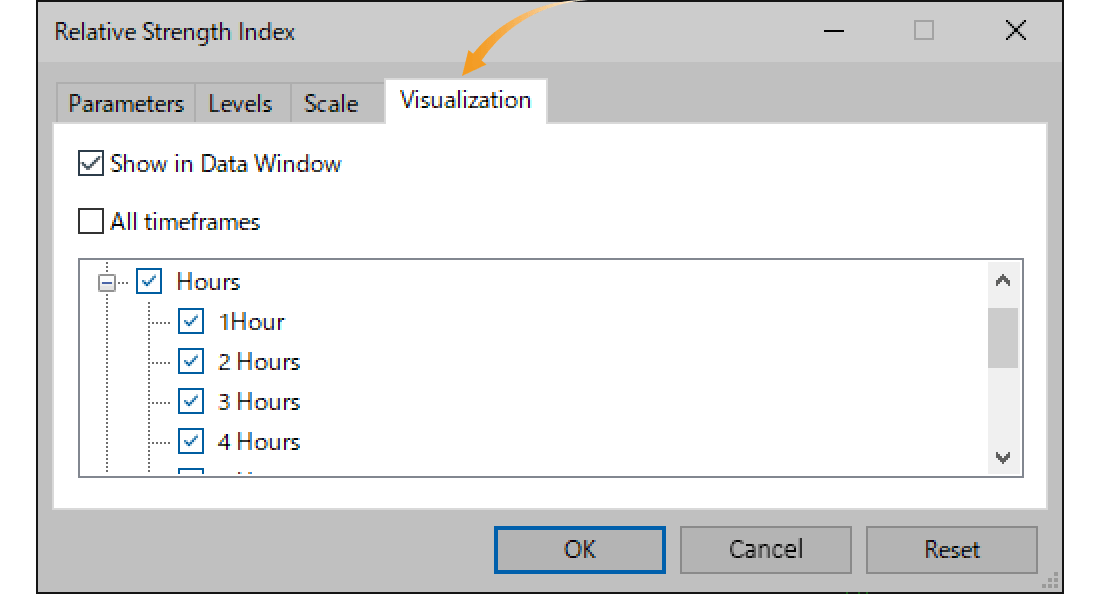
In the "Visualization" tab, you can set the timeframes to display RSI. As RSI can only be displayed in the sub-window, it will be displayed in the sub-window even if "Show in the Data Window" is unchecked.
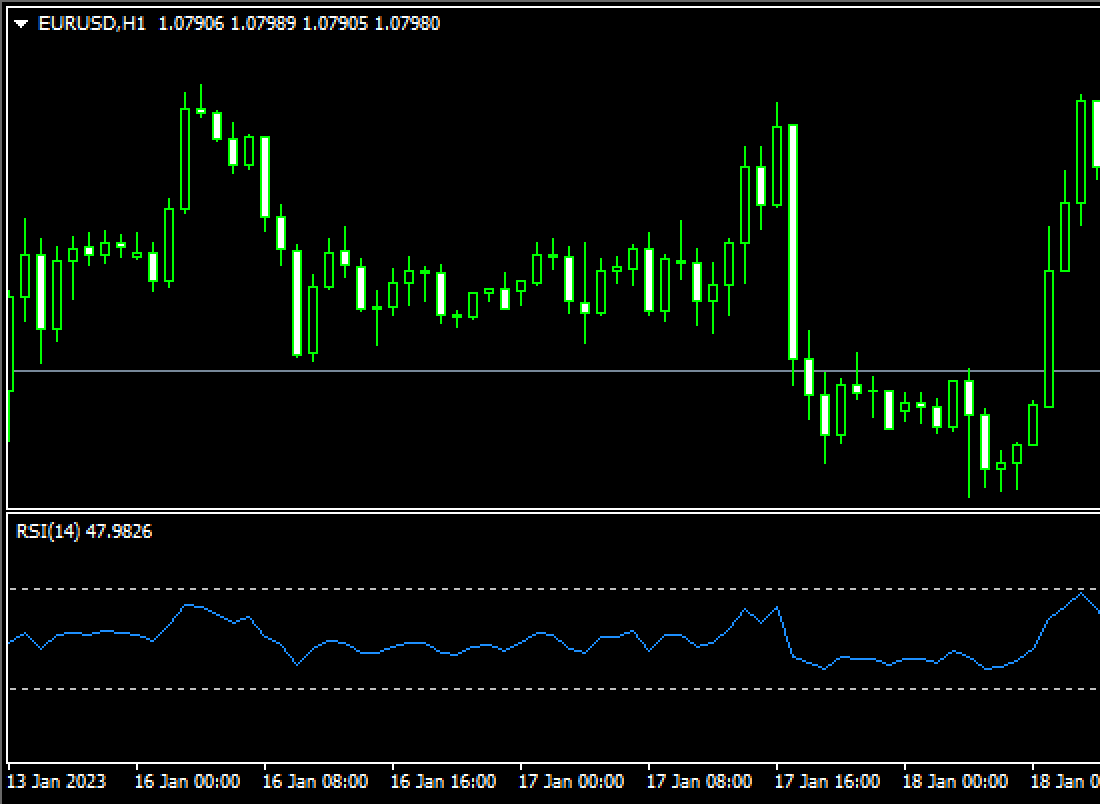
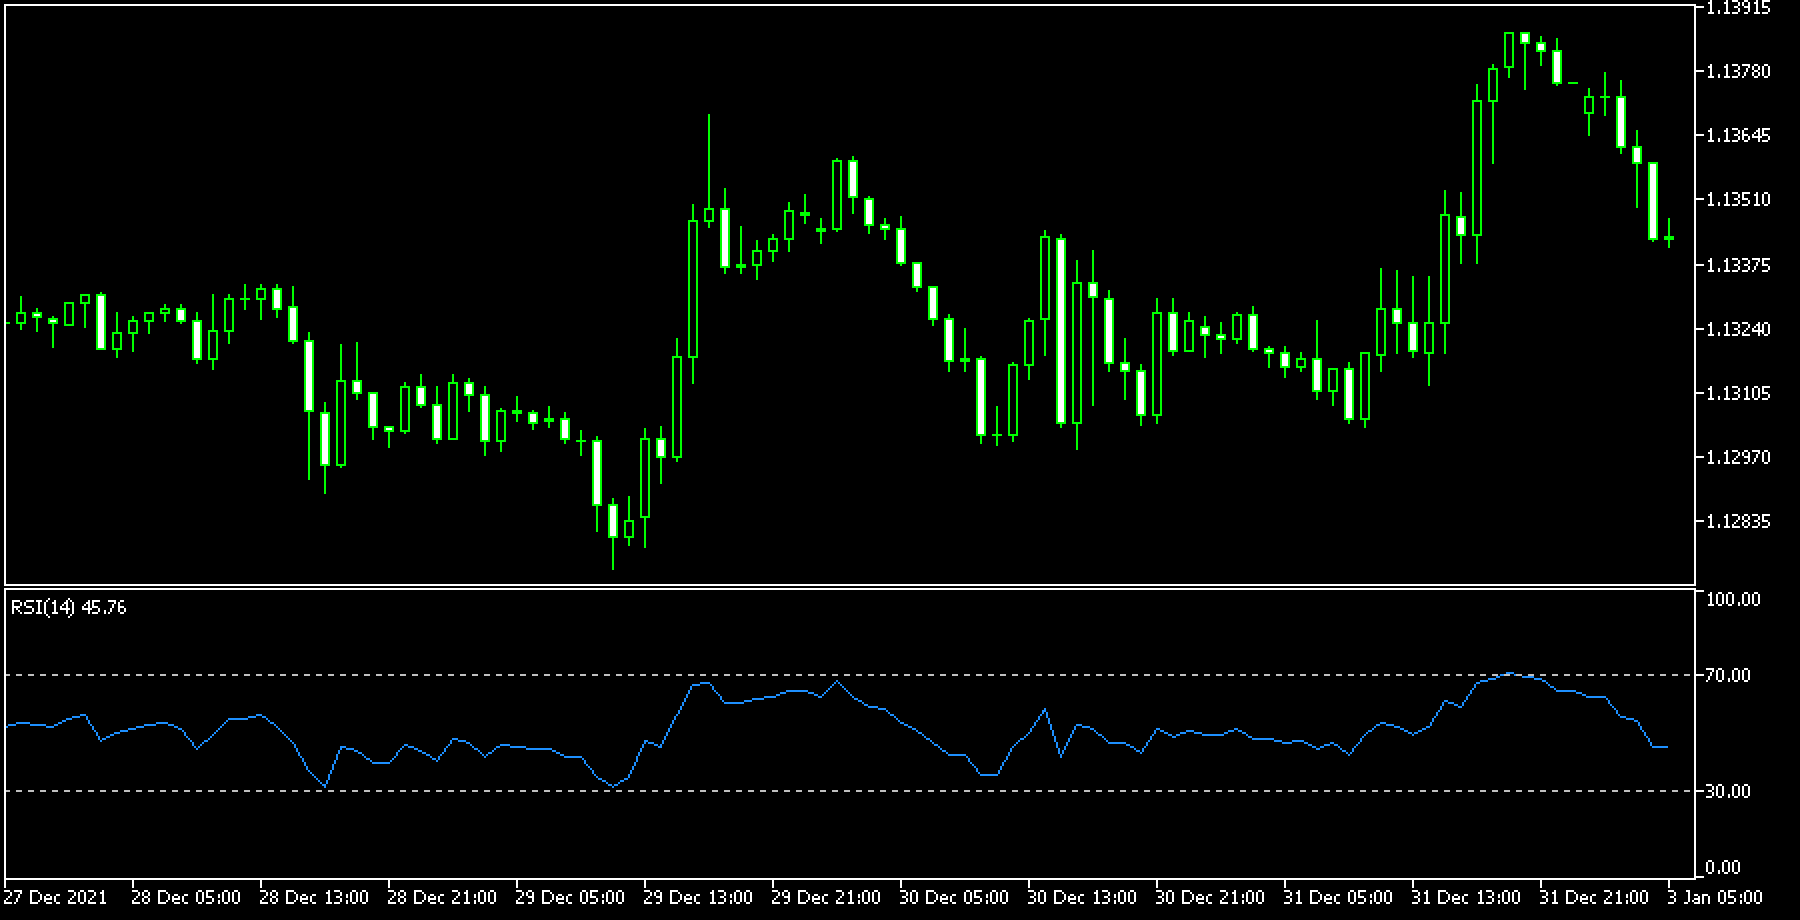
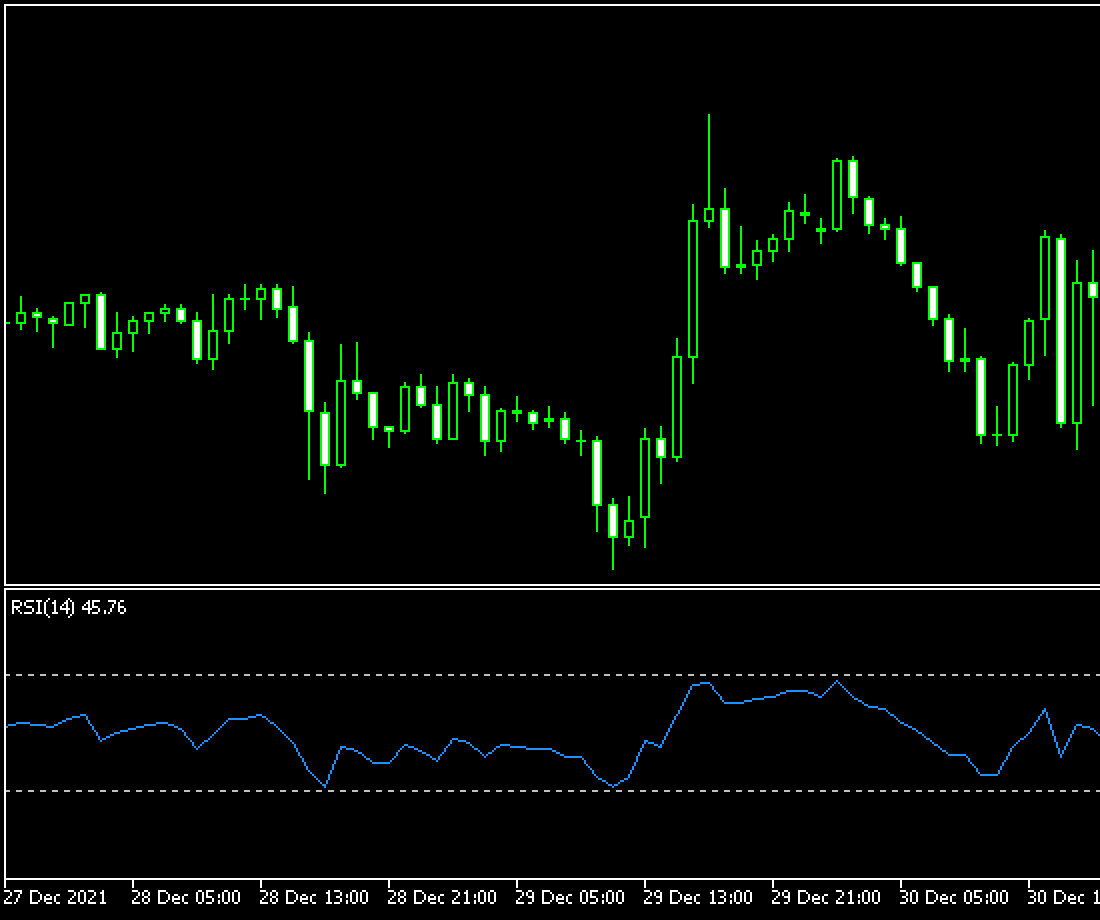
RSI will be displayed on the sub-window of the chart.
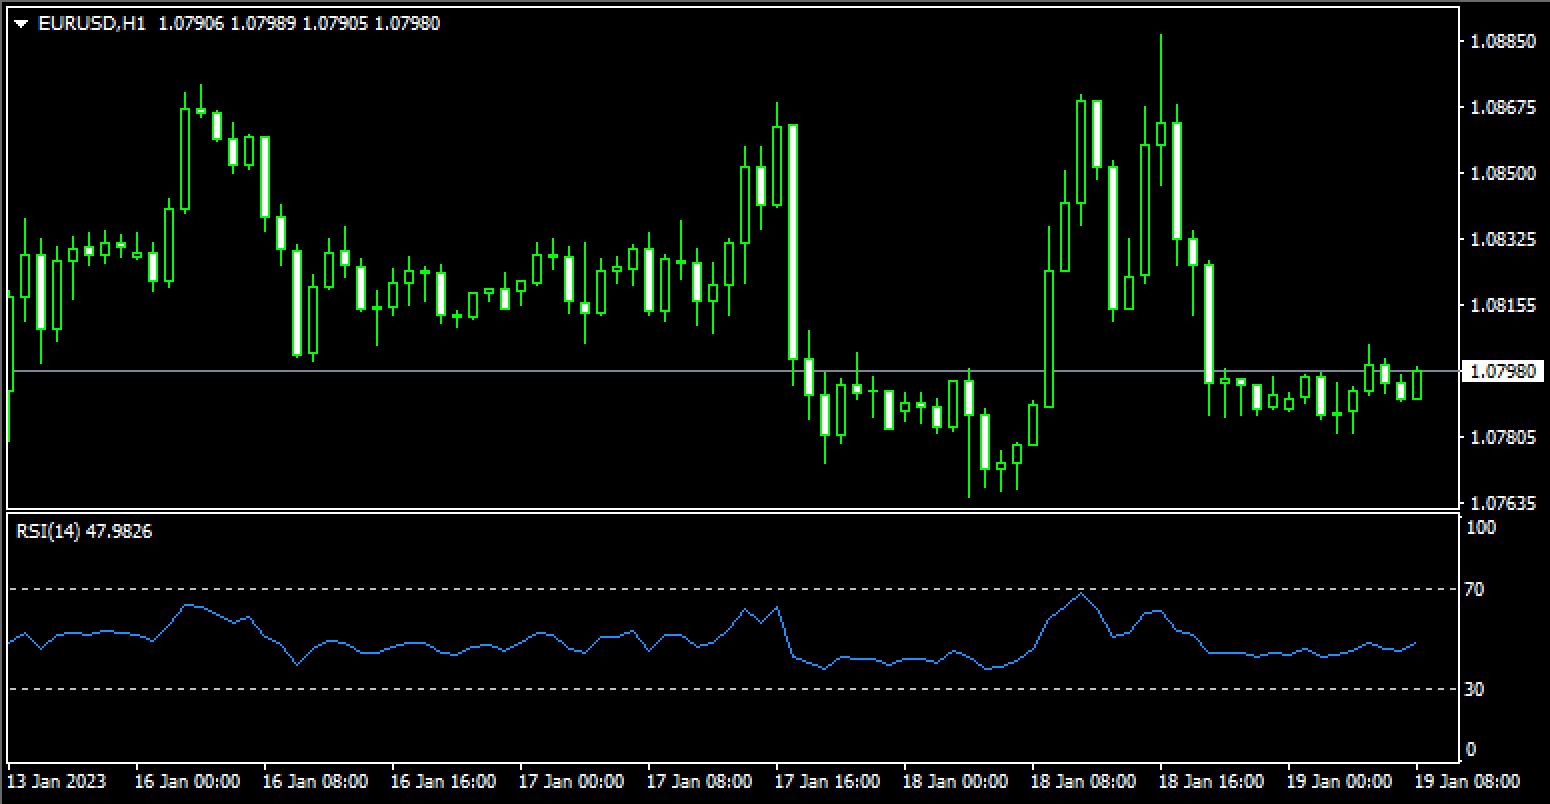
RSI can be set up from the menu or the Navigator.
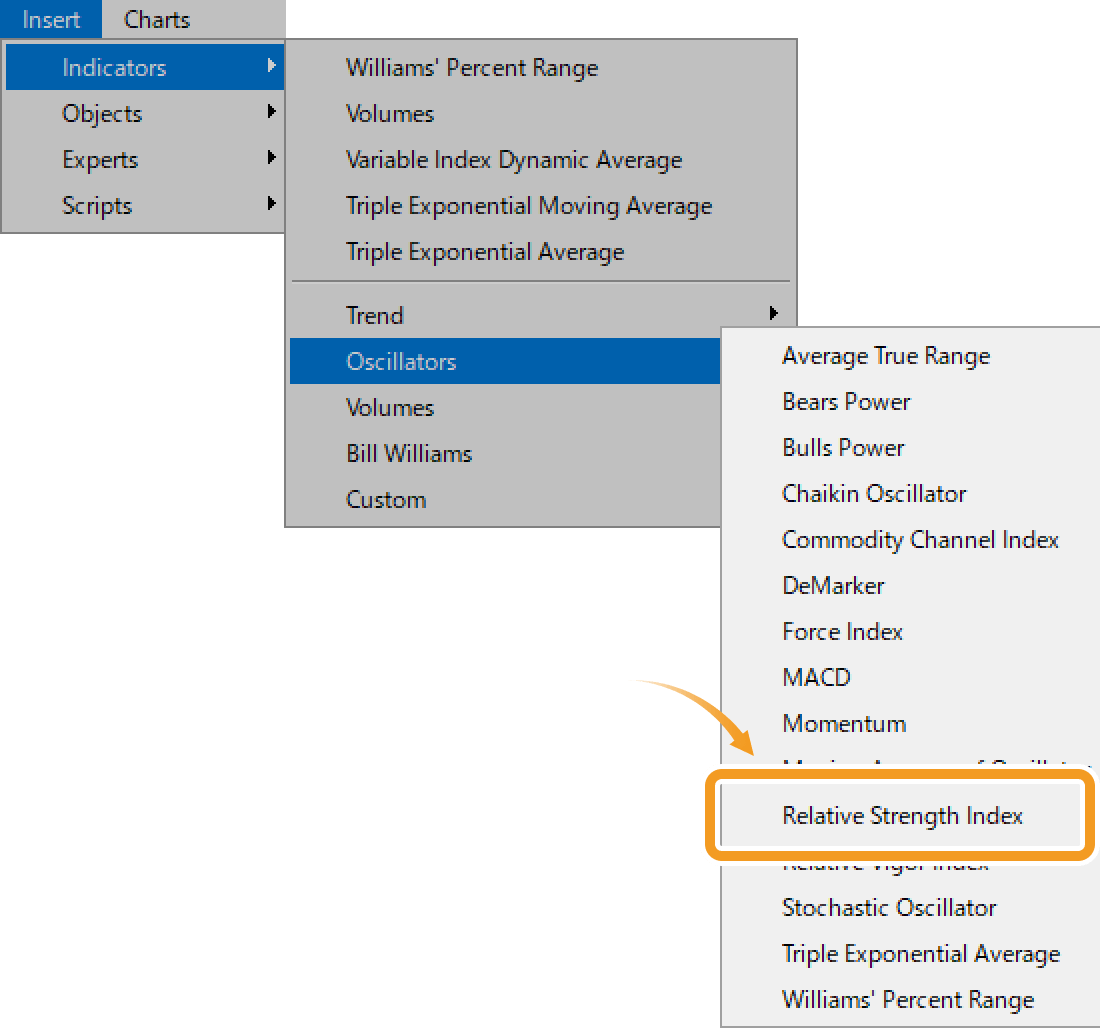
Click "Insert" in the menu. Hover the pointer over "Indicators" > "Oscillators" and select "Relative Strength Index".
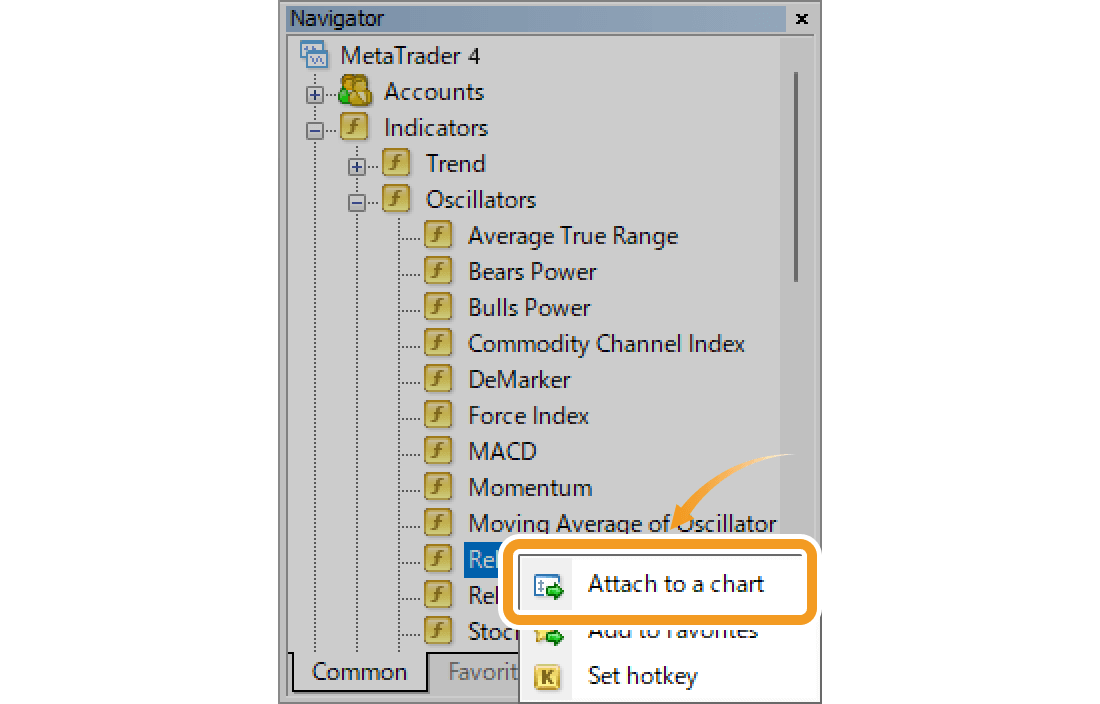
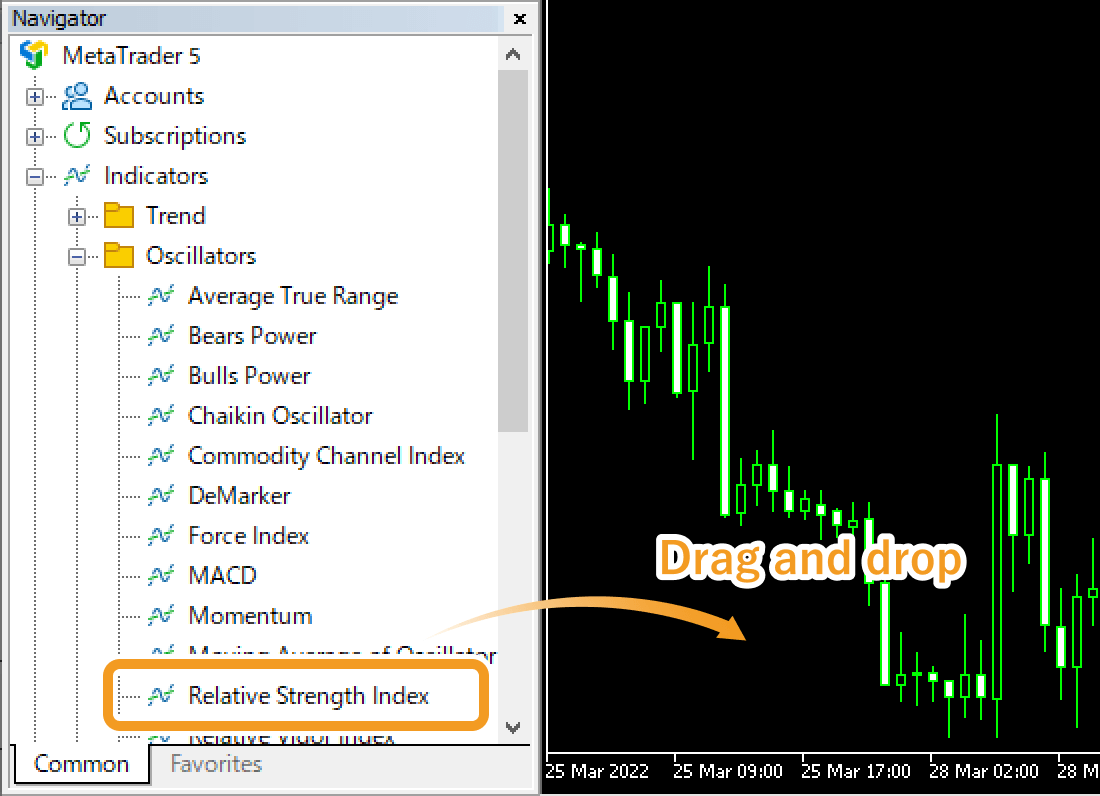
On the Navigator, go to "Indicators" and click on the "+" sign next to "Oscillators". Select "Relative Strength Index" and drag it onto the chart you wish to apply it to.
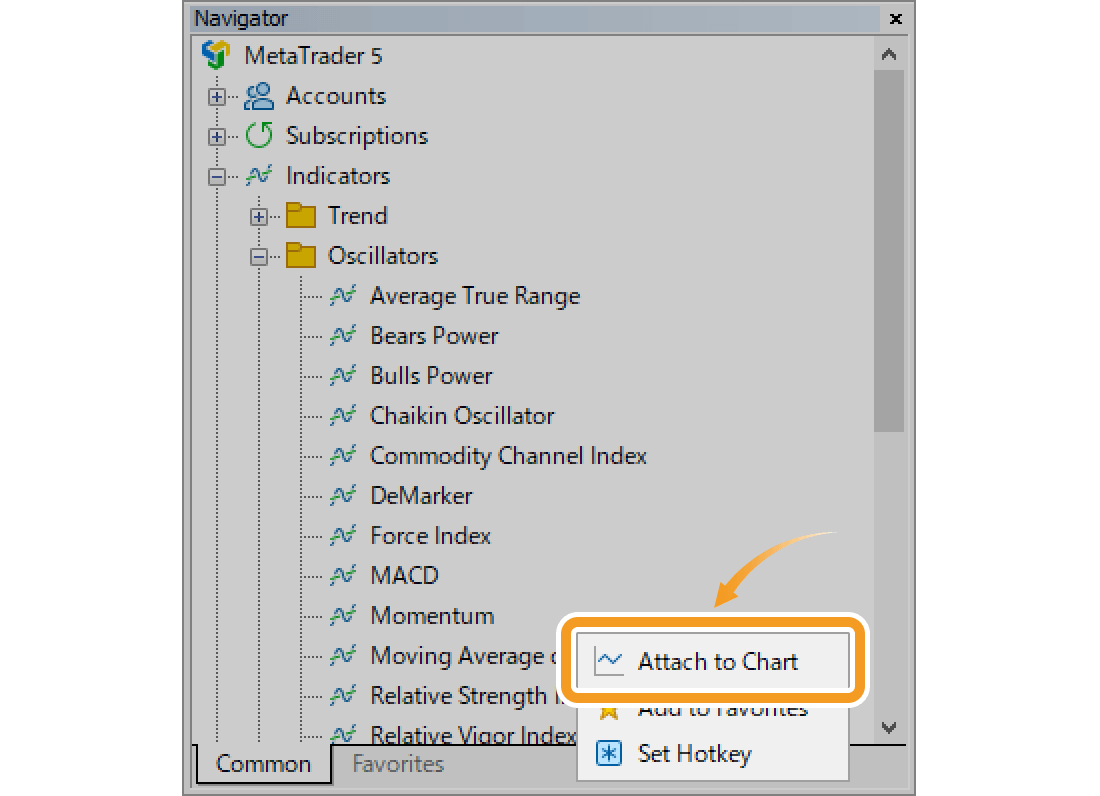
Or, right-click on "Relative Strength Index" and select "Attach to Chart".
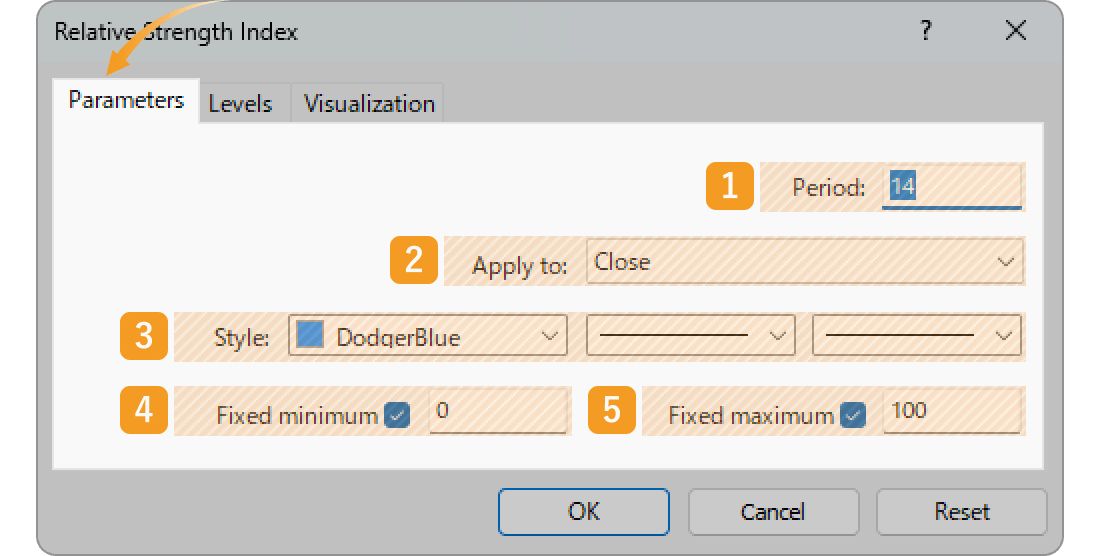
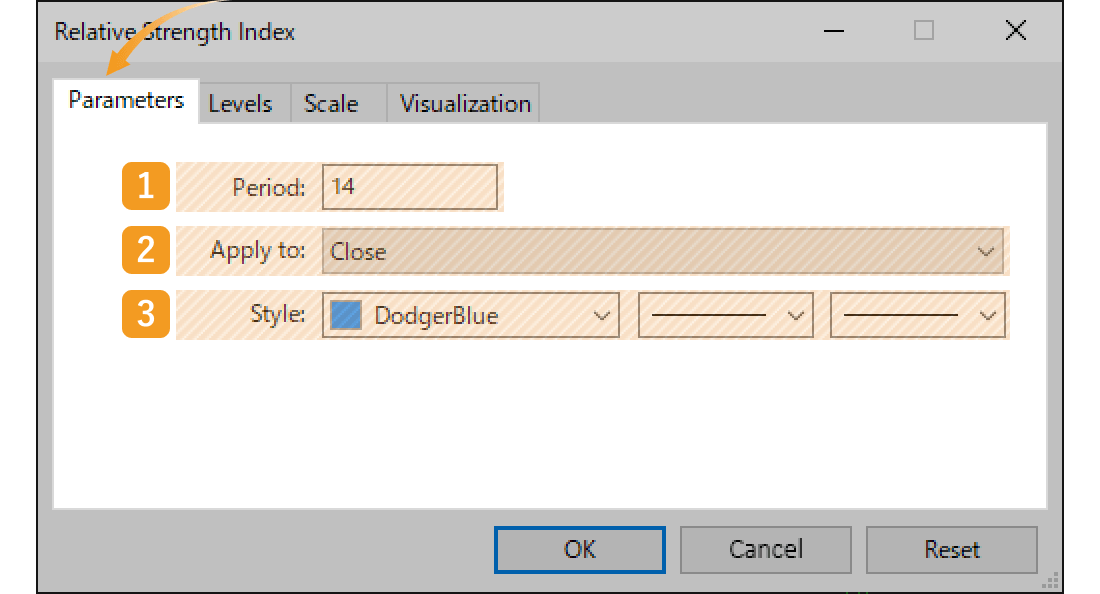
The setting window for RSI will appear. Set the parameters in the "Parameters", "Levels", "Scale", and "Visualization" tab and click "OK".
|
Number |
Item name |
Descriptions |
|---|---|---|
|
1 |
Period |
Set the period for the RSI. The unit here is the number of candlesticks. If you select the daily chart and set it to "14", the RSI for the past 14 days will be generated. |
|
2 |
Apply to |
Price to use for calculating RSI. |
|
3 |
Style |
Set the color, line type, and line thickness for RSI. |
Among the options in the "Apply to" field, "Previous Indicator's Data" and "First Indicator's Data" use the values of an indicator displayed in a sub-window, rather than the price of the chart's symbol.
For example, if volume is shown as the first indicator in a sub-window and you select First Indicator's Data, the RSI will be calculated based on the volume.
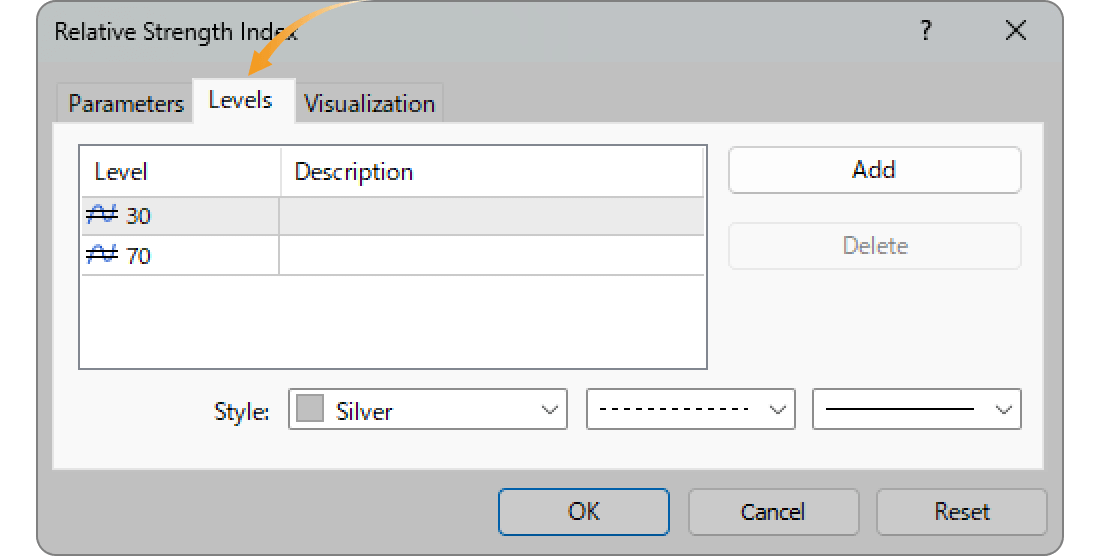
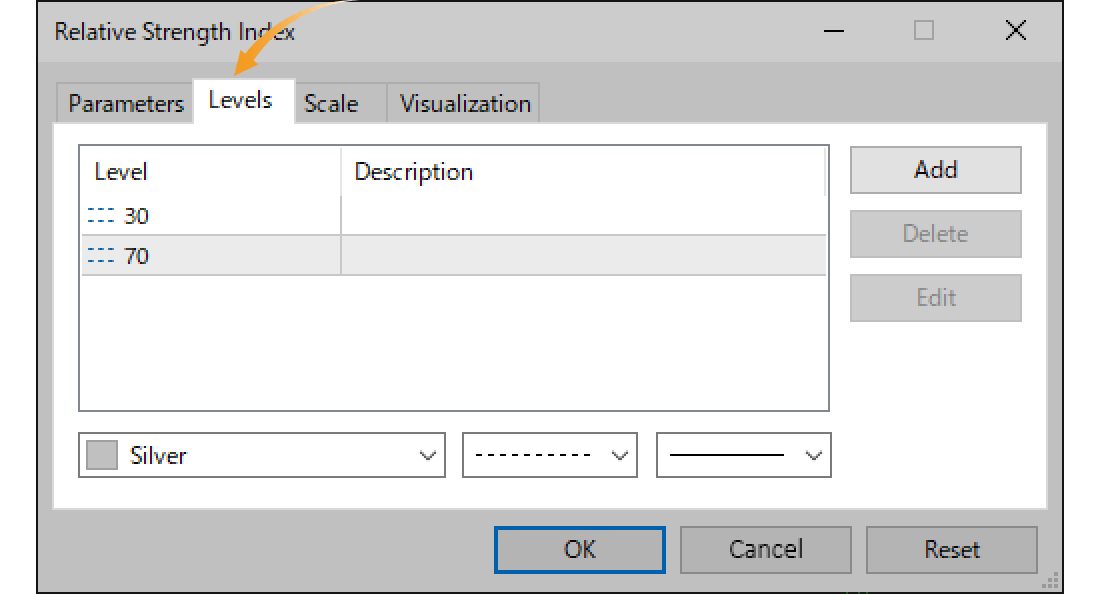
In the RSI sub-window, you can display horizontal lines at given levels. They are set to 30% and 70% by default. If you wish to change them, double-click the numbers and enter the number of your choice.If you want to add another horizontal line, click "Add" and enter the number. RSI fluctuates from 0~100% so pick a number from 0~100.
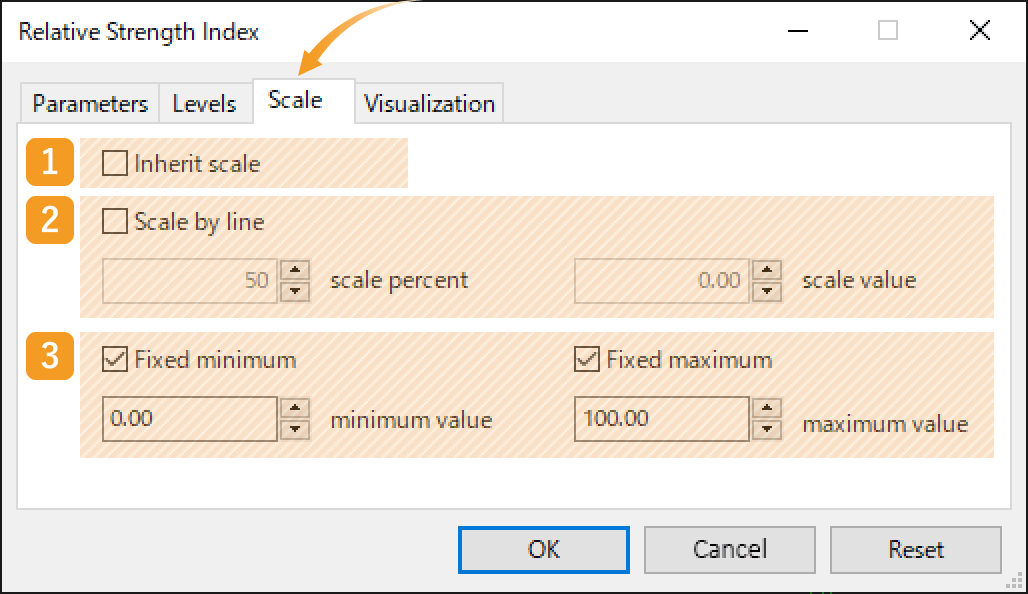
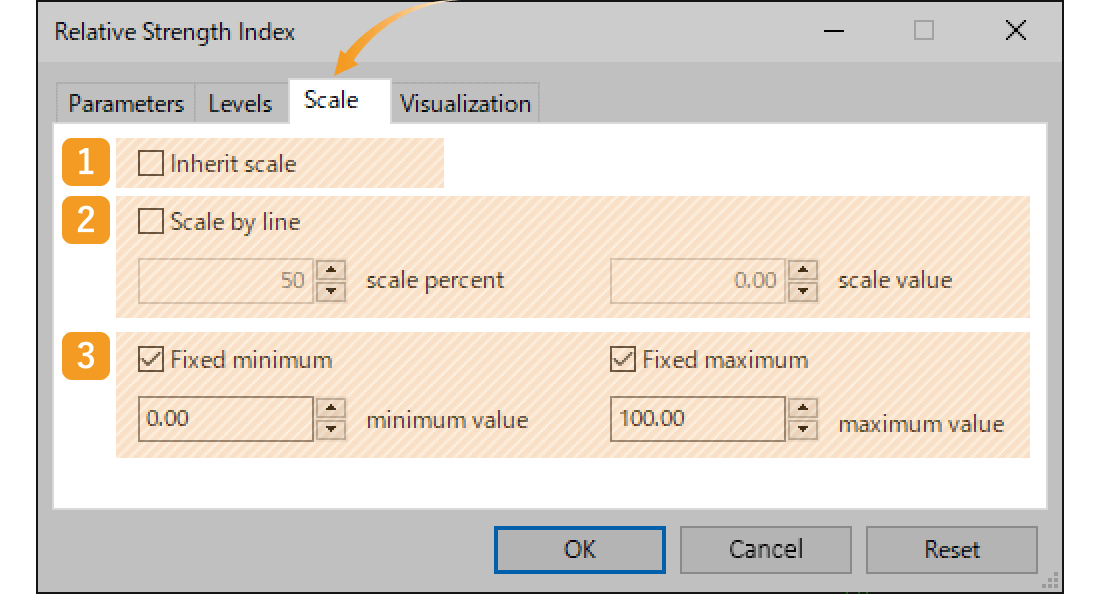
Set the scale of the sub-window for RSI.
|
Number |
Item name |
Descriptions |
|---|---|---|
|
1 |
Inherit scale |
Check this box if you want to inherit the scale of the previous indicator when displaying multiple indicators on the same sub-window. |
|
2 |
Scale by line |
Specify where you want the RSI to show up on the sub-window. If you set the scale percentage to "50" and the scale value to "0", the scale of the vertical axis will be adjusted so that the scale value of "0" will be set at the 50% mark (max value is 100%). |
|
3 |
Fixed minimum/maximum |
Set the min/max value of the RSI in the sub-window. |
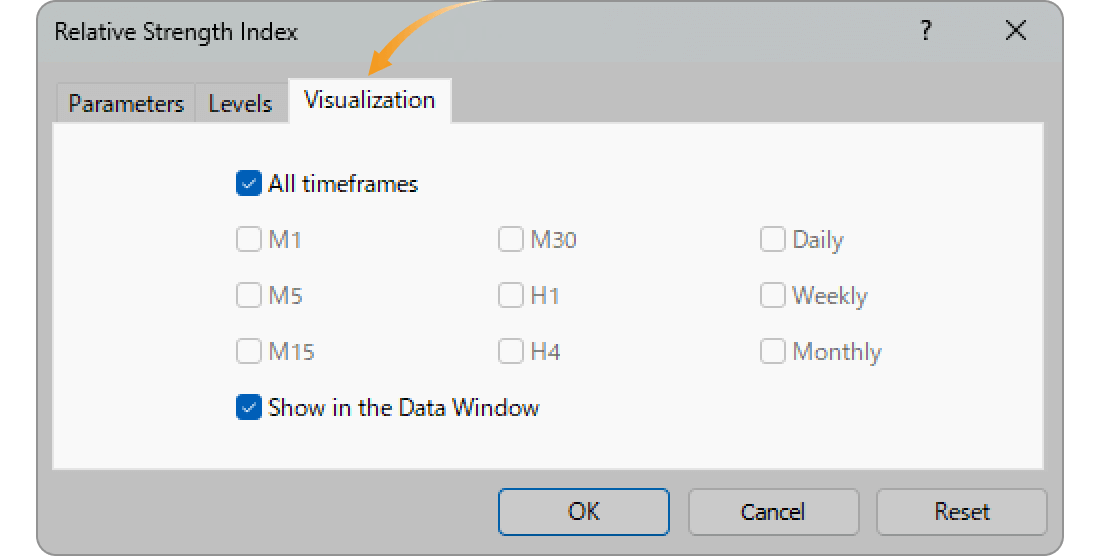
In the "Visualization" tab, you can set the timeframes to display RSI. As RSI can only be displayed in the sub-window, it will be displayed in sub-window even if "Show in Data Window" is unchecked.
RSI will be displayed on the sub-window of the chart.
Was this article helpful?
0 out of 0 people found this article helpful.
Thank you for your feedback.