


MT4/MT5: Manage columns in Market Watch
Windows (PC)
Windows (PC)

This article was :
published
updated
On MetaTrader4 (MT4) / MetaTrader5 (MT5), you can get additional information such as spread, low and high prices, and more in the "Symbols" tab of the Market Watch. While MT4 has only 3 types of information, MT5 allows you to choose from 46 types. Items not provided by the forex broker will not be displayed.
Here we'll take a look at how to change the items displayed on the Market Watch in MT4/MT5.
Switch between MT4/MT5 tabs to check the steps for each.
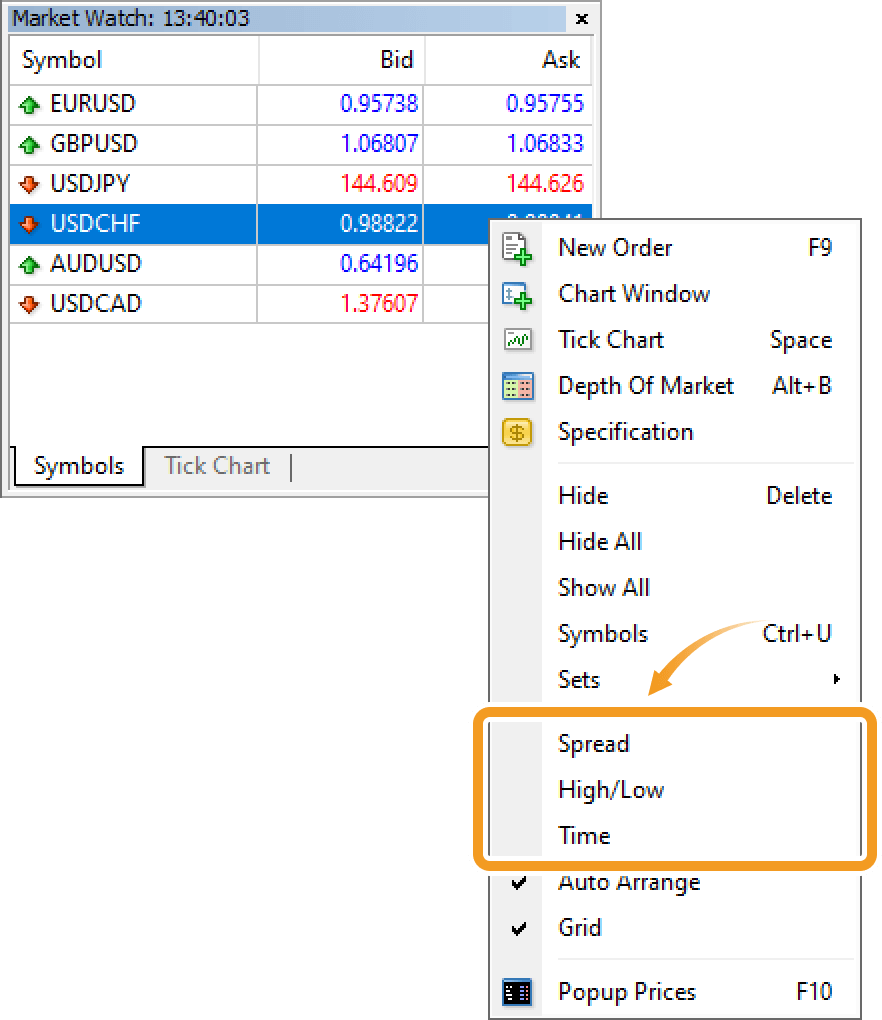
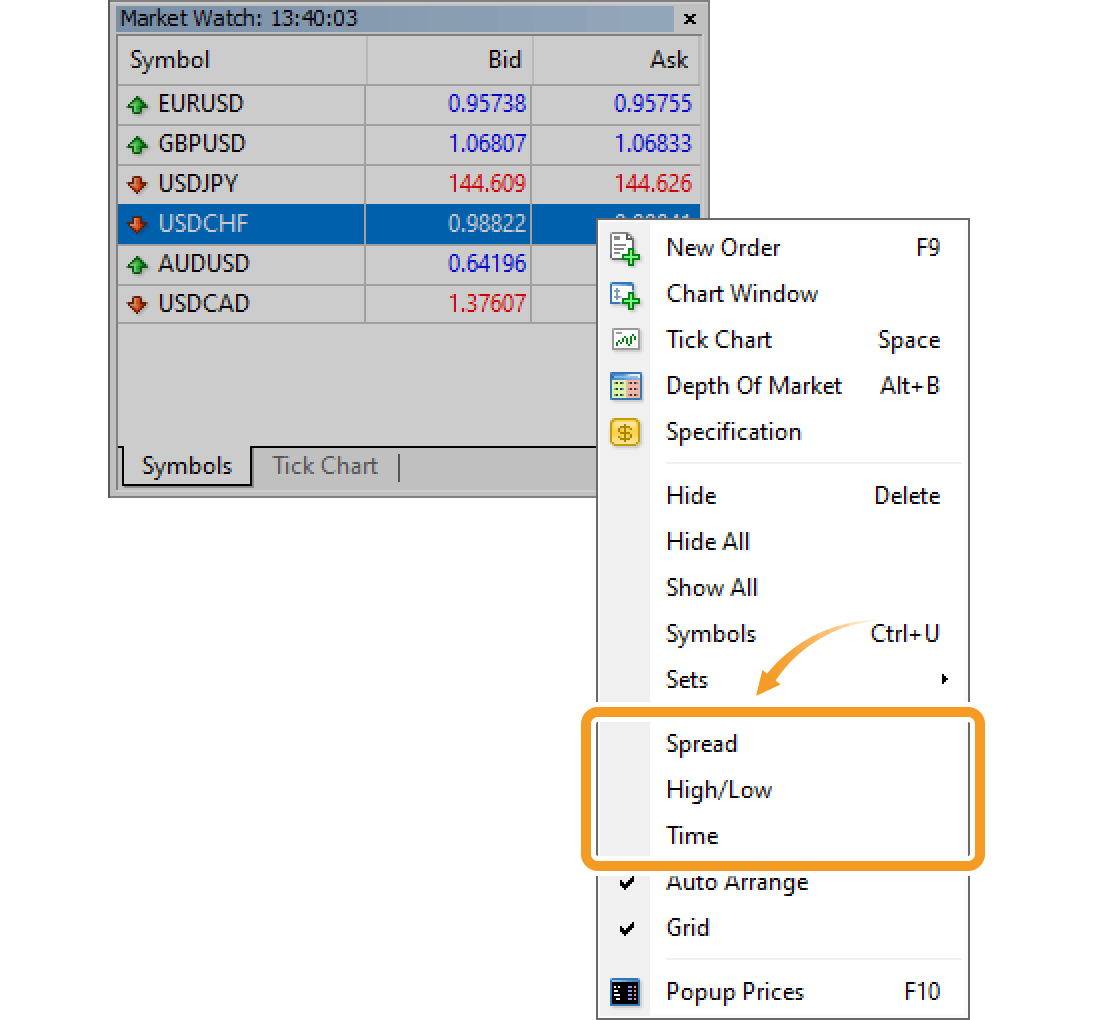
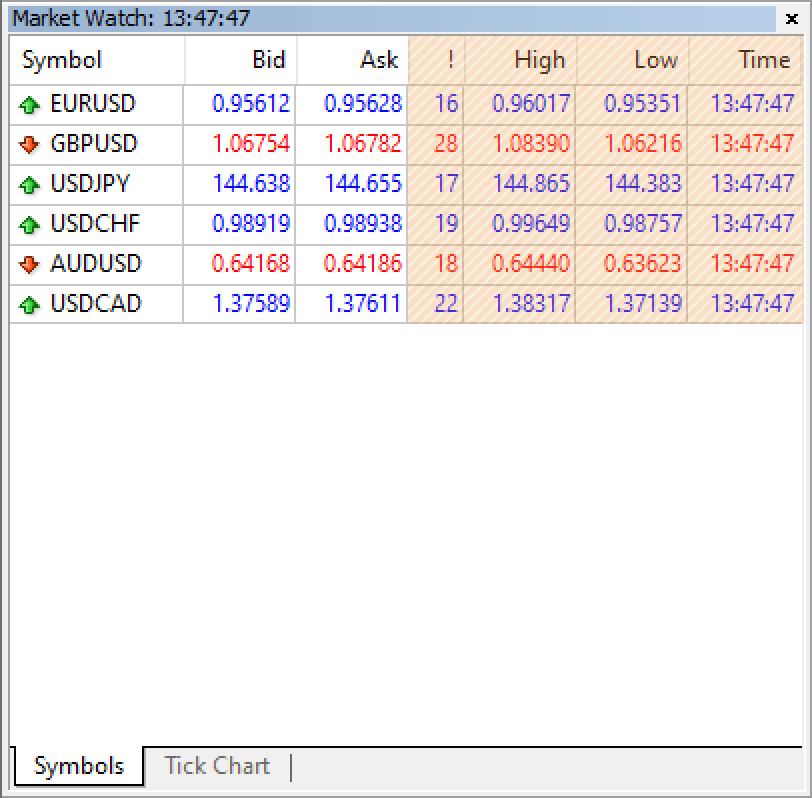
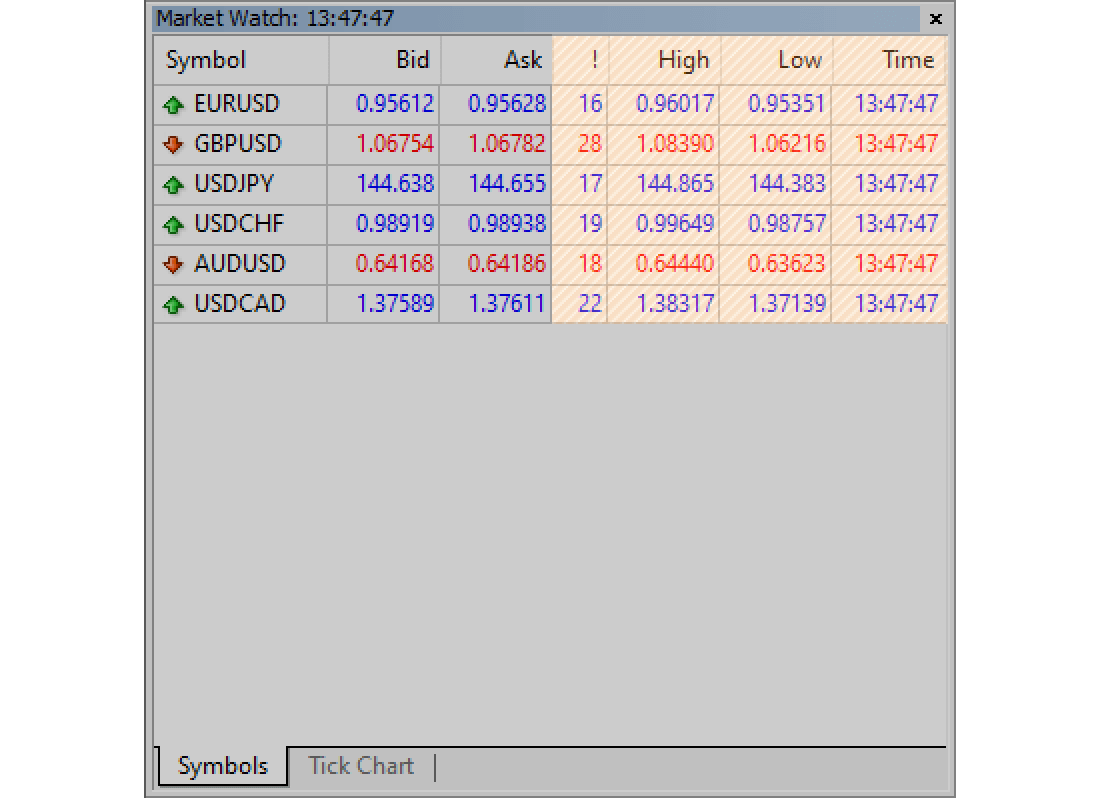
Right-click in the "Symbols" tab of the Market Watch and three options will be shown: "Spread", "High/Low", and "Time". Items with "✓" are already in the Market Watch. If you click an item without "✓", it will appear in the Market Watch. If you click an item with "✓", it will be removed from the Market Watch.
| Item name | Description |
|---|---|
| Spread | The gap between the current ask and bid prices in points. |
| High/Low | The high and low bid prices for the current day. |
| Time | The time when the price was last updated. |
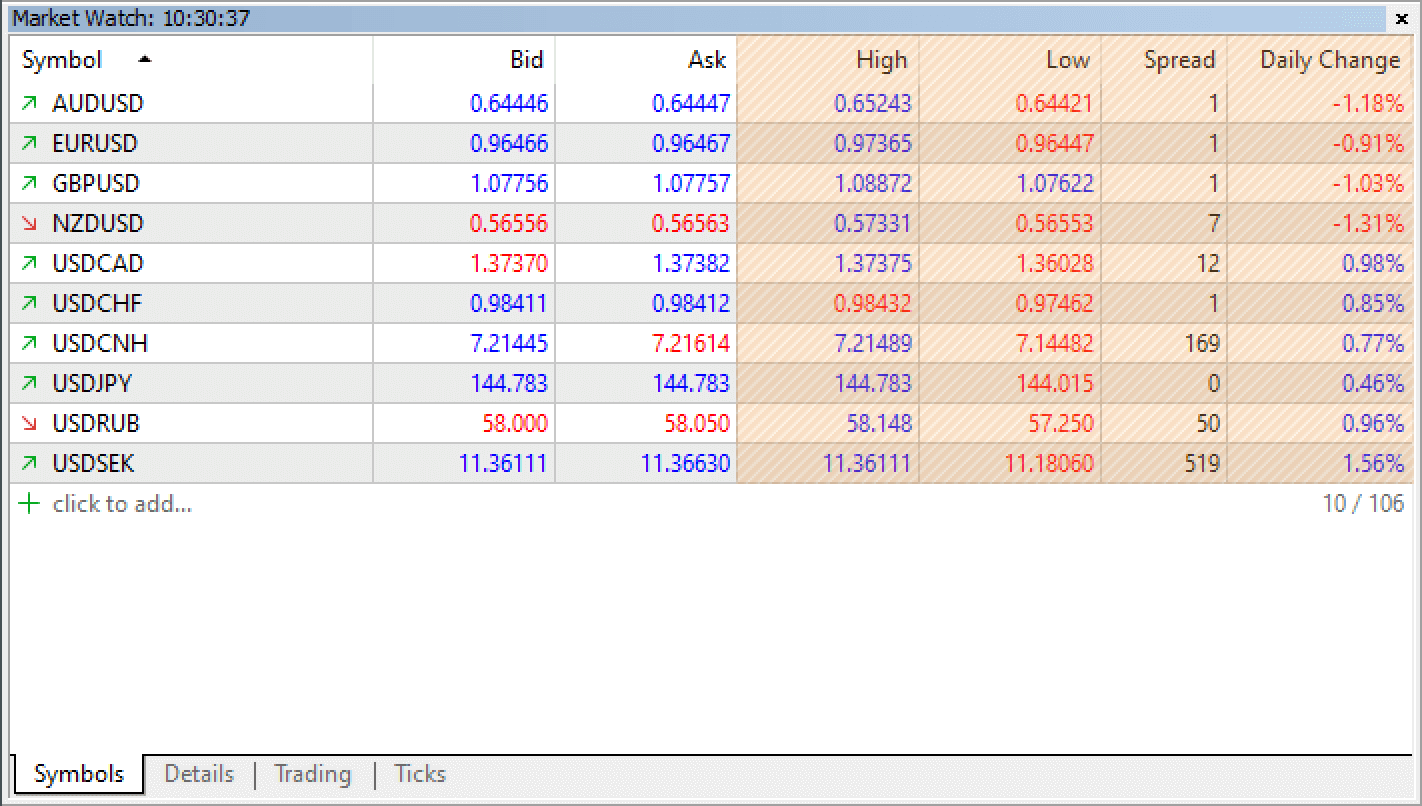
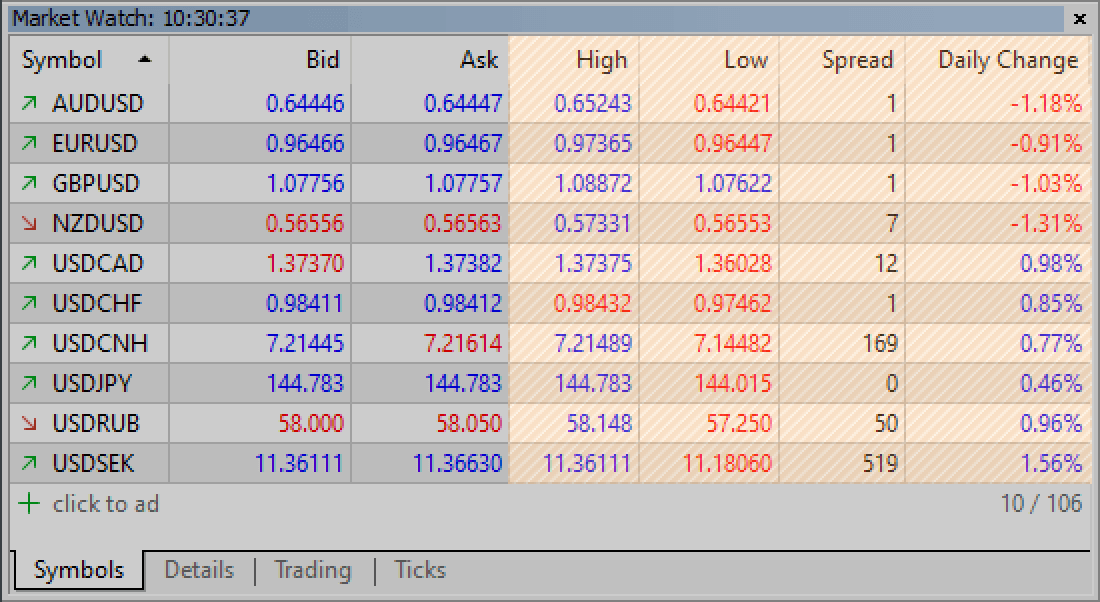
On MT5, you can choose from 46 items such as "Initial margin", "Maintenance margin", "Turnover", "Volatility", etc., besides "Spread", "High/Low". and "Time".
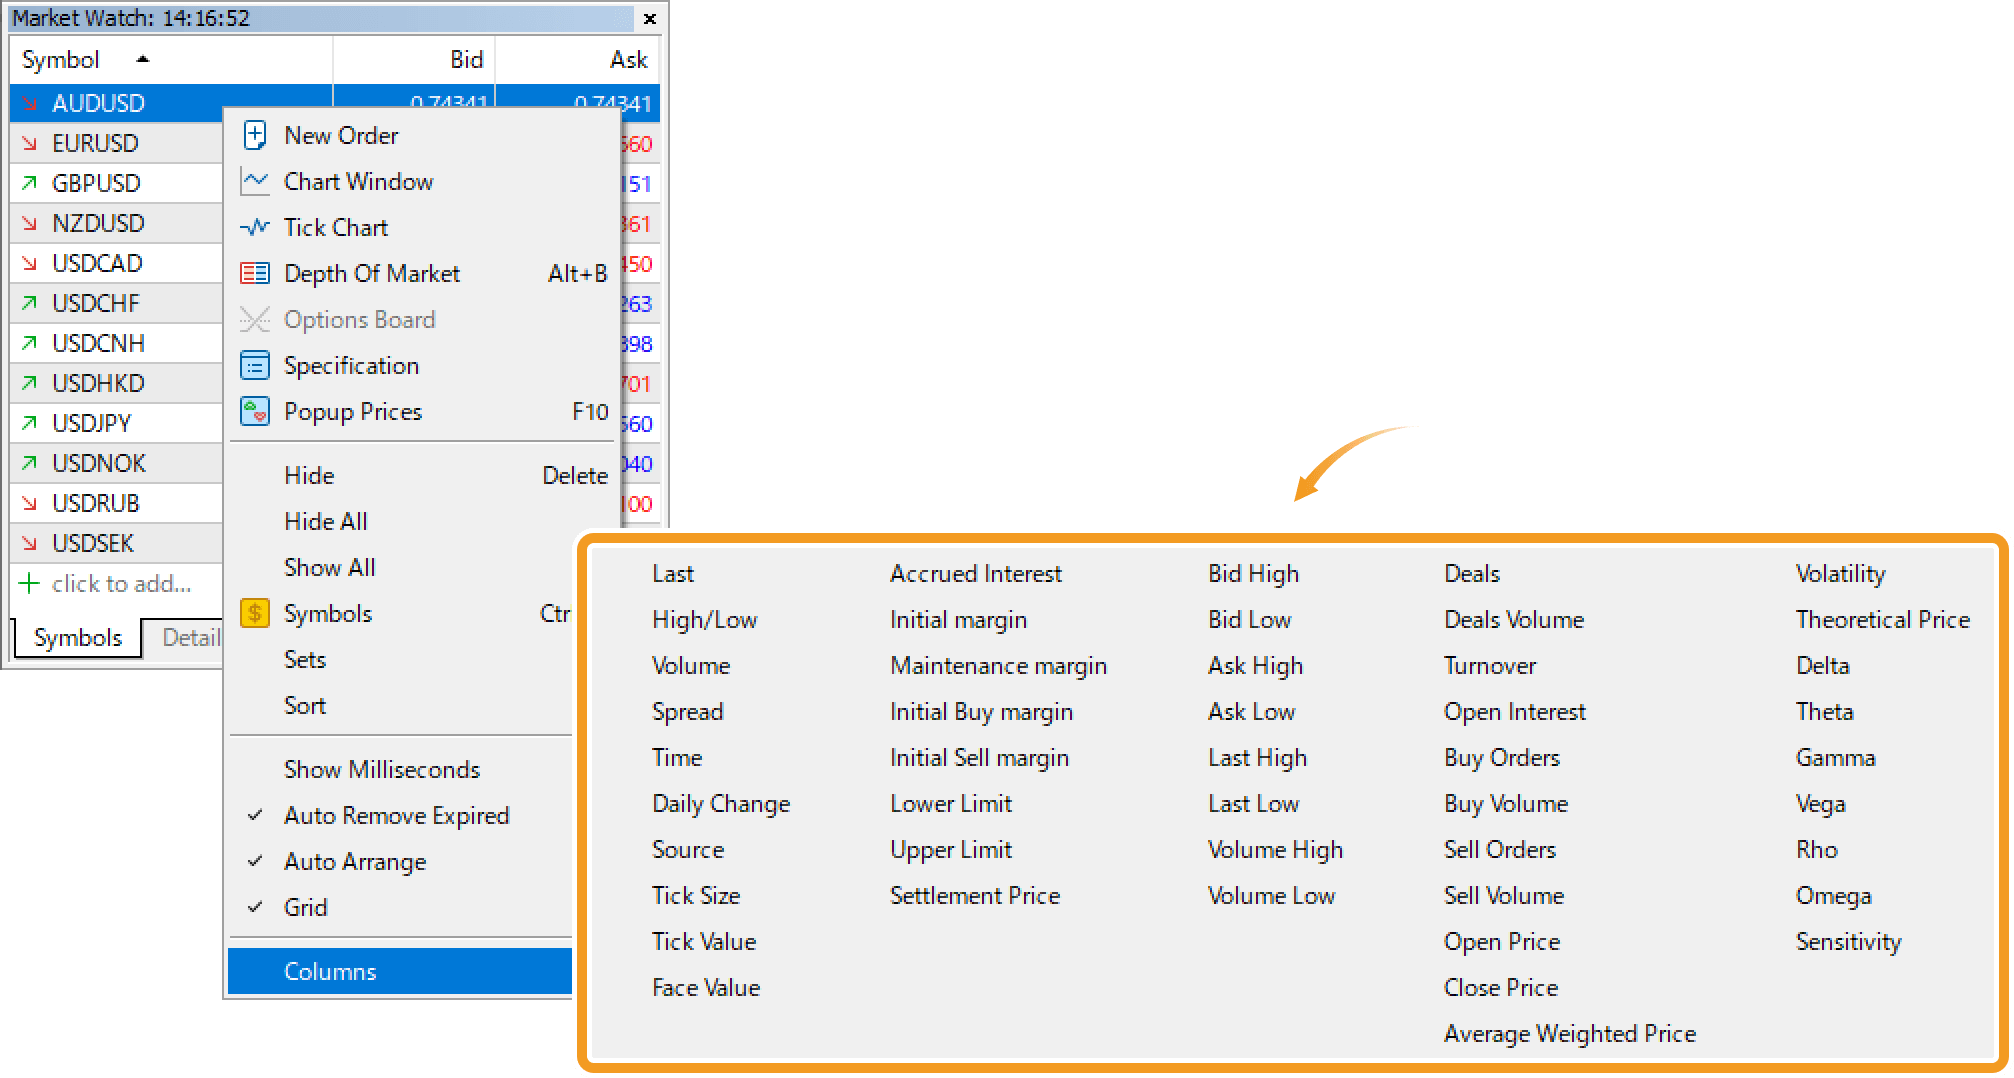
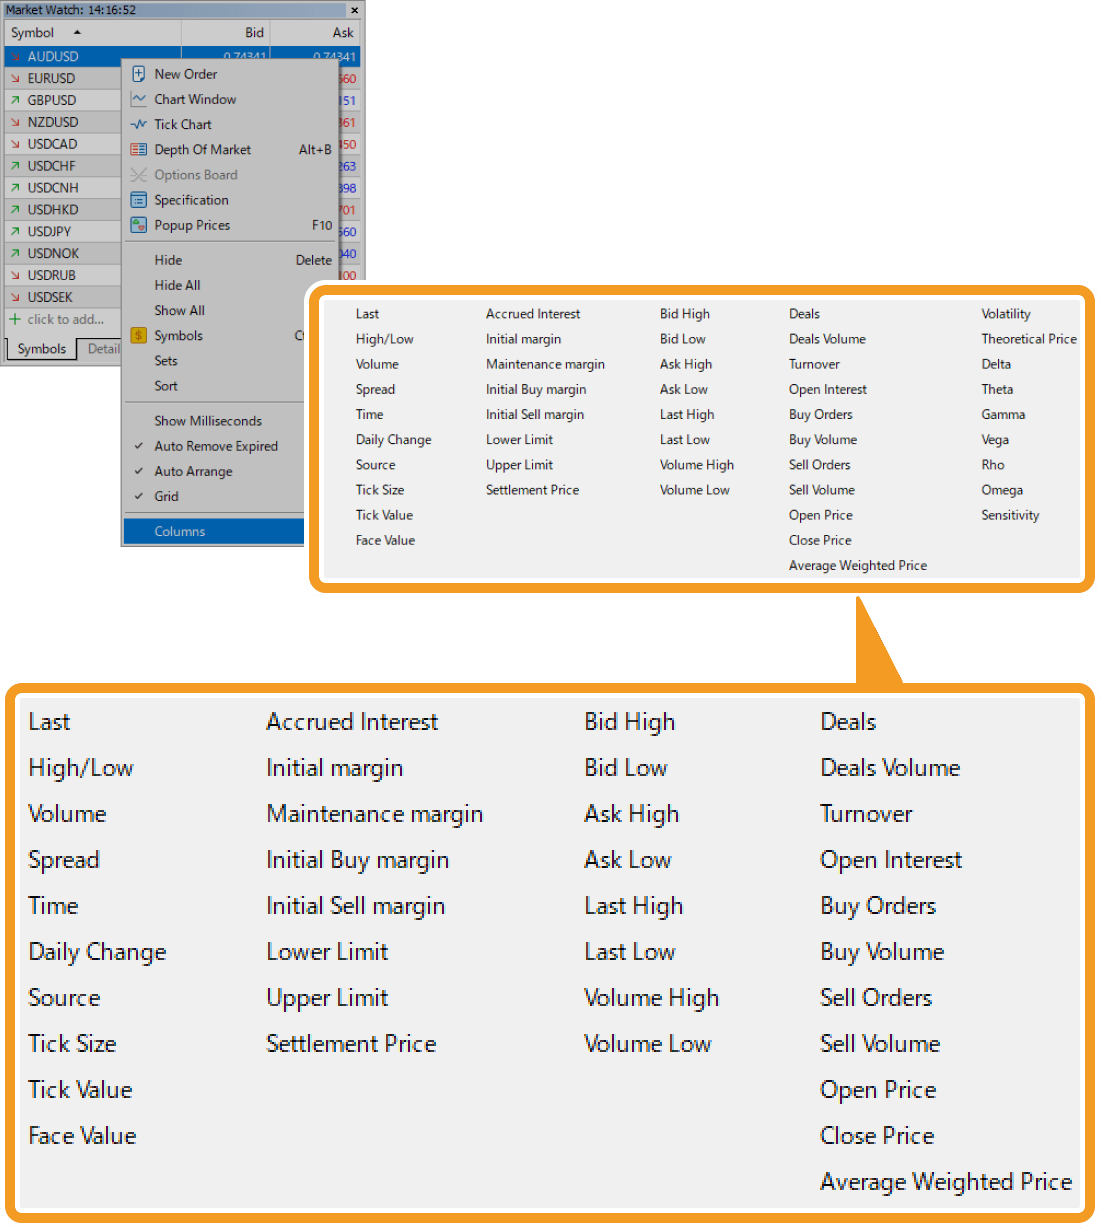
Items with "✓" will appear in the Market Watch.
Right-click in the "Symbols" tab of the Market Watch and select "Columns".
| Item name | Description |
|---|---|
| Last | The last price at which the last trade occurred. |
| High/Low | The high and low bid prices for the current day. |
| Volume | The volume of the last trade. |
| Spread | The gap between the current ask and bid prices in points. |
| Time | The time when the price was last updated. |
| Daily Change | Change from the previous day's close price. |
| Source | Liquidity provider. |
| Tick Size | The smallest size for the price movement. |
| Tick Value | The currency amount of the smallest size for the price movement. |
| Face Value | Minimum trade amount of the bond. |
| Accrued Interest | The interest on the coupon calculated from the number of days since the issue date or since the previous coupon payment. |
| Initial margin | The margin required to hold a position. |
| Maintenance margin | The margin required to maintain a position aside from the initial margin. |
| Initial Buy margin | The margin required to hold a long position. |
| Initial Sell margin | The margin required to hold a short position. |
| Lower Limit | The lowest price for futures. |
| Upper Limit | The highest price for futures. |
| Settlement Price | The clearing price used to calculate margins and profit/loss in futures/options trading. |
| Bid High | The highest bid price for the current day. |
| Bid Low | The lowest bid price for the current day. |
| Ask High | The highest ask price for the current day. |
| Ask Low | The lowest ask price for the current day. |
| Last High | The highest traded price for the current day. |
| Last Low | The lowest traded price for the current day. |
| Volume High | The highest traded volume for the current day. |
| Volume Low | The lowest traded volume for the current day. |
| Deals | The latest number of trades. |
| Deals Volume | The latest volume of trades. |
| Turnover | The turnover (traded volume). |
| Open Interest | The volume of positions held. |
| Buy Orders | The number of buy orders. |
| Buy Volume | The volume of buy orders. |
| Sell Orders | The number of sell orders. |
| Sell Volume | The volume of sell orders. |
| Open Price | The open price for the current day. |
| Close Price | The close price for the previous day. |
| Average Weighted Price | The weighted average of the price. |
| Volatility | The implied volatility (in percentage), the expected rate of change of the underlying asset price. |
| Theoretical Price | Theoretical price of an option calculated by Black-Scholes model. |
| Delta | Delta, a risk indicator for options, quantifies the change in option's price relative to the change in underlying asset price. |
| Theta | Theta, a risk indicator for options, quantifies the risk that time poses to option buyers. |
| Gamma | Gamma, a risk indicator for options, quantifies the change in Delta value relative to the change in underlying asset price. |
| Vega | Vega, a risk indicator for options, quantifies the change in option's price relative to the change in implied volatility. |
| Rho | Rho, a risk indicator for options, quantifies the change in option's price relative to the change in interest rates. |
| Omega | Omega, a risk indicator for options, quantifies the percentage change in option's price relative to the percent change in underlying asset price. |
| Sensitivity | The change in underlying asset price per one point change in option's price. |
Items with "✓" will appear in the Market Watch.
Was this article helpful?
0 out of 0 people found this article helpful.
Thank you for your feedback.