


MT4/MT5: Change chart colors
Charts (PC)
Charts (PC)

This article was :
published
updated
There are three basic color schemes for MetaTrader4 (MT4) and four for MetaTrader5 (MT5). You can quickly change the chart colors using these schemes, and also customize the colors of each element, such as candlesticks and background.
Here we will look at how to change chart colors in MT4/MT5.
Switch between MT4/MT5 tabs to check the steps for each.
Related article: Change chart colors on mobile
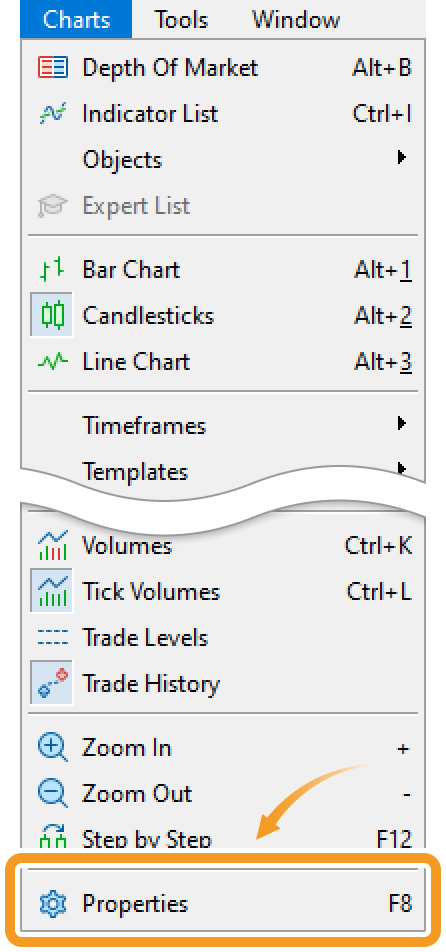
You can change chart colors from the menu or chart.
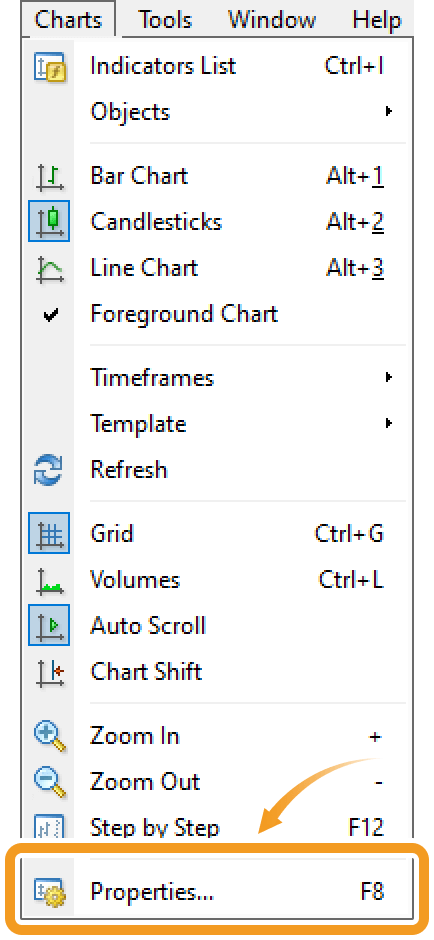
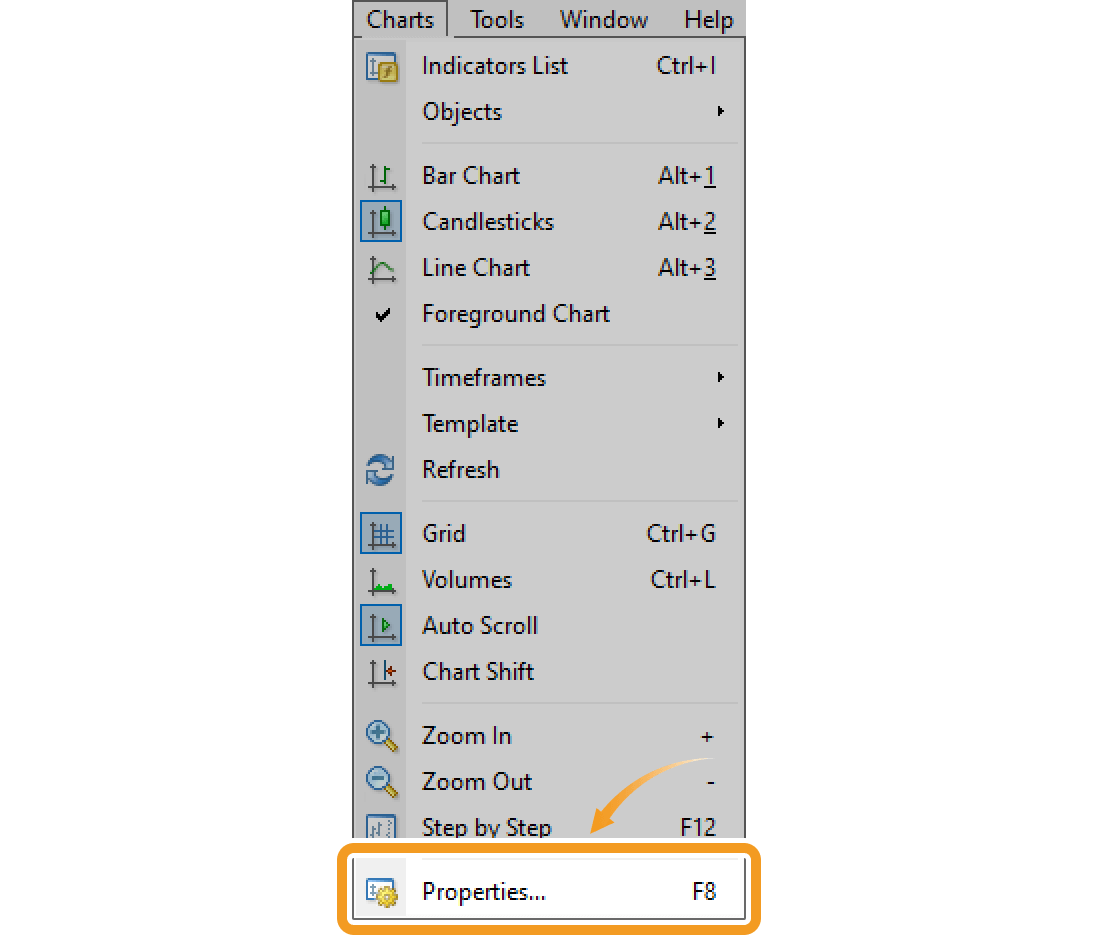
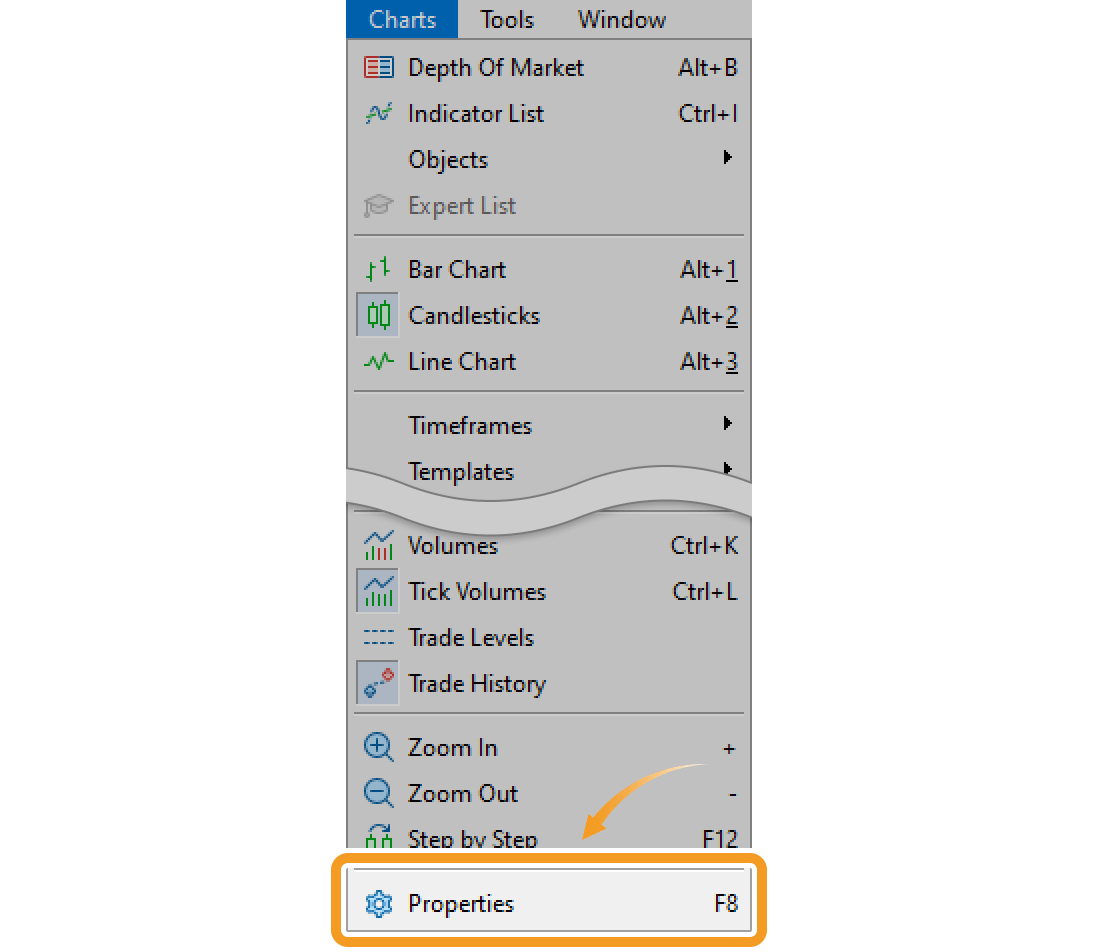
Click "Charts" in the menu and select "Properties".
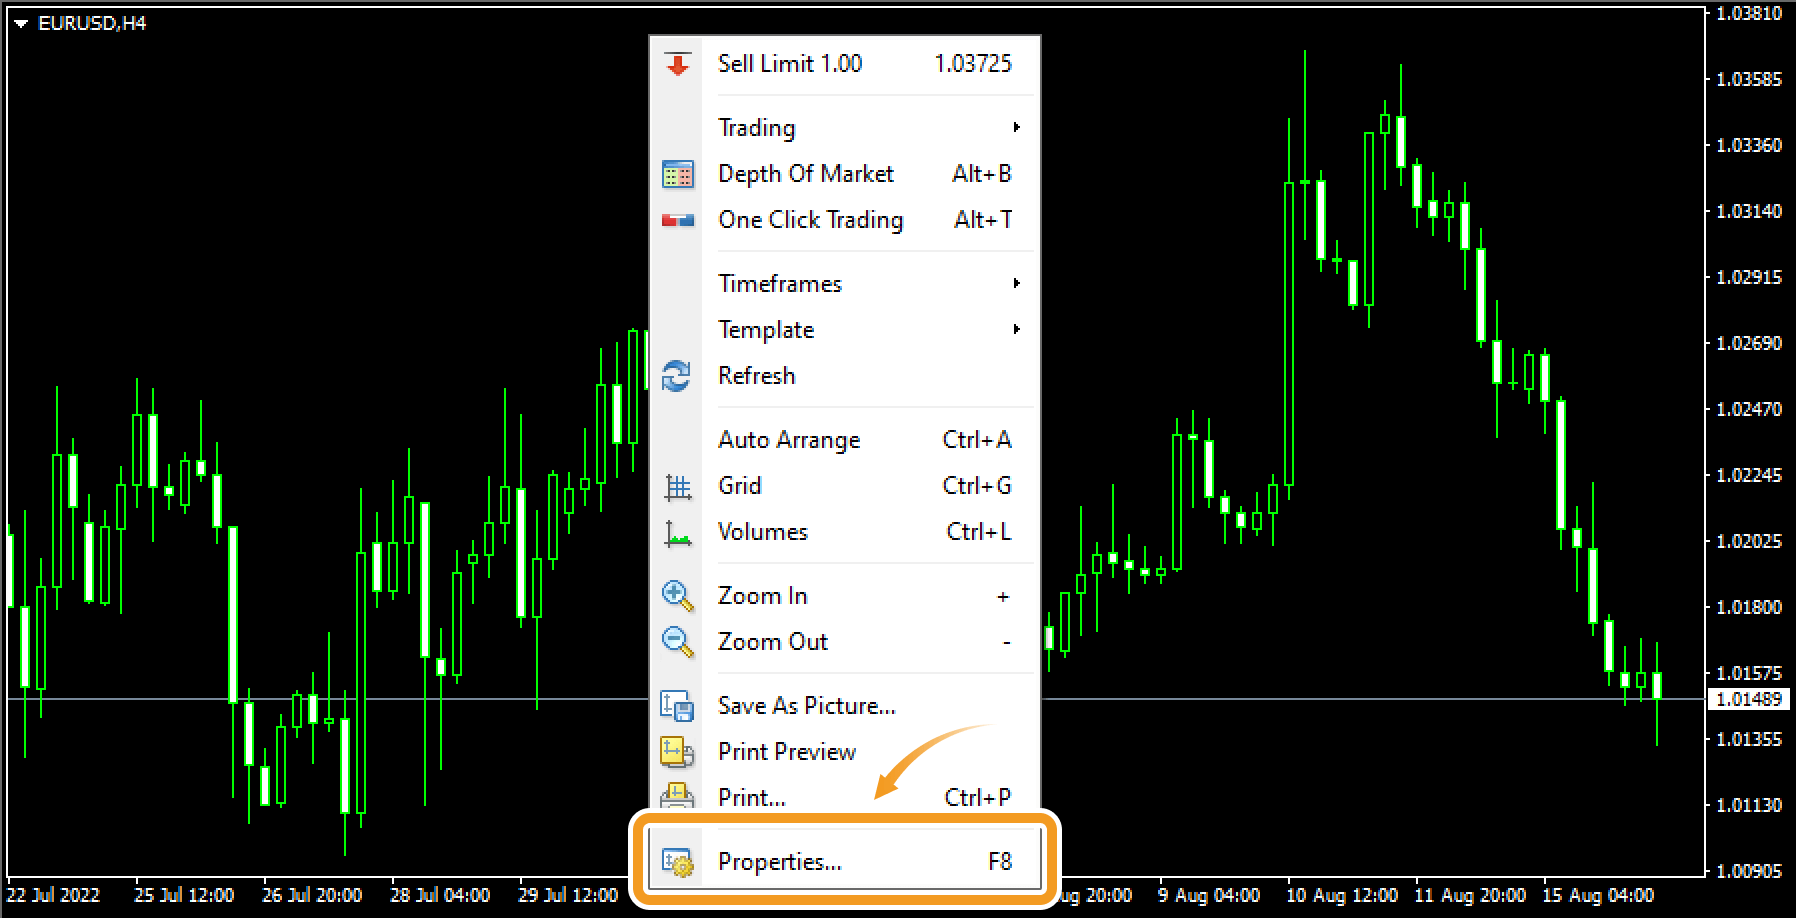
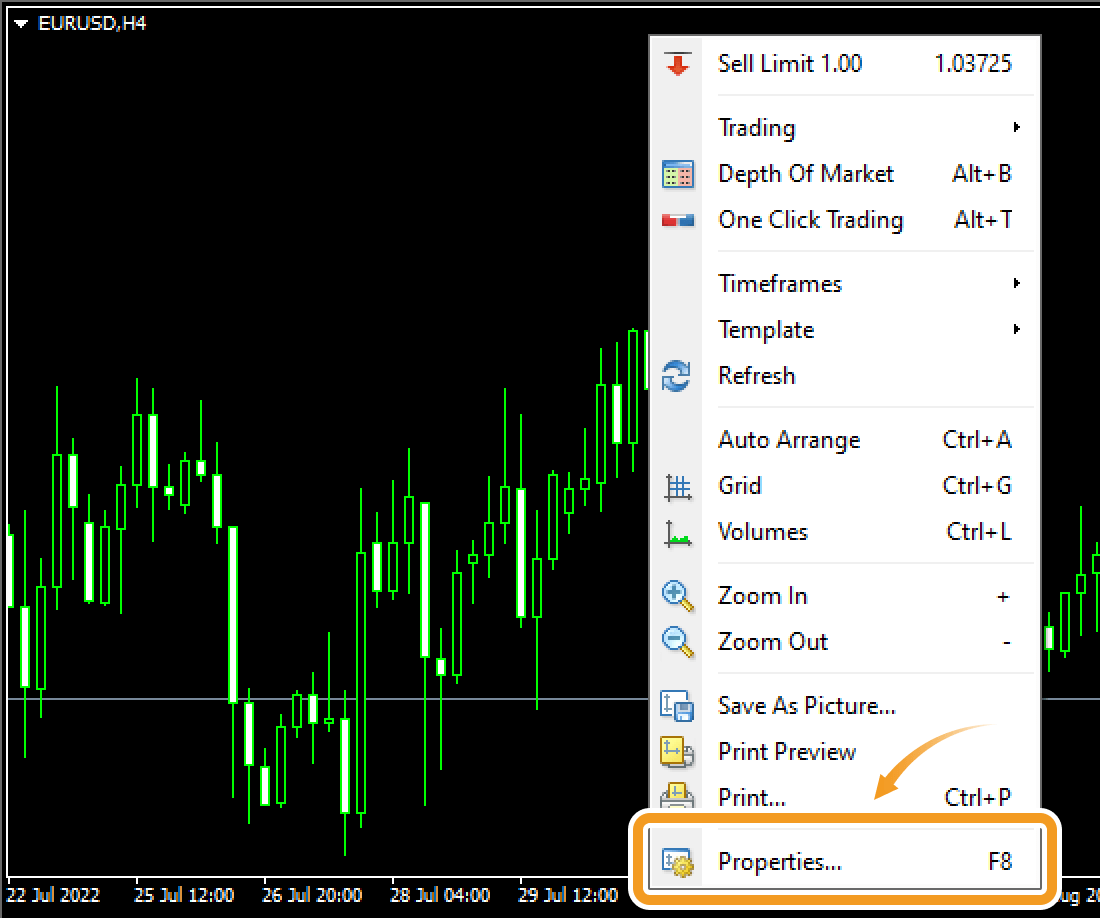
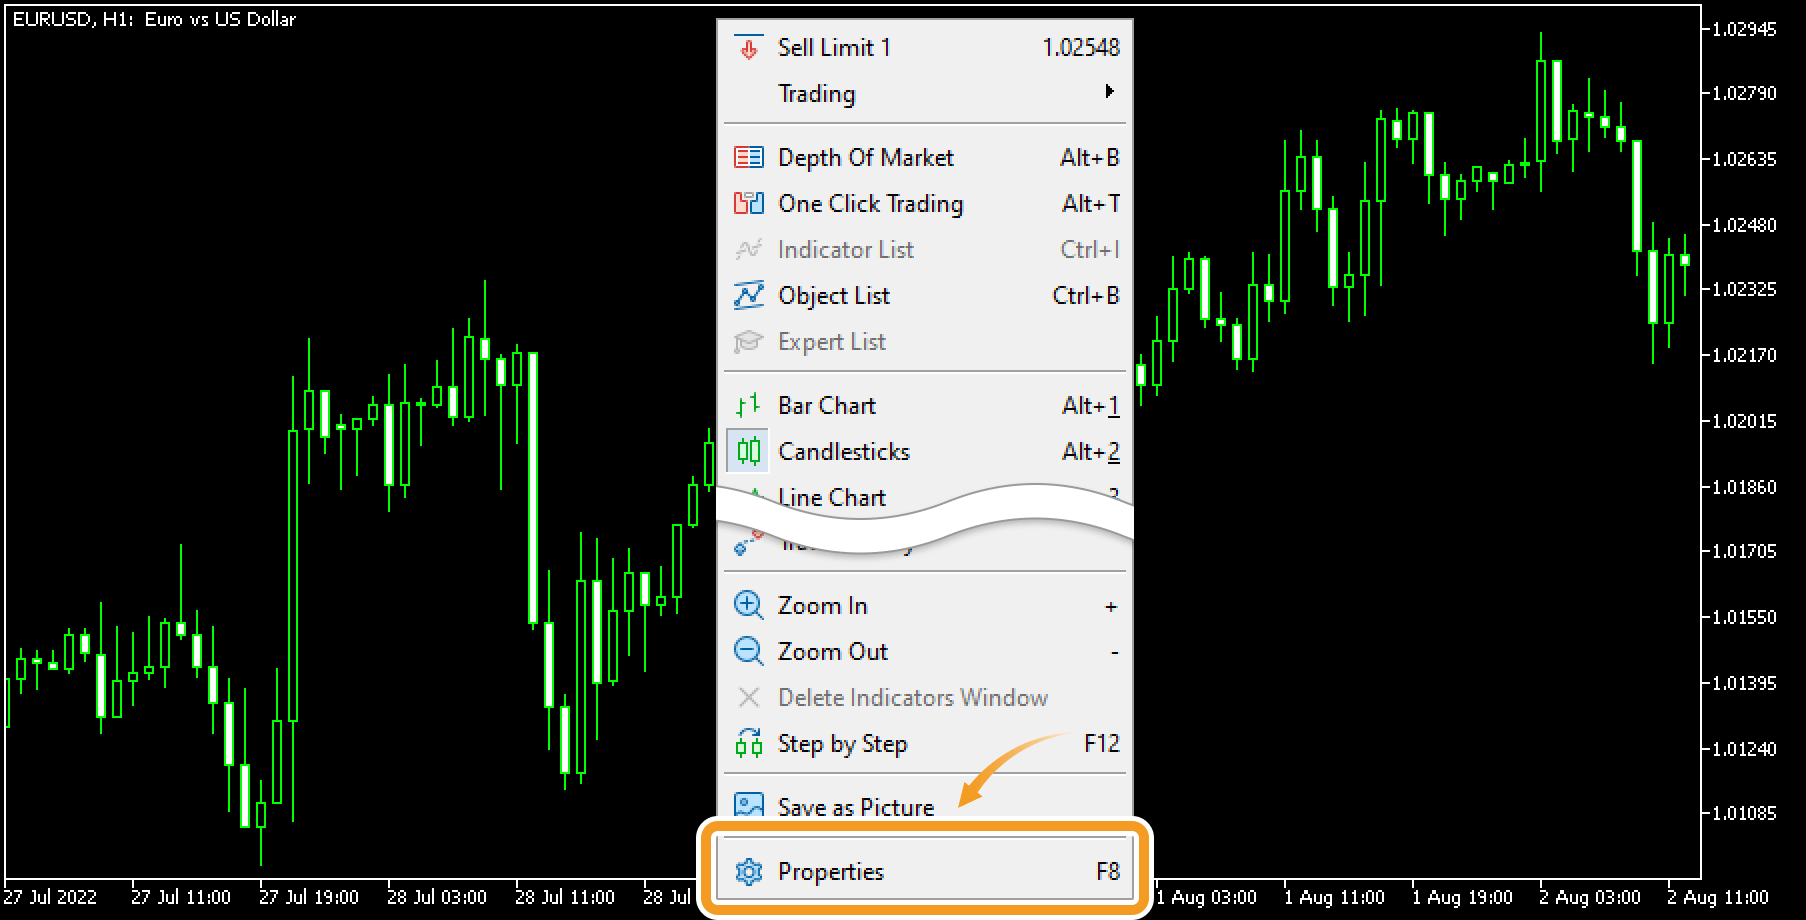
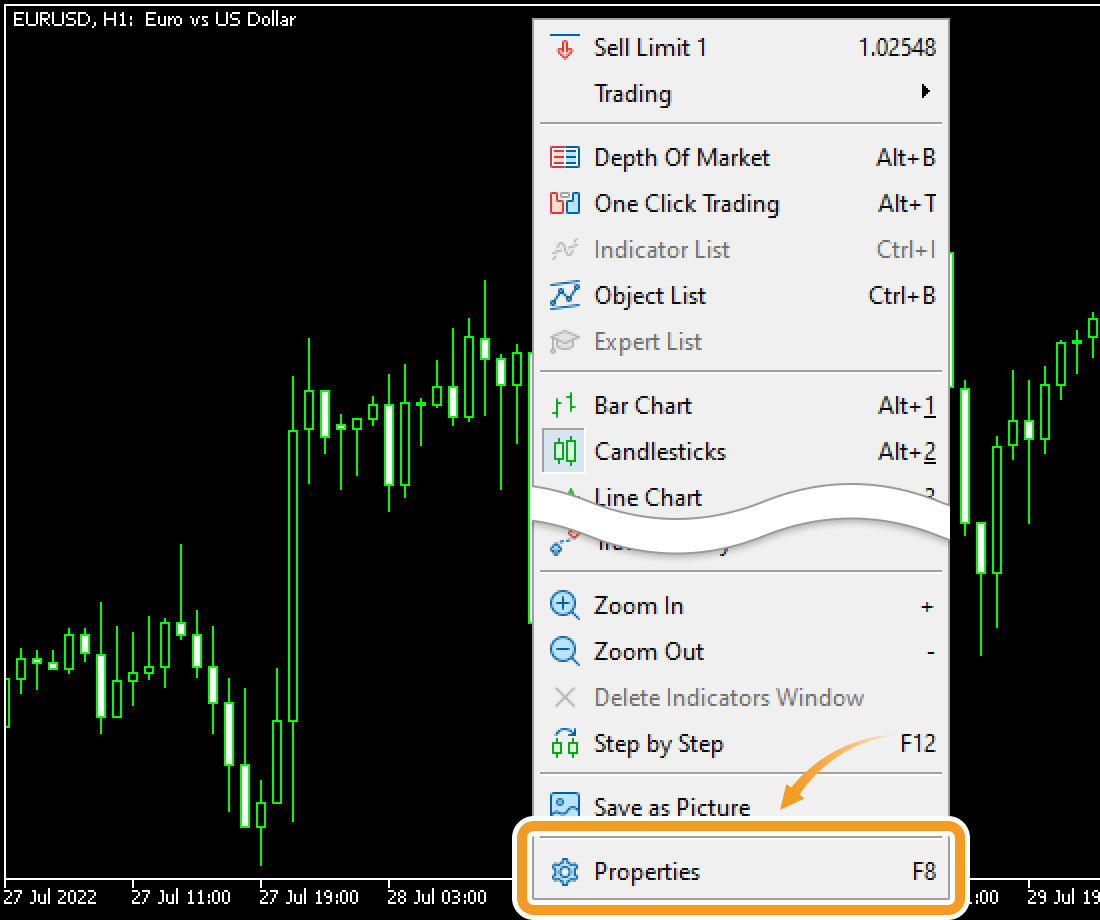
Right-click on the chart and select "Properties" from the context menu.
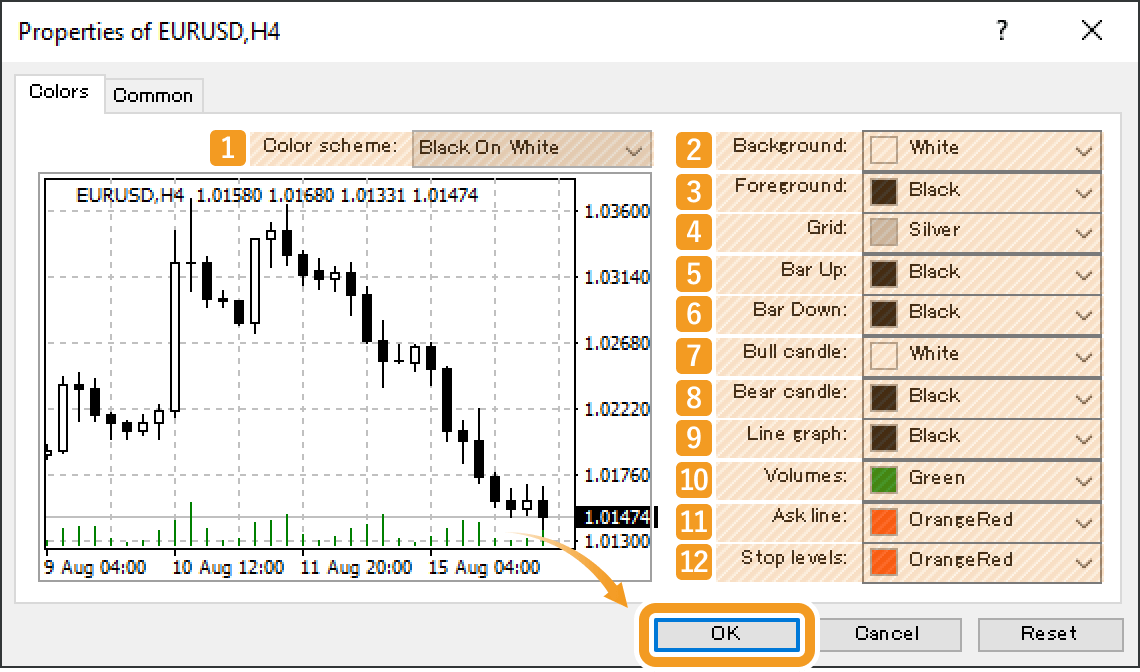
In the "Colors" tab, set the colors and click "OK".
|
Number |
Item name |
Descriptions |
|---|---|---|
|
1 |
Color scheme |
Select the color scheme from "Yellow On Black", "Green On Black", and "Black On White". |
|
2 |
Background |
Select the background color. |
|
3 |
Foreground |
Select the color for frames, scales, period separators, object descriptions, oscillator names, symbol names, and OHLC. |
|
4 |
Grid |
Select the grid line color. |
|
5 |
Bar Up |
Select the bullish candle color. |
|
6 |
Bar Down |
Select the bearish candle color. |
|
7 |
Bull candle |
Select the color for the real body of bullish candles. |
|
8 |
Bear candle |
Select the color for the real body of bearish candles. |
|
9 |
Line graph |
Select the line chart color. |
|
10 |
Volumes |
Select the volume color. |
|
11 |
Ask line |
Select the color for the Ask price. |
|
12 |
Stop levels |
Select the color for the take-profit (T/P) and stop-loss (S/L). |
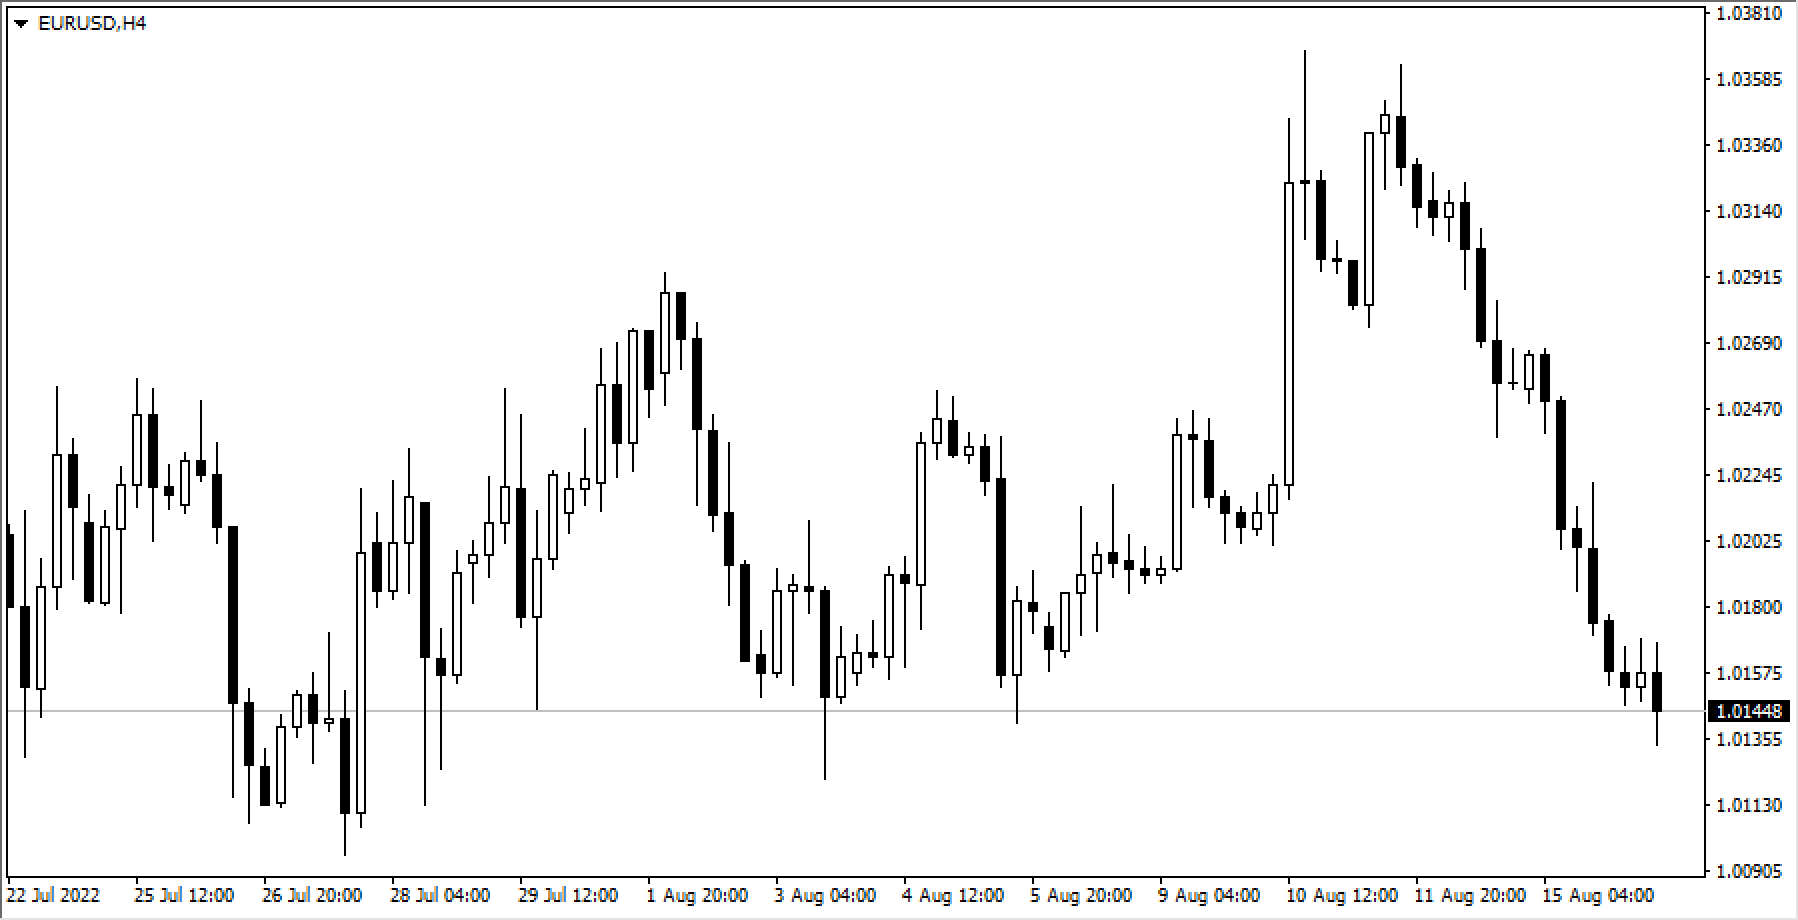
The chart will be displayed with the set colors.

You can change chart colors from the menu or chart.
Click "Charts" in the menu and select "Properties".
Right-click on the chart and select "Properties" from the context menu.
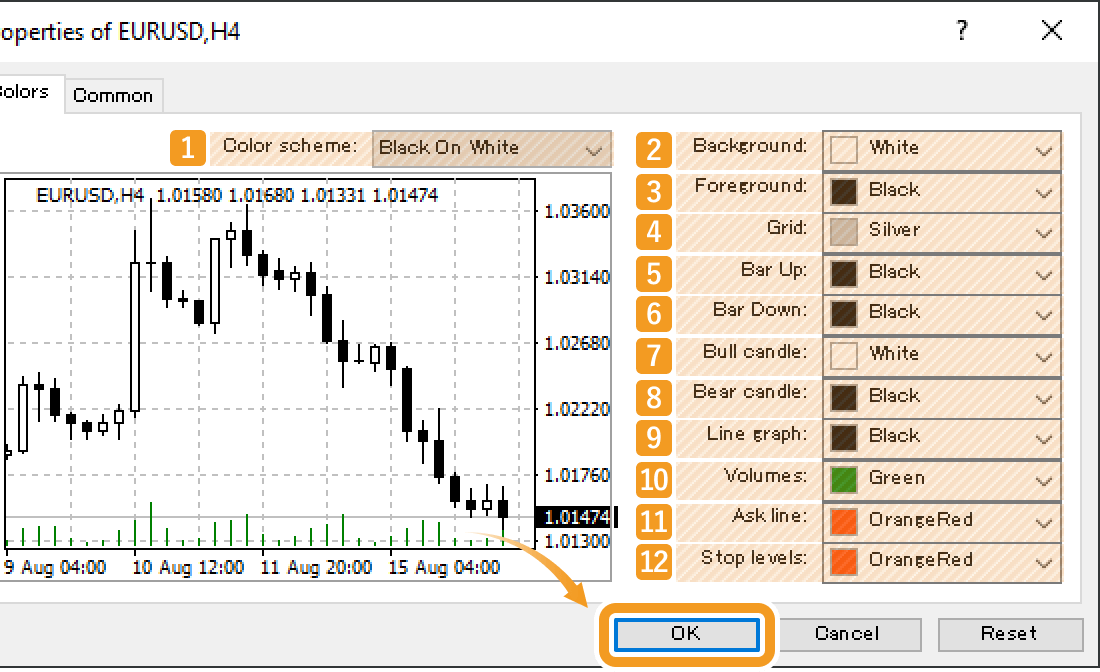
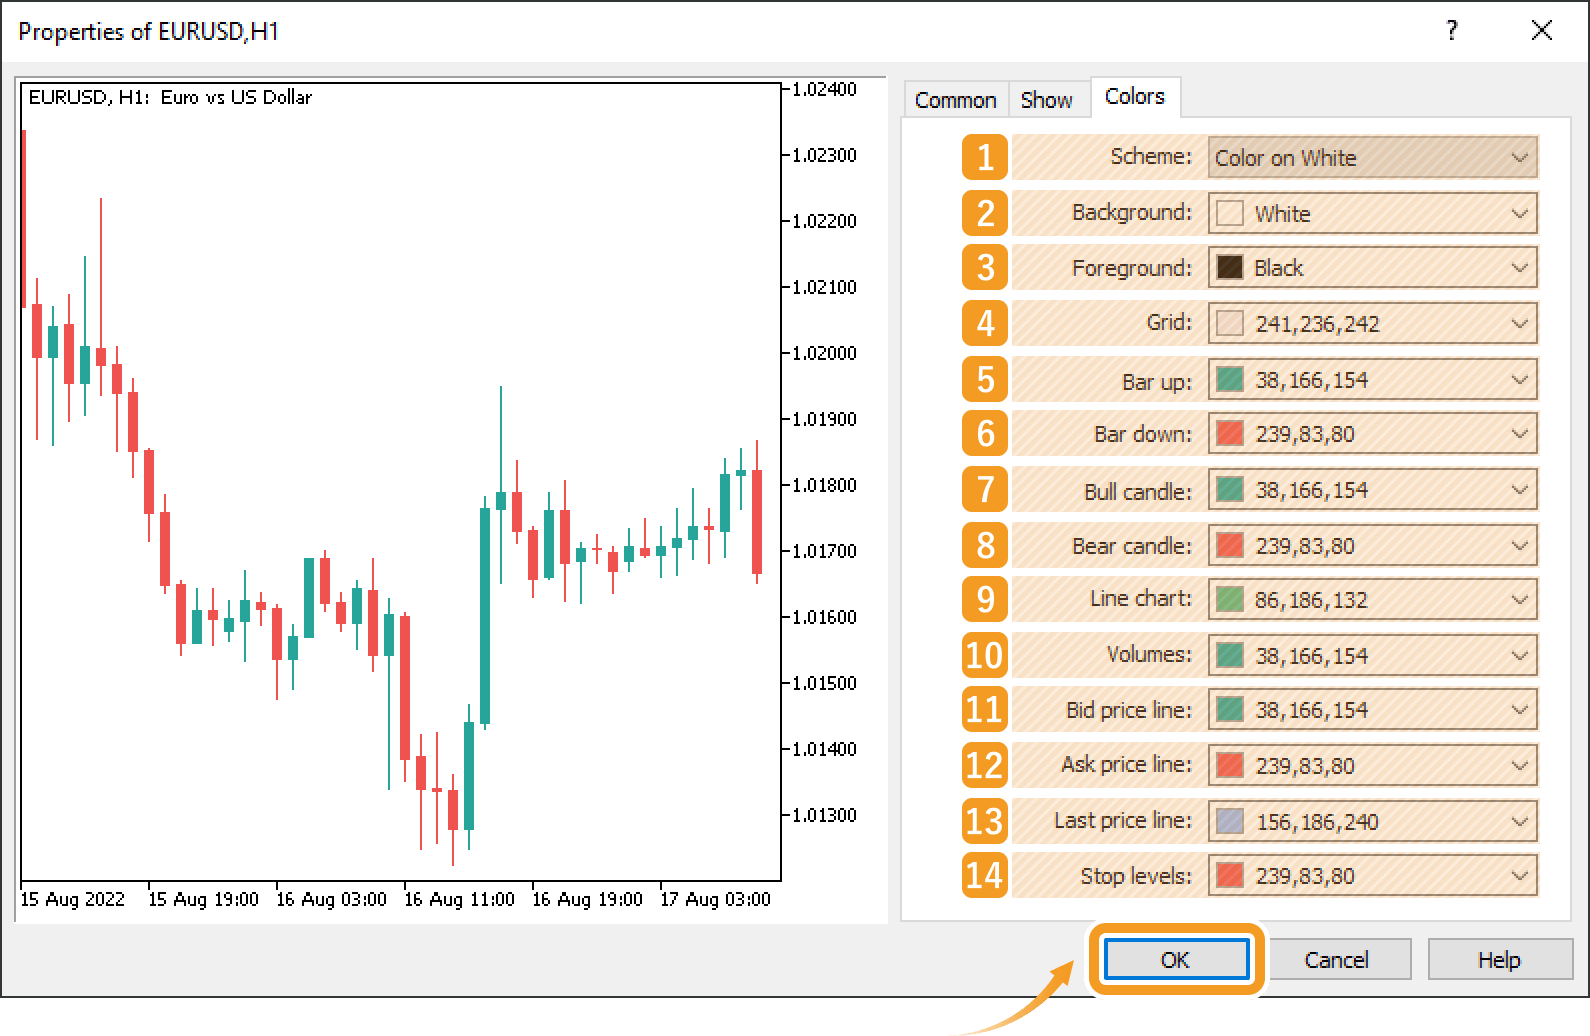
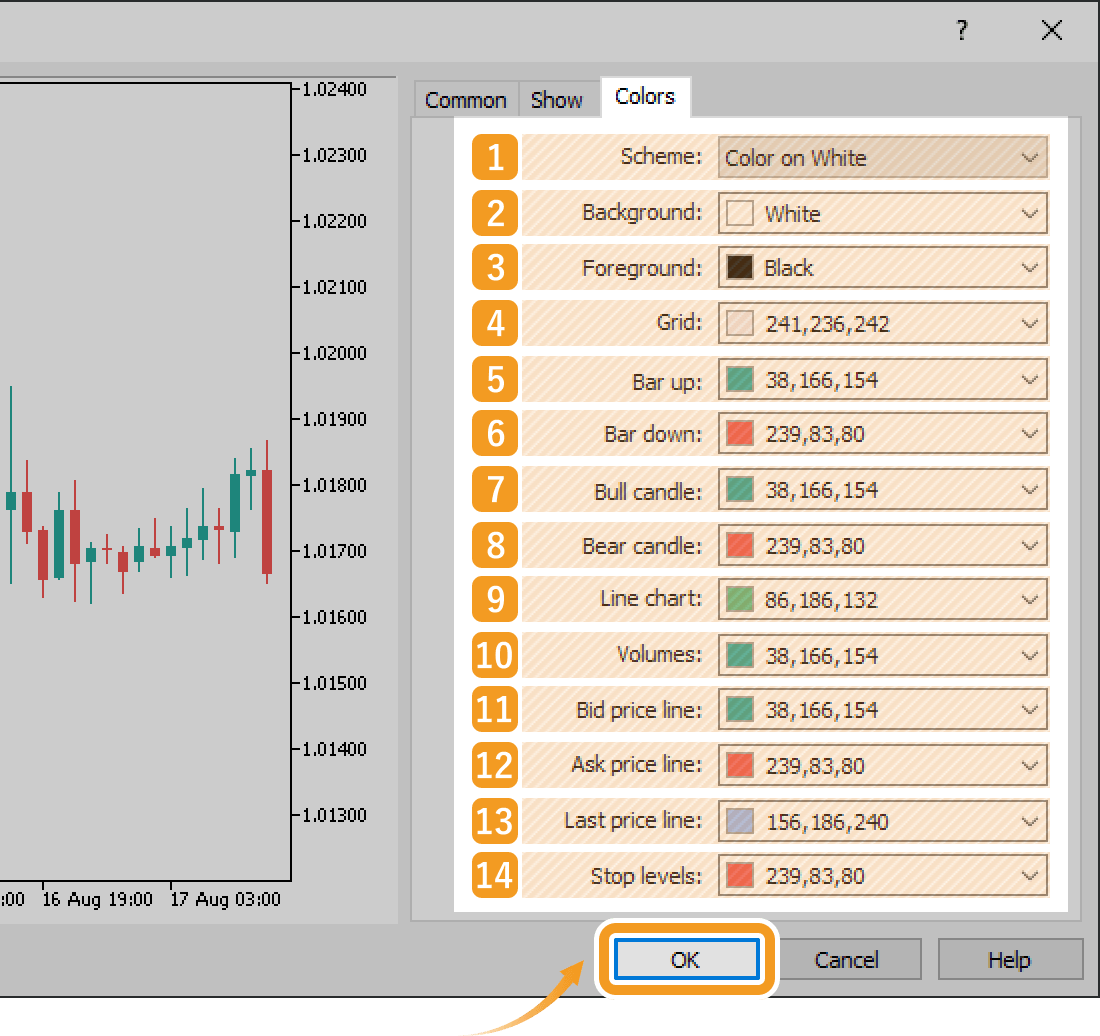
In the "Colors" tab, set the colors and click "OK".
|
Number |
Item name |
Descriptions |
|---|---|---|
|
1 |
Scheme |
Select the color scheme from "Yellow on Black", "Green on Black", "Black on White", and "Color on White". |
|
2 |
Background |
Select the background color. |
|
3 |
Foreground |
Select the color for frames, scales, period separators, trade history, object descriptions, oscillator names, symbol names, and OHLC. |
|
4 |
Grid |
Select the grid line color. |
|
5 |
Bar up |
Select the bullish candle color. |
|
6 |
Bar down |
Select the bearish candle color. |
|
7 |
Bull candle |
Select the color for the real body of bullish candles. |
|
8 |
Bear candle |
Select the color for the real body of bearish candles. |
|
9 |
Line chart |
Select the line chart color. |
|
10 |
Volumes |
Select the volume and tick volume colors. |
|
11 |
Bid price line |
Select the color for the Bid price. |
|
12 |
Ask price line |
Select the color for the Ask price. |
|
13 |
Last price line |
Select the color for the last price. |
|
14 |
Stop levels |
Select the color for the take-profit (T/P) and stop-loss (S/L). |
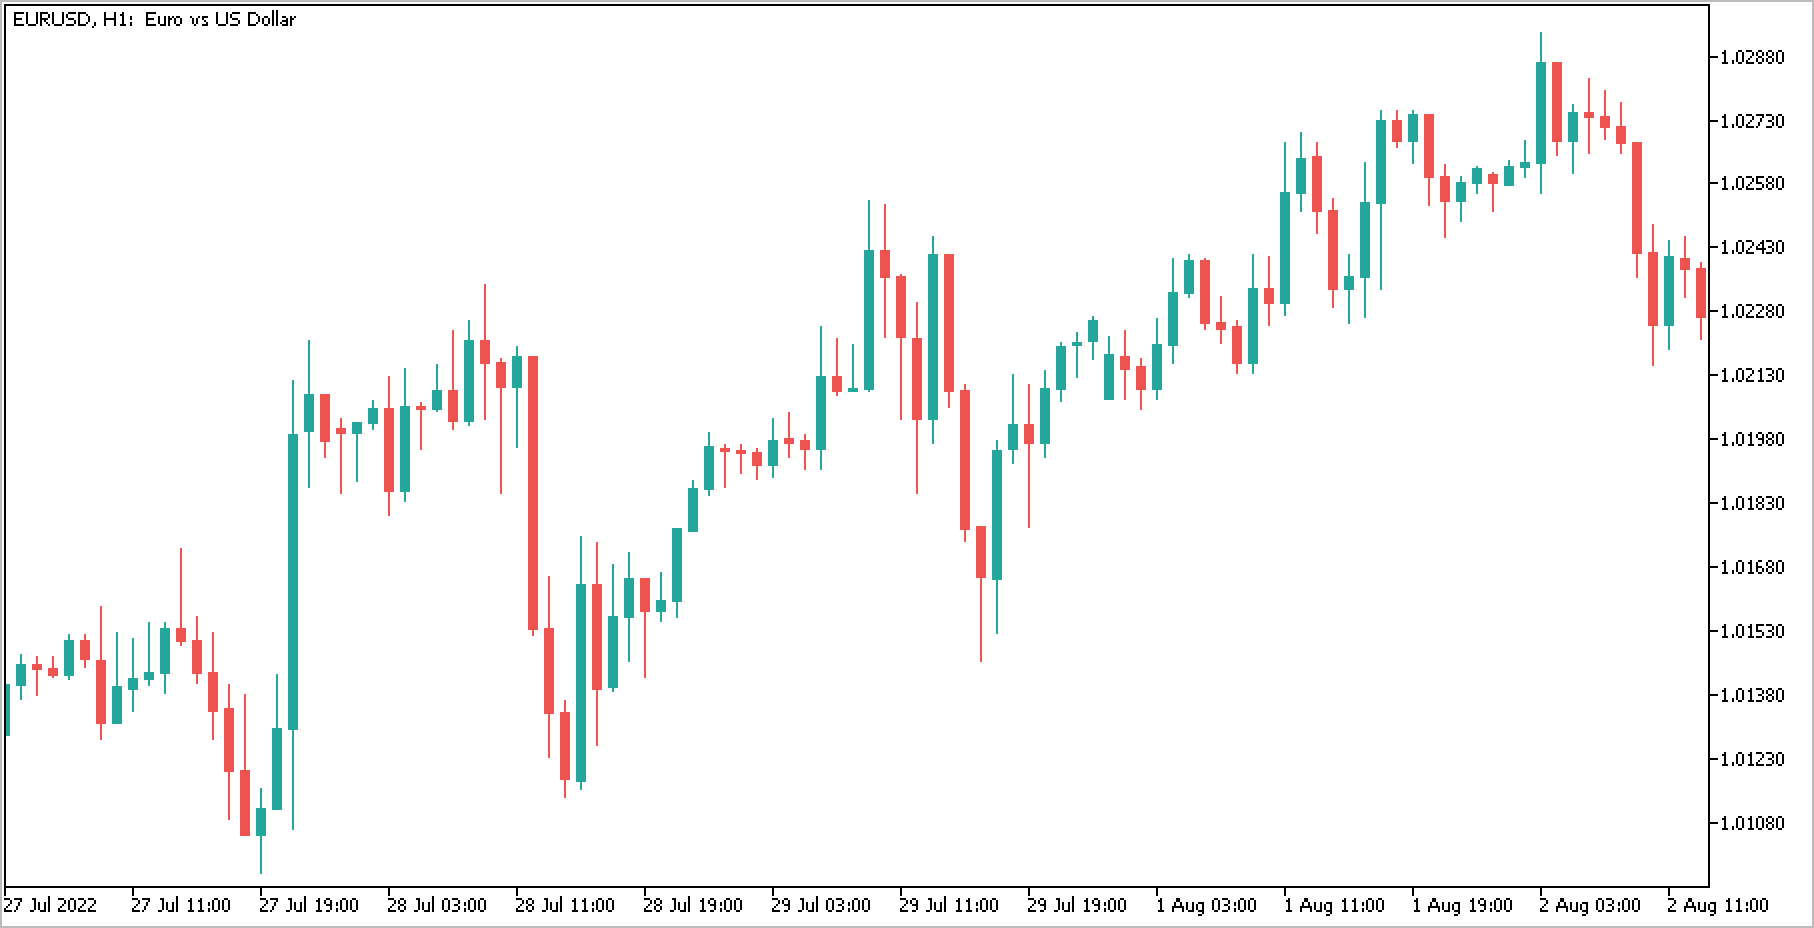
The chart will be displayed with the set colors.

Was this article helpful?
0 out of 0 people found this article helpful.
Thank you for your feedback.