- Features
-
Services/ProductsServices/ProductsServices/Products

Learn more about the retail trading conditions, platforms, and products available for trading that FXON offers as a currency broker.
You can't start without it.
Trading Platforms Trading Platforms Trading Platforms
Features and functionality comparison of MetaTrader 4/5, and correspondence table of each function by OS
Two account types to choose
Trading Account Types Trading Account Types Trading Account Types
Introducing FXON's Standard and Elite accounts.
close close

-
SupportSupportSupport

Support information for customers, including how to open an account, how to use the trading tools, and a collection of QAs from the help desk.
Recommended for beginner!
Account Opening Account Opening Account Opening
Detailed explanation of everything from how to open a real account to the deposit process.
MetaTrader4/5 User Guide MetaTrader4/5 User Guide MetaTrader4/5 User Guide
The most detailed explanation of how to install and operate MetaTrader anywhere.
FAQ FAQ FAQ
Do you have a question? All the answers are here.
Coming Soon
Glossary Glossary GlossaryGlossary of terms related to trading and investing in general, including FX, virtual currencies and CFDs.
News News News
Company and License Company and License Company and License
Sitemap Sitemap Sitemap
Contact Us Contact Us Contact Us
General, personal information and privacy inquiries.
close close

- Promotion
- Trader's Market
- Partner
-
close close
Learn more about the retail trading conditions, platforms, and products available for trading that FXON offers as a currency broker.
You can't start without it.
Features and functionality comparison of MetaTrader 4/5, and correspondence table of each function by OS
Two account types to choose
Introducing FXON's Standard and Elite accounts.
Support information for customers, including how to open an account, how to use the trading tools, and a collection of QAs from the help desk.
Recommended for beginner!
Detailed explanation of everything from how to open a real account to the deposit process.
The most detailed explanation of how to install and operate MetaTrader anywhere.
Do you have a question? All the answers are here.
Coming Soon
Glossary of terms related to trading and investing in general, including FX, virtual currencies and CFDs.
General, personal information and privacy inquiries.
Useful information for trading and market information is posted here. You can also view trader-to-trader trading performance portfolios.
Find a trading buddy!
Share trading results among traders. Share operational results and trading methods.
- Legal Documents TOP
- Client Agreement
- Risk Disclosure and Warning Notice
- Order and Execution Policy
- Complaints Procedure Policy
- AML/CFT and KYC Policy
- Privacy Policy
- eKYC Usage Policy
- Cookies Policy
- Website Access and Usage Policy
- Introducer Agreement
- Business Partner Agreement
- VPS Service Terms and Condition


This article was :
published
updated
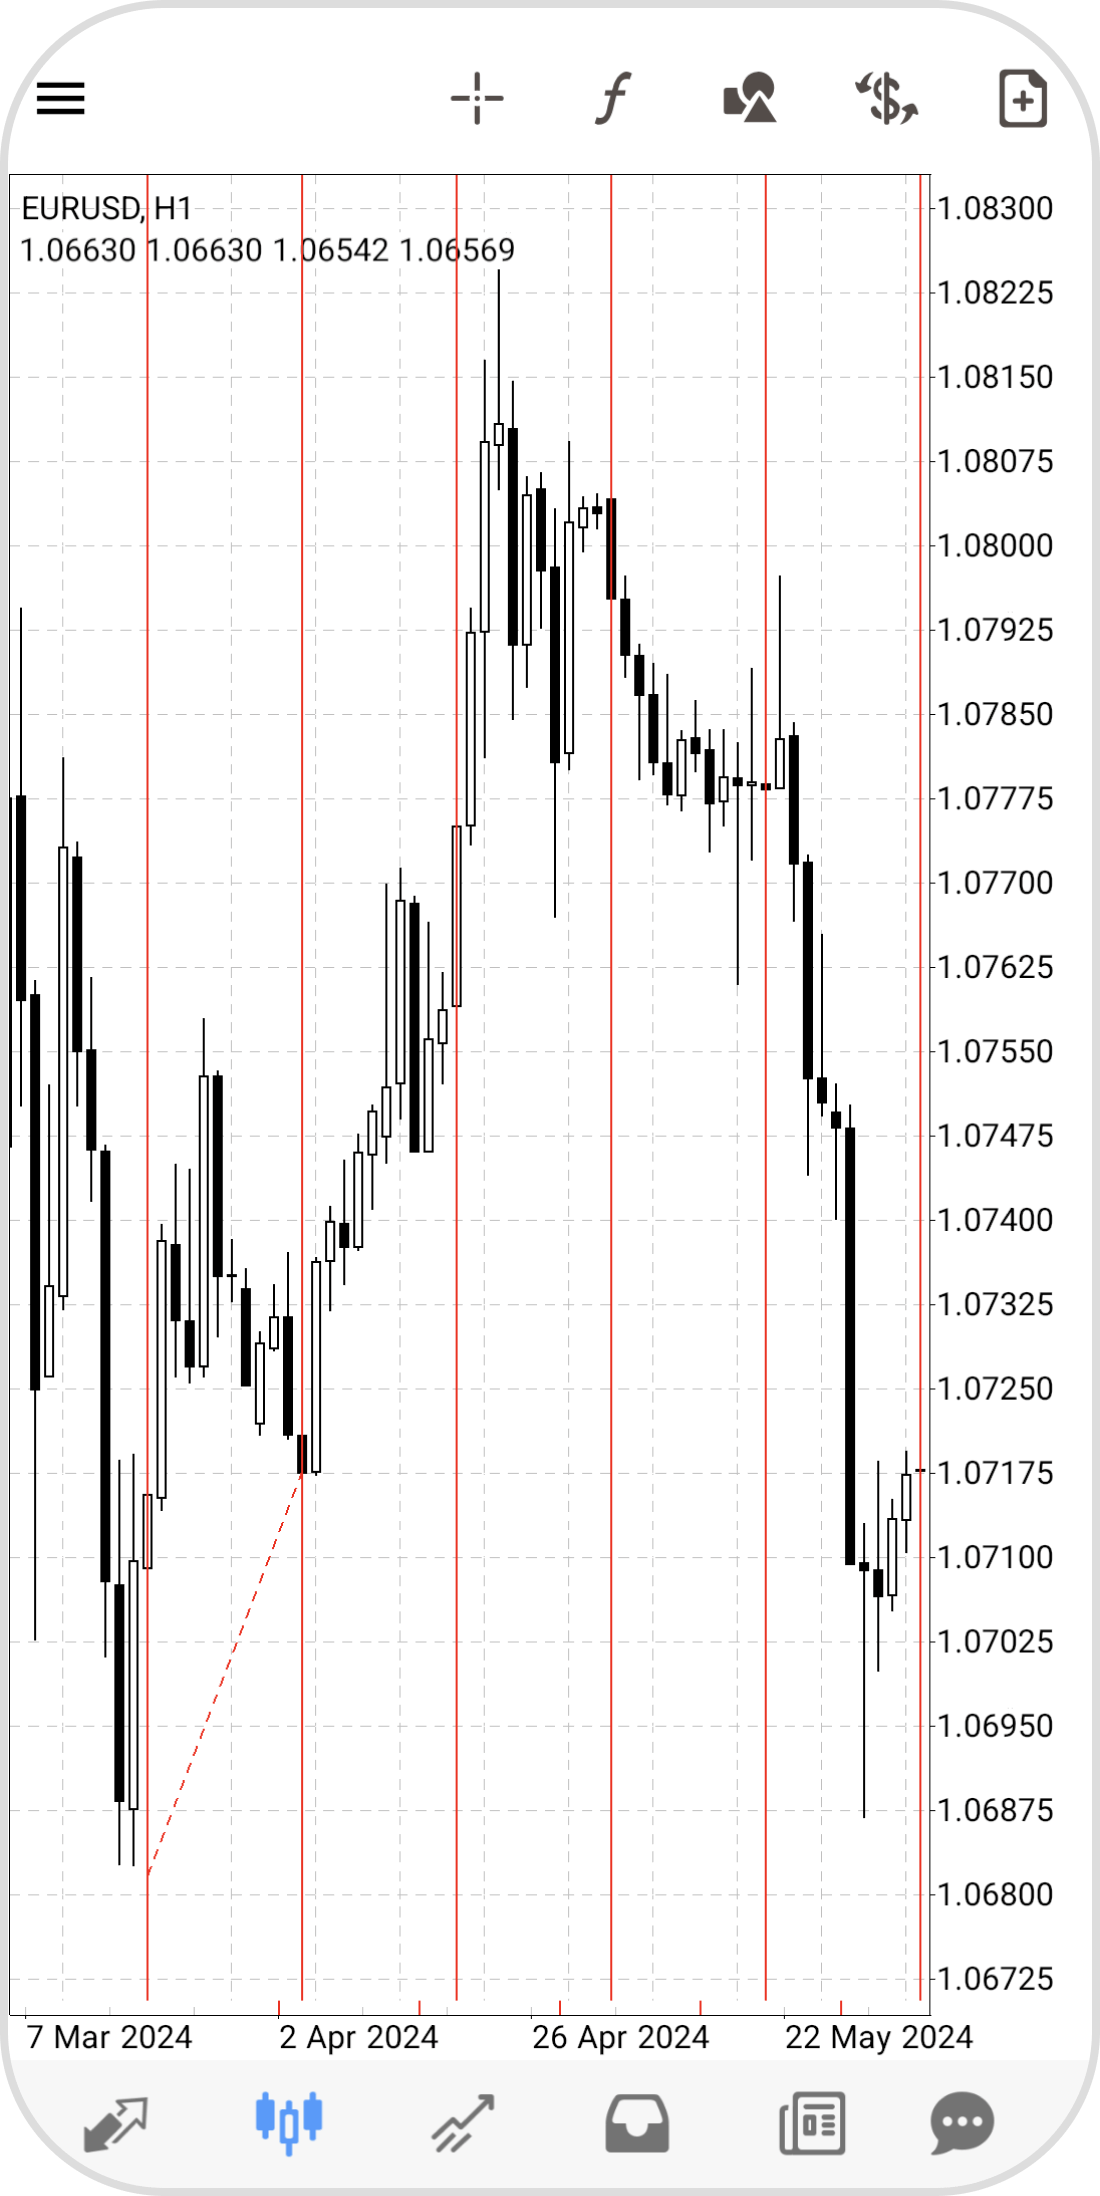
Here we'll look over the steps on how to display cycle lines on the chart in MetaTrader4 (MT4) / MetaTrader5 (MT5) app for Android and iOS mobile devices. Cycle lines are made up of multiple evenly-spaced vertical lines and are used to analyze market cycles.
| Related article: | Draw trendline |
| Draw trendline by angle |
iPhone
*Scroll horizontally to see more*Swipe horizontally to see more
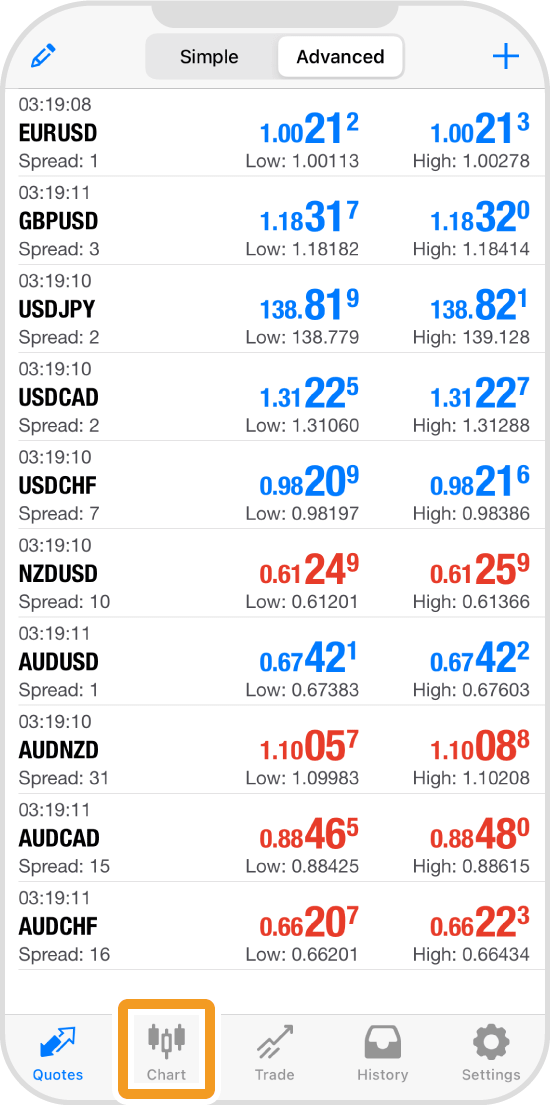
Step 1
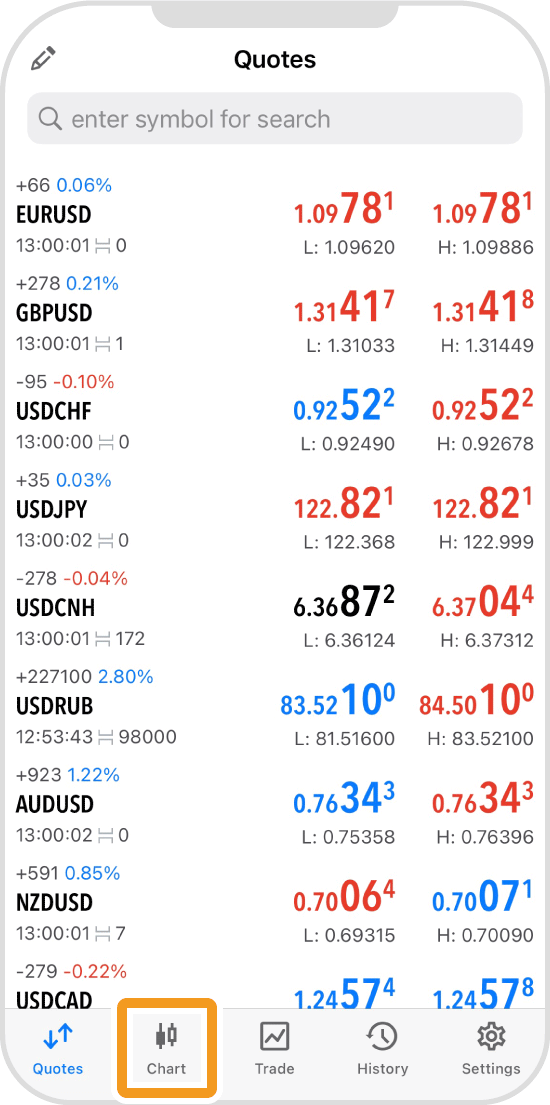
Tap "Chart" on the bottom navigation bar.
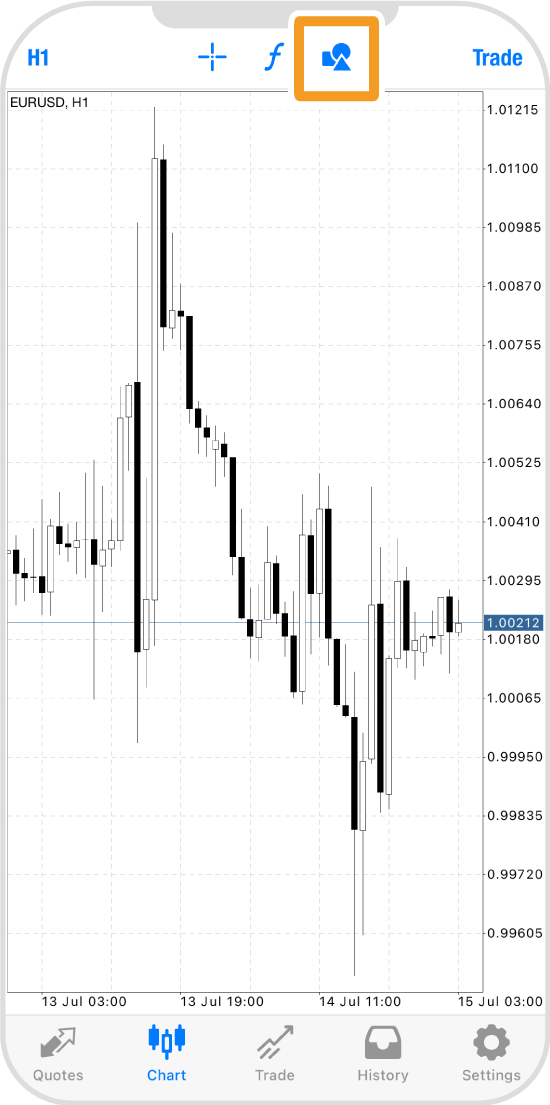
Step 2
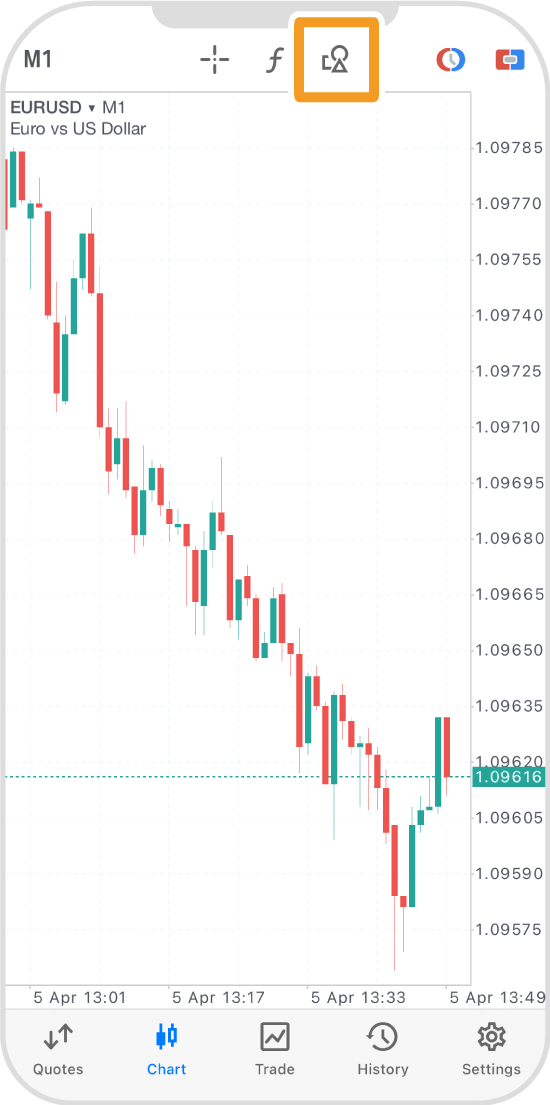
Tap the "Objects" icon at the top.
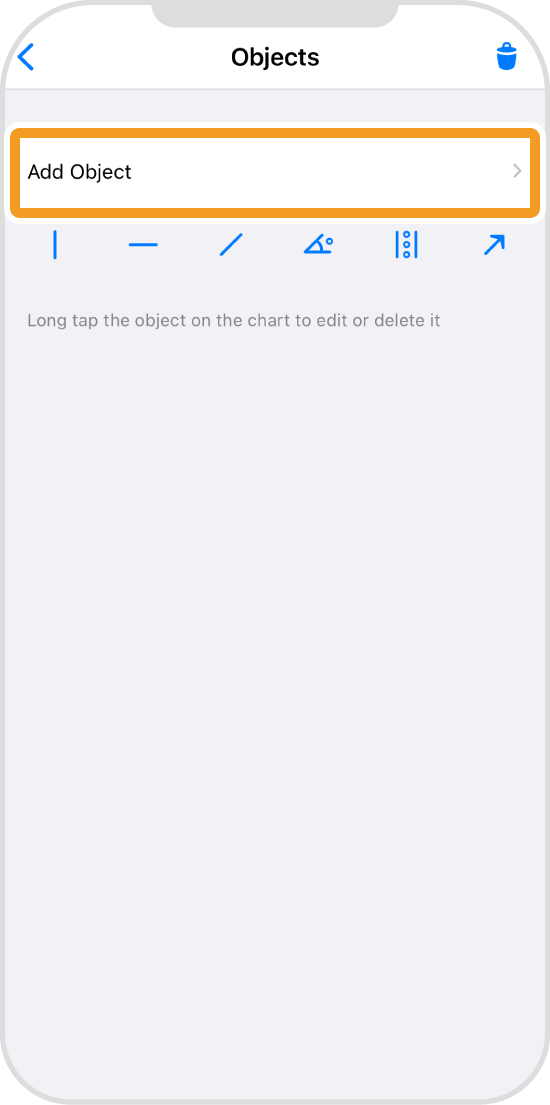
Step 3
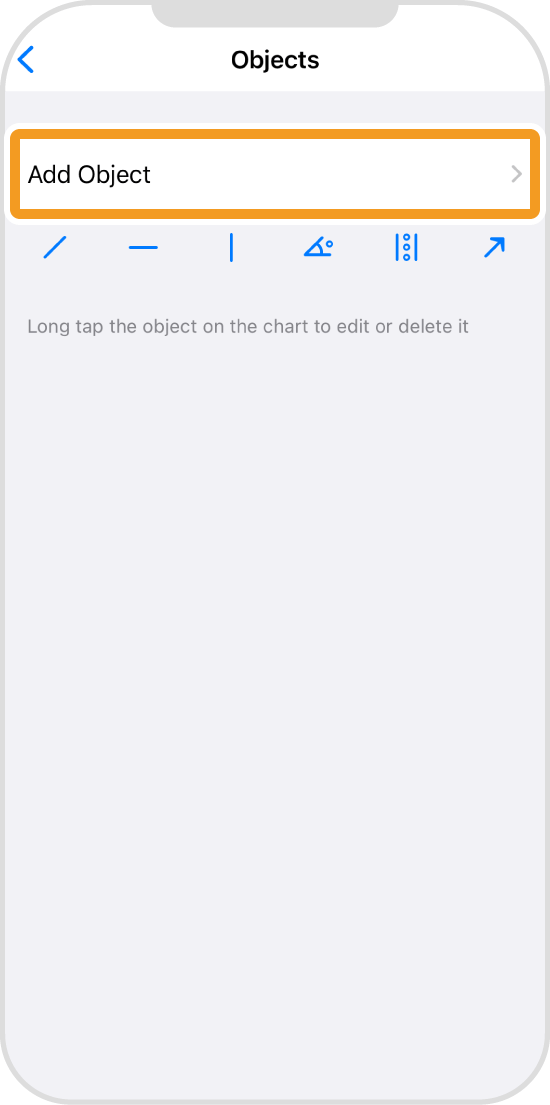
Tap "Add Object".
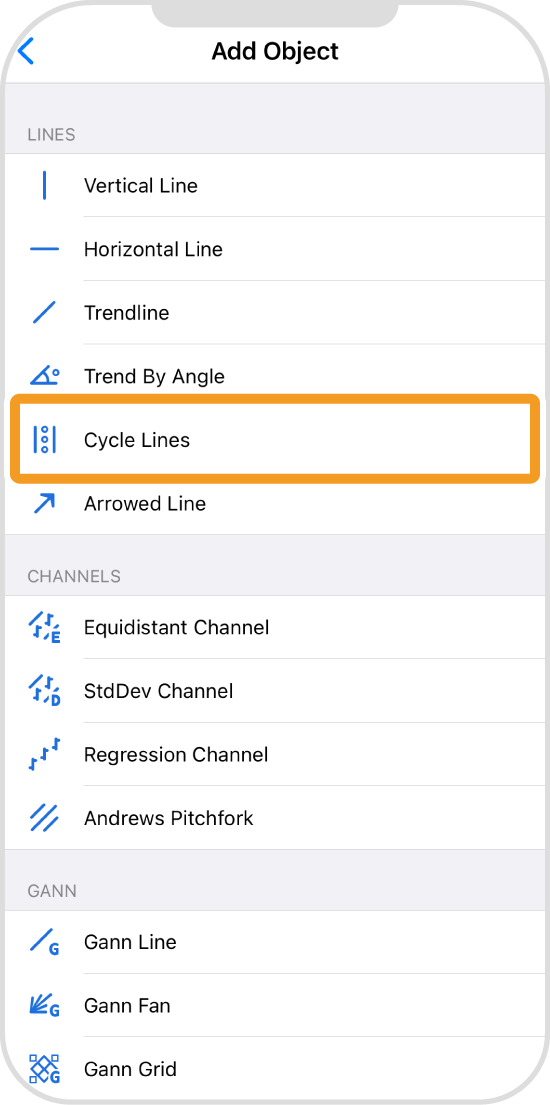
Step 4
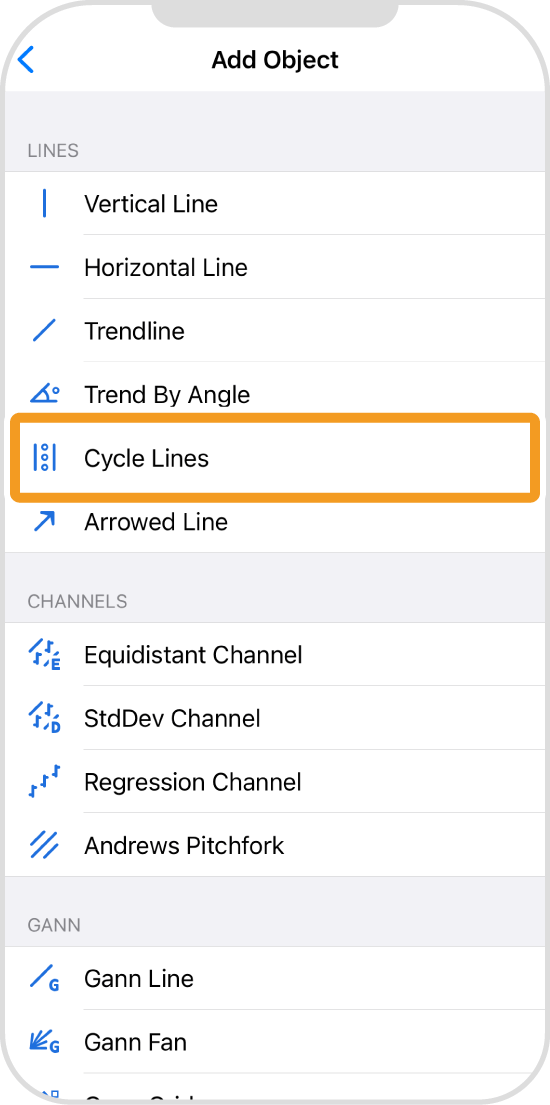
Tap "Cycle Lines".
Step 5
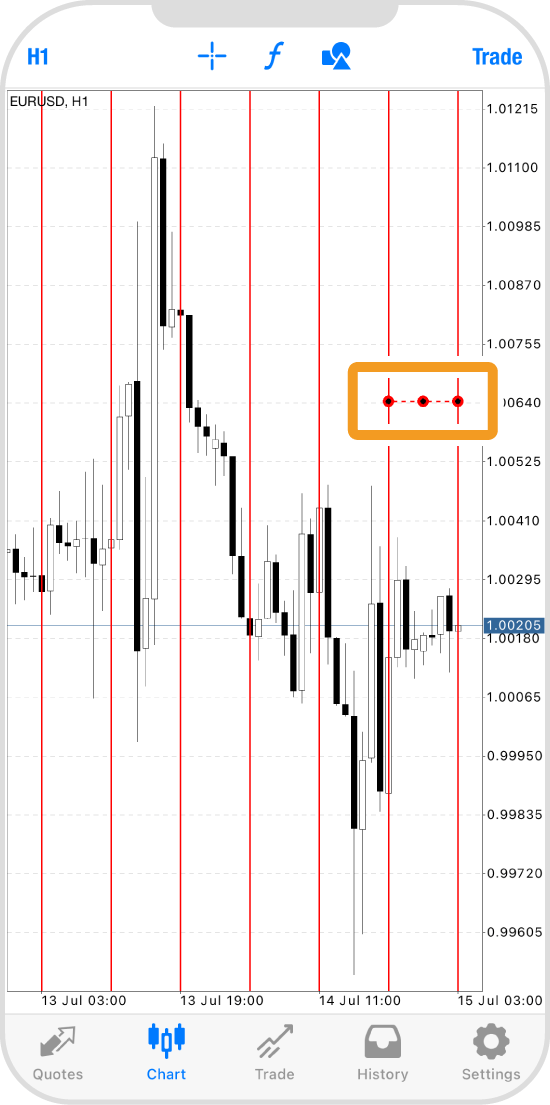
Tap the starting point, adjust the cycle interval, and drag to the end point.
Step 6
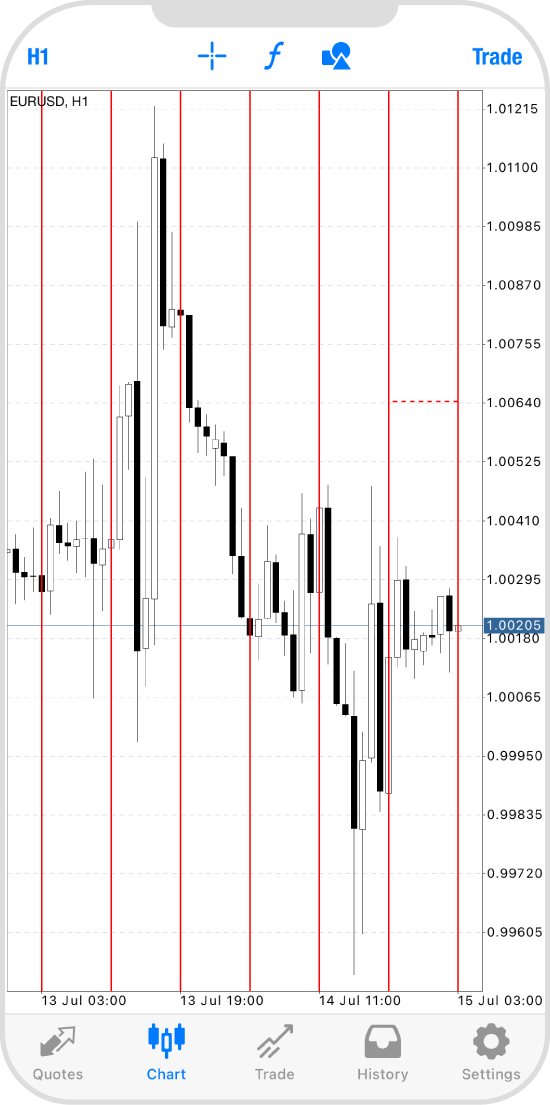
To fix the cycle lines, tap on the line to hide the dots.
Android
*Scroll horizontally to see more*Swipe horizontally to see more
Step 1
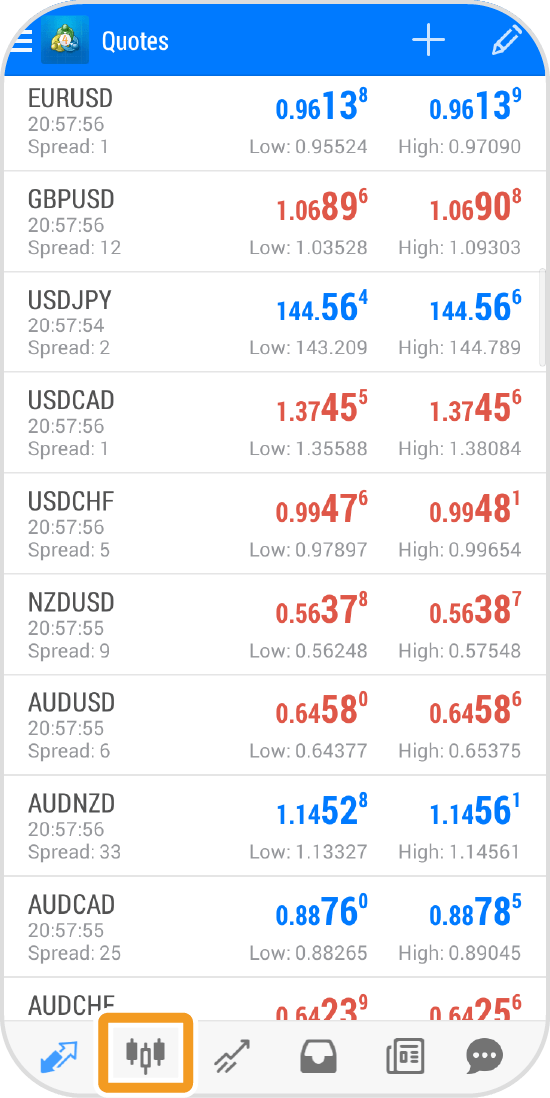
Tap "Charts" on the bottom navigation bar.
Step 2
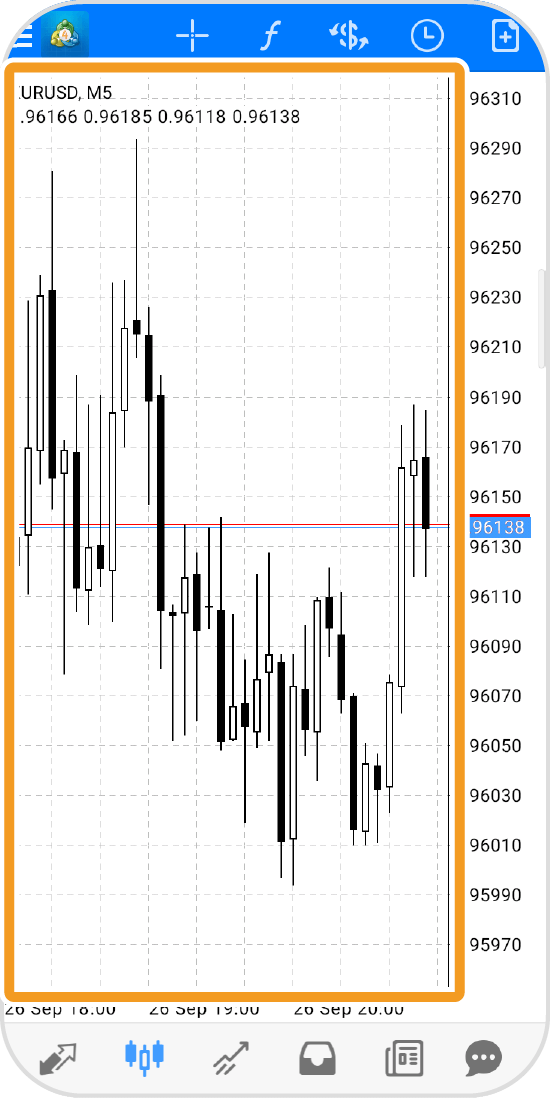
Tap on the chart.
Step 3
Tap the "Objects" icon.
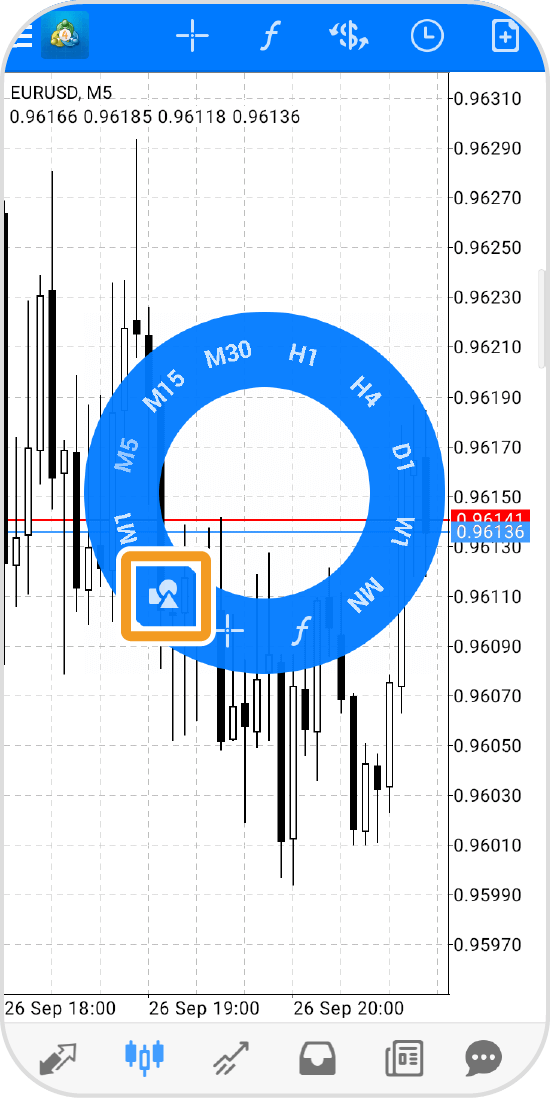
Step 4
Tap "+" in the top right corner.
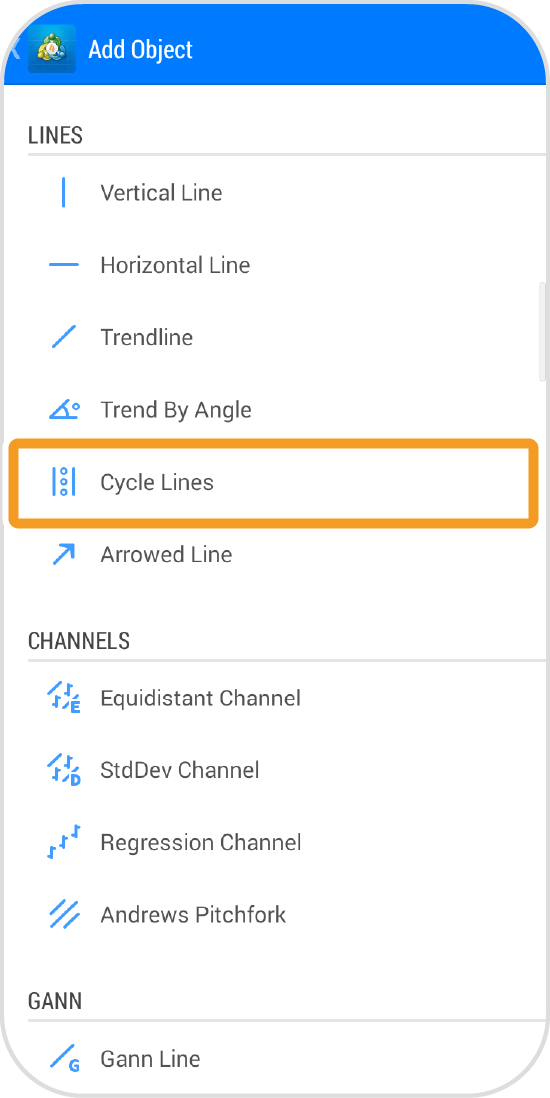
Step 5
Tap the starting point, adjust the cycle interval, and drag to the end point.
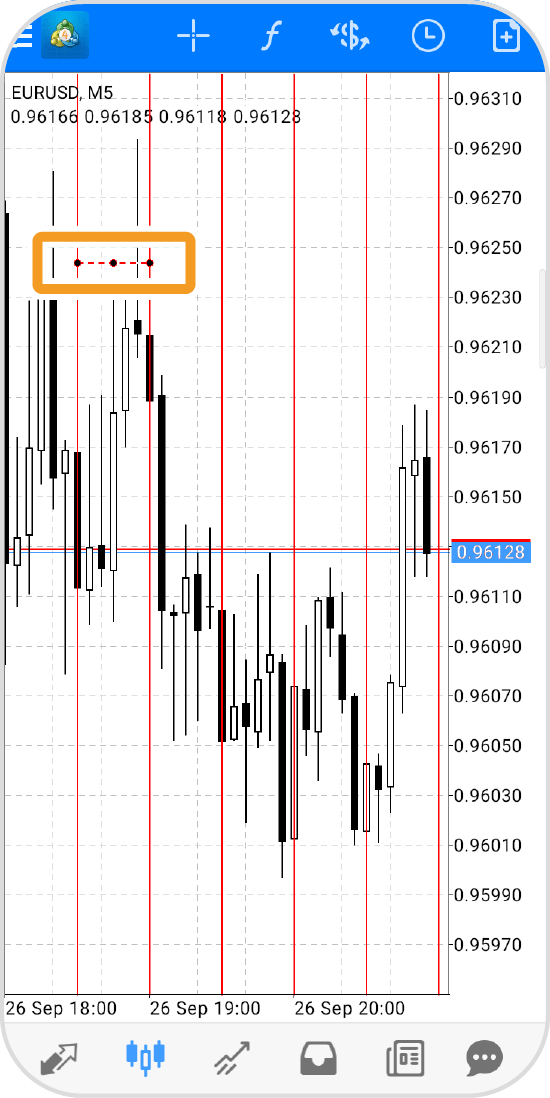
Step 6
Tap the starting point and swipe to the endpoint of a cycle.
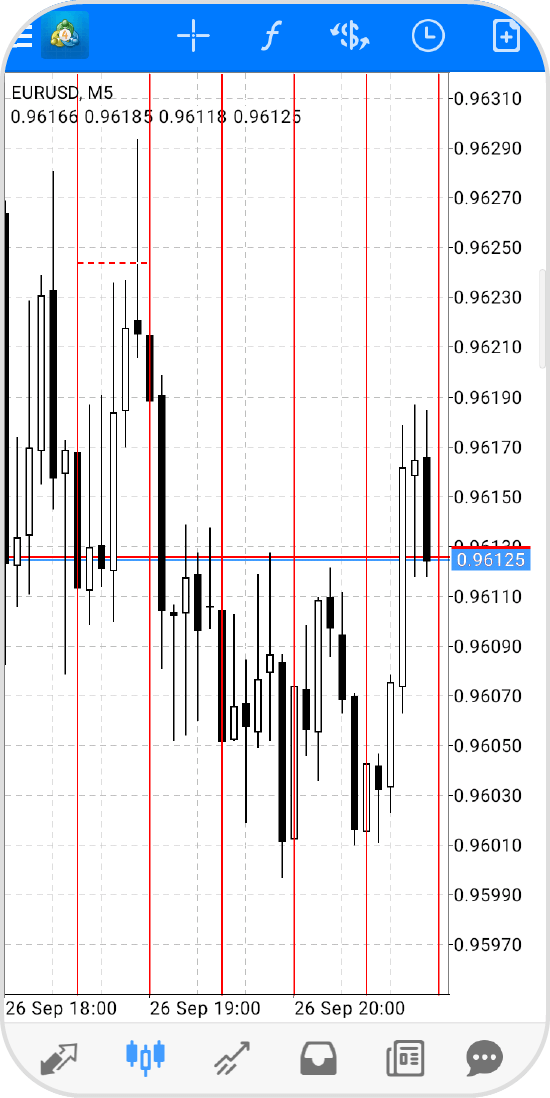
Step 7
To fix the cycle line, tap around the line with three black dots to hide them.
iPad
*Scroll horizontally to see more*Swipe horizontally to see more
Step 1
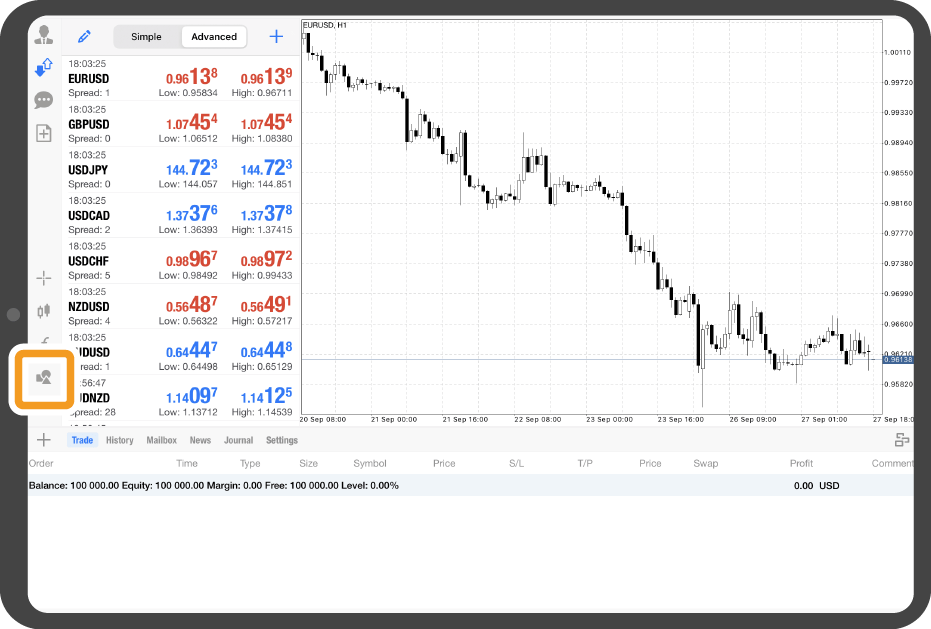
Tap the "Objects" icon on the left.
Step 2
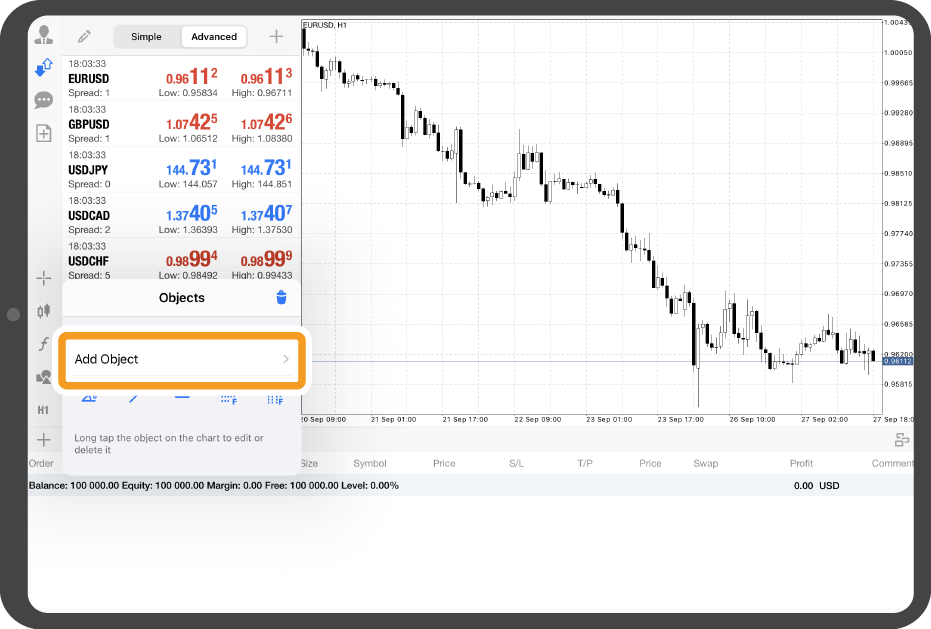
Tap "Add Object".
Step 3
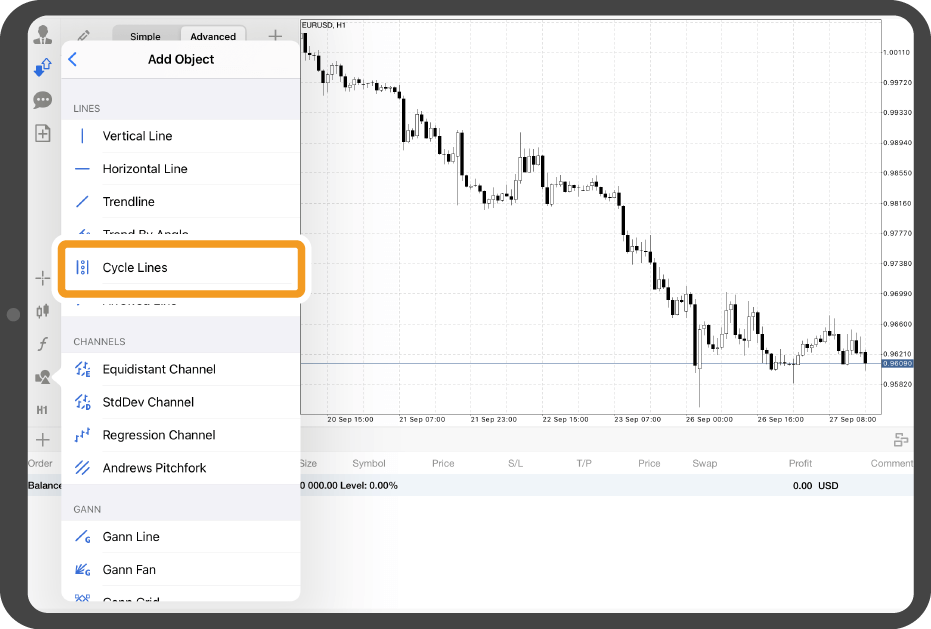
Tap "Cycle Lines".
Step 4
Tap the starting point and swipe to the endpoint of a cycle.
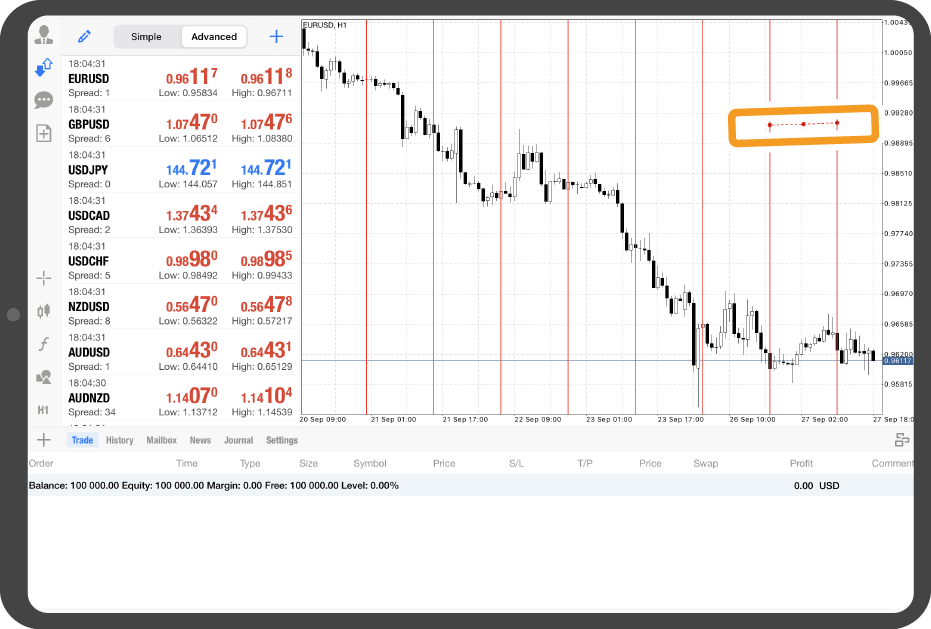
Step 5
To fix the cycle line, tap around the line with three red dots to hide them.
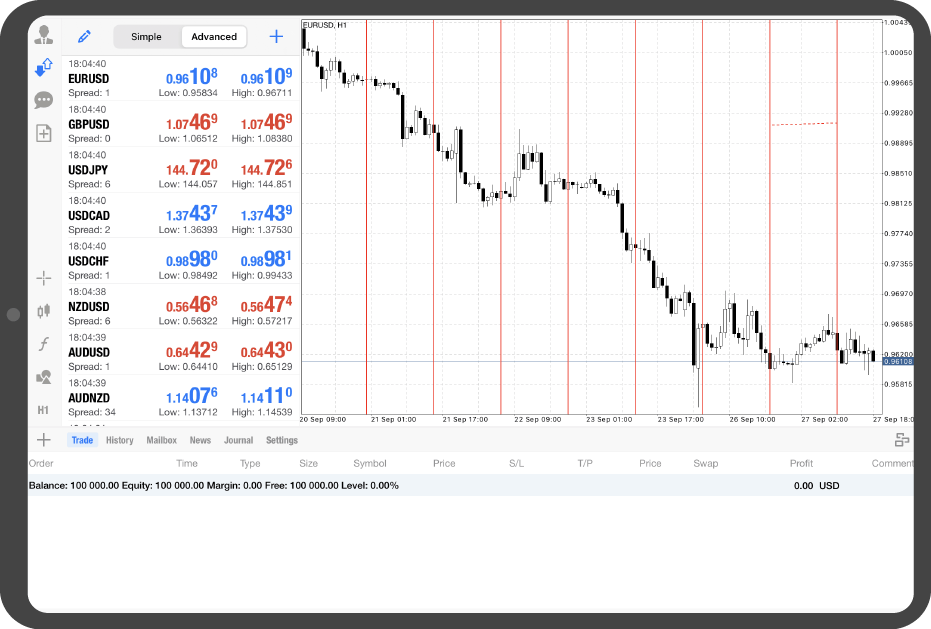
Android tablet
*Scroll horizontally to see more*Swipe horizontally to see more
Step 1
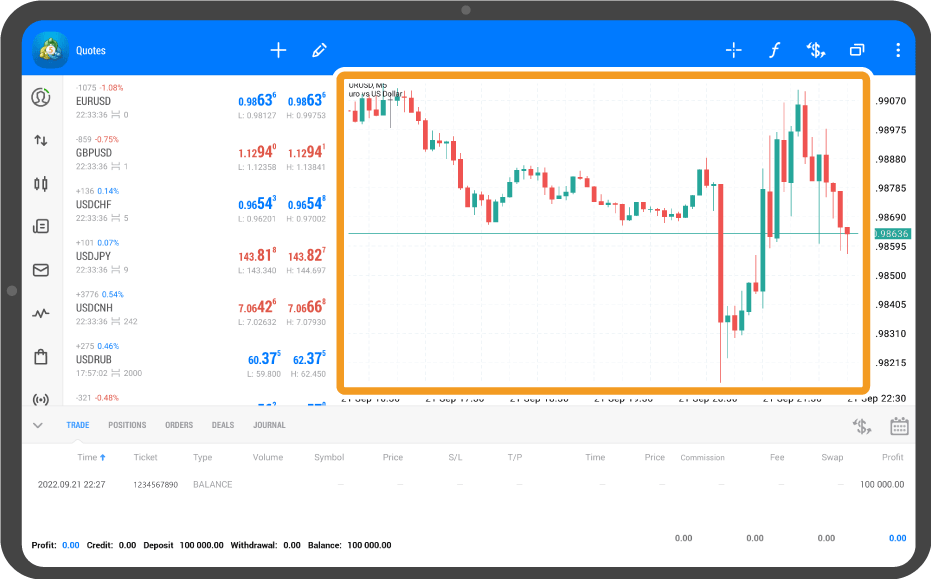
Tap on the chart.
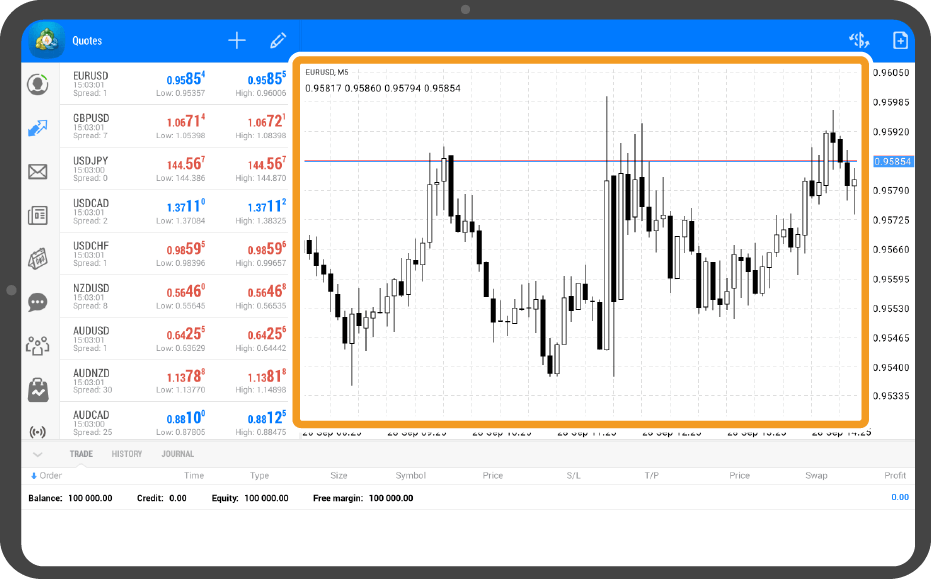
Step 2
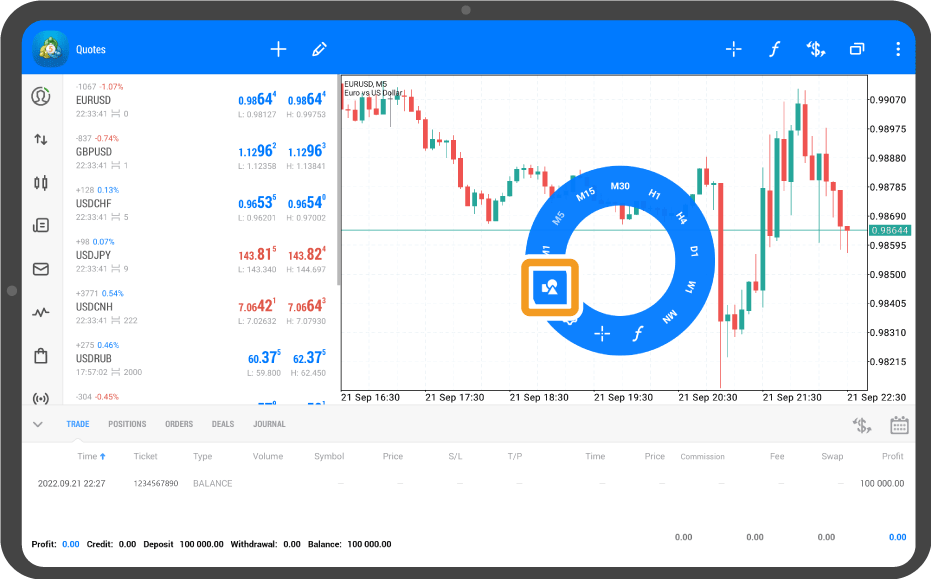
Tap the "Objects" icon.
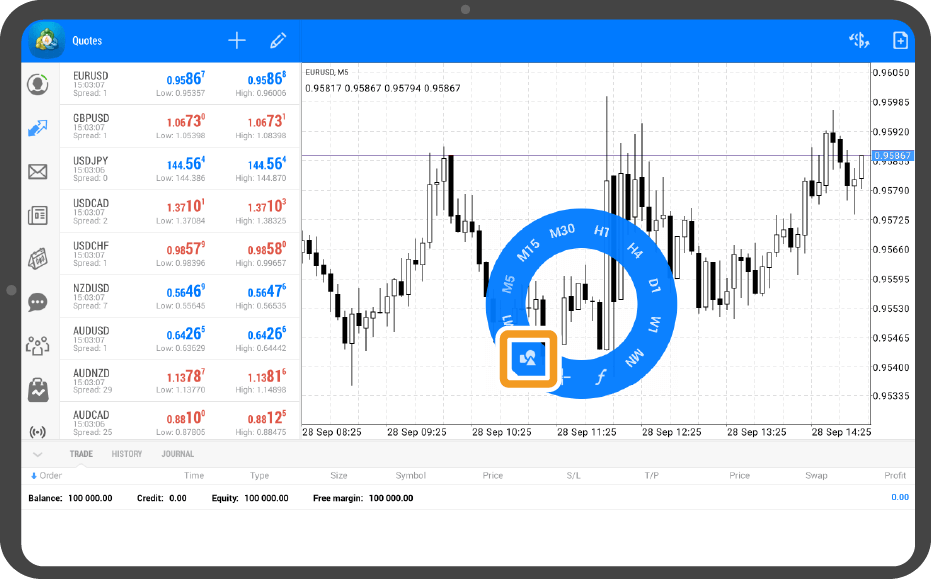
Step 3
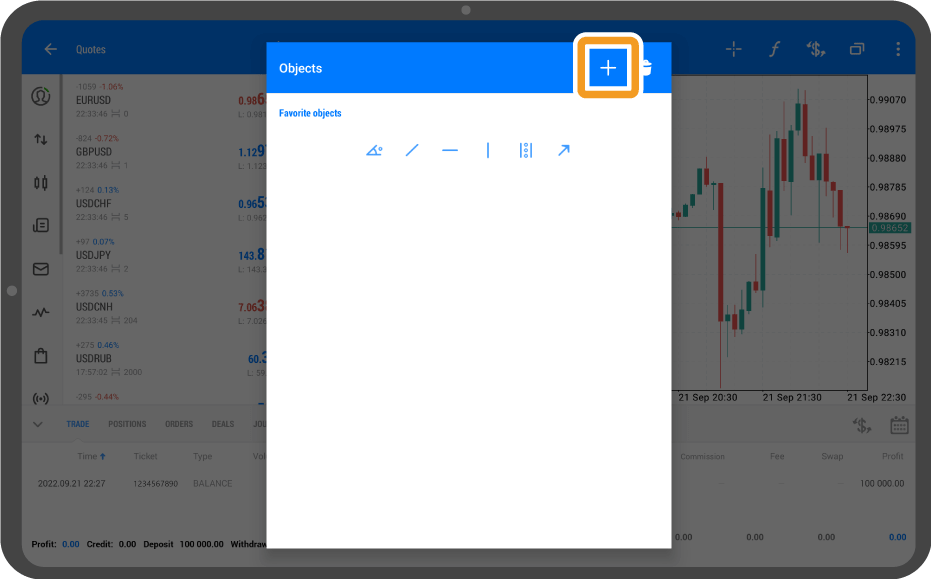
The list of objects on the chart will be displayed. Tap "+" in the top right corner.
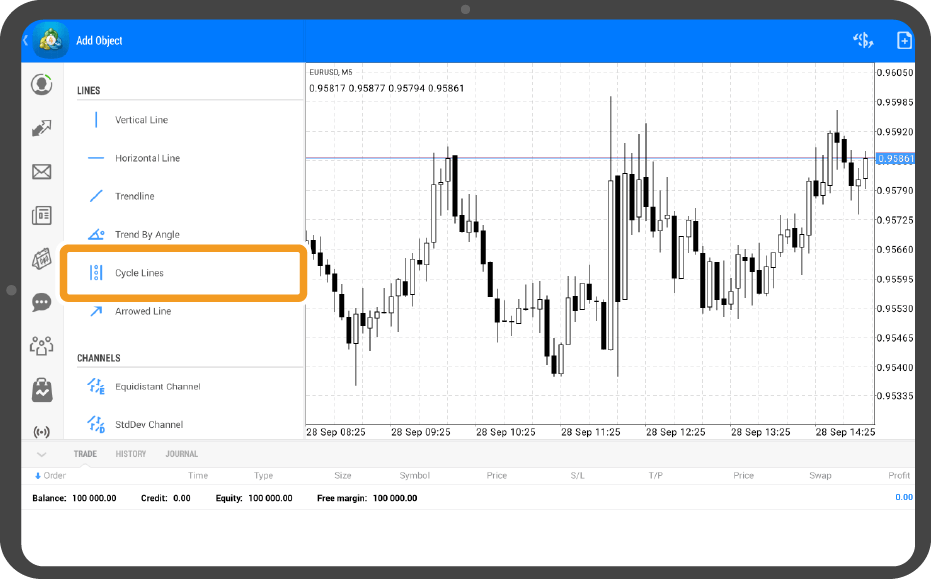
Step 4
Tap the starting point, adjust the cycle interval, and drag to the end point.
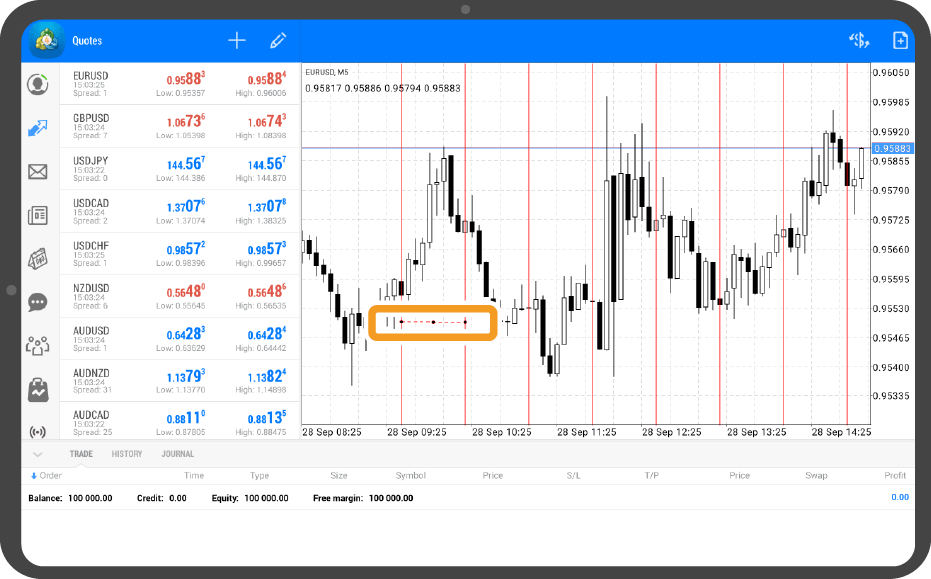
Step 5
Tap the starting point and swipe to the endpoint of a cycle.
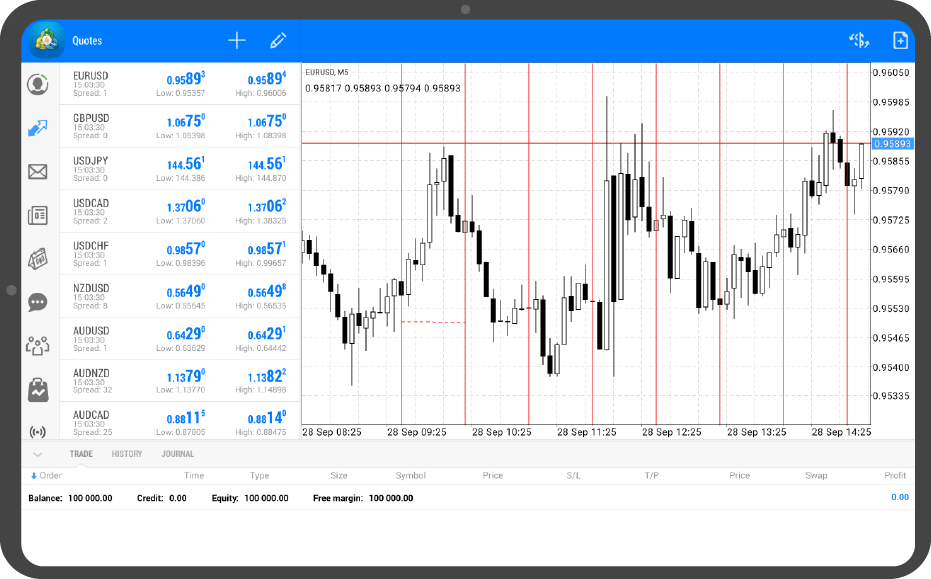
Step 6
To fix the cycle line, tap around the line with three black dots to hide them.
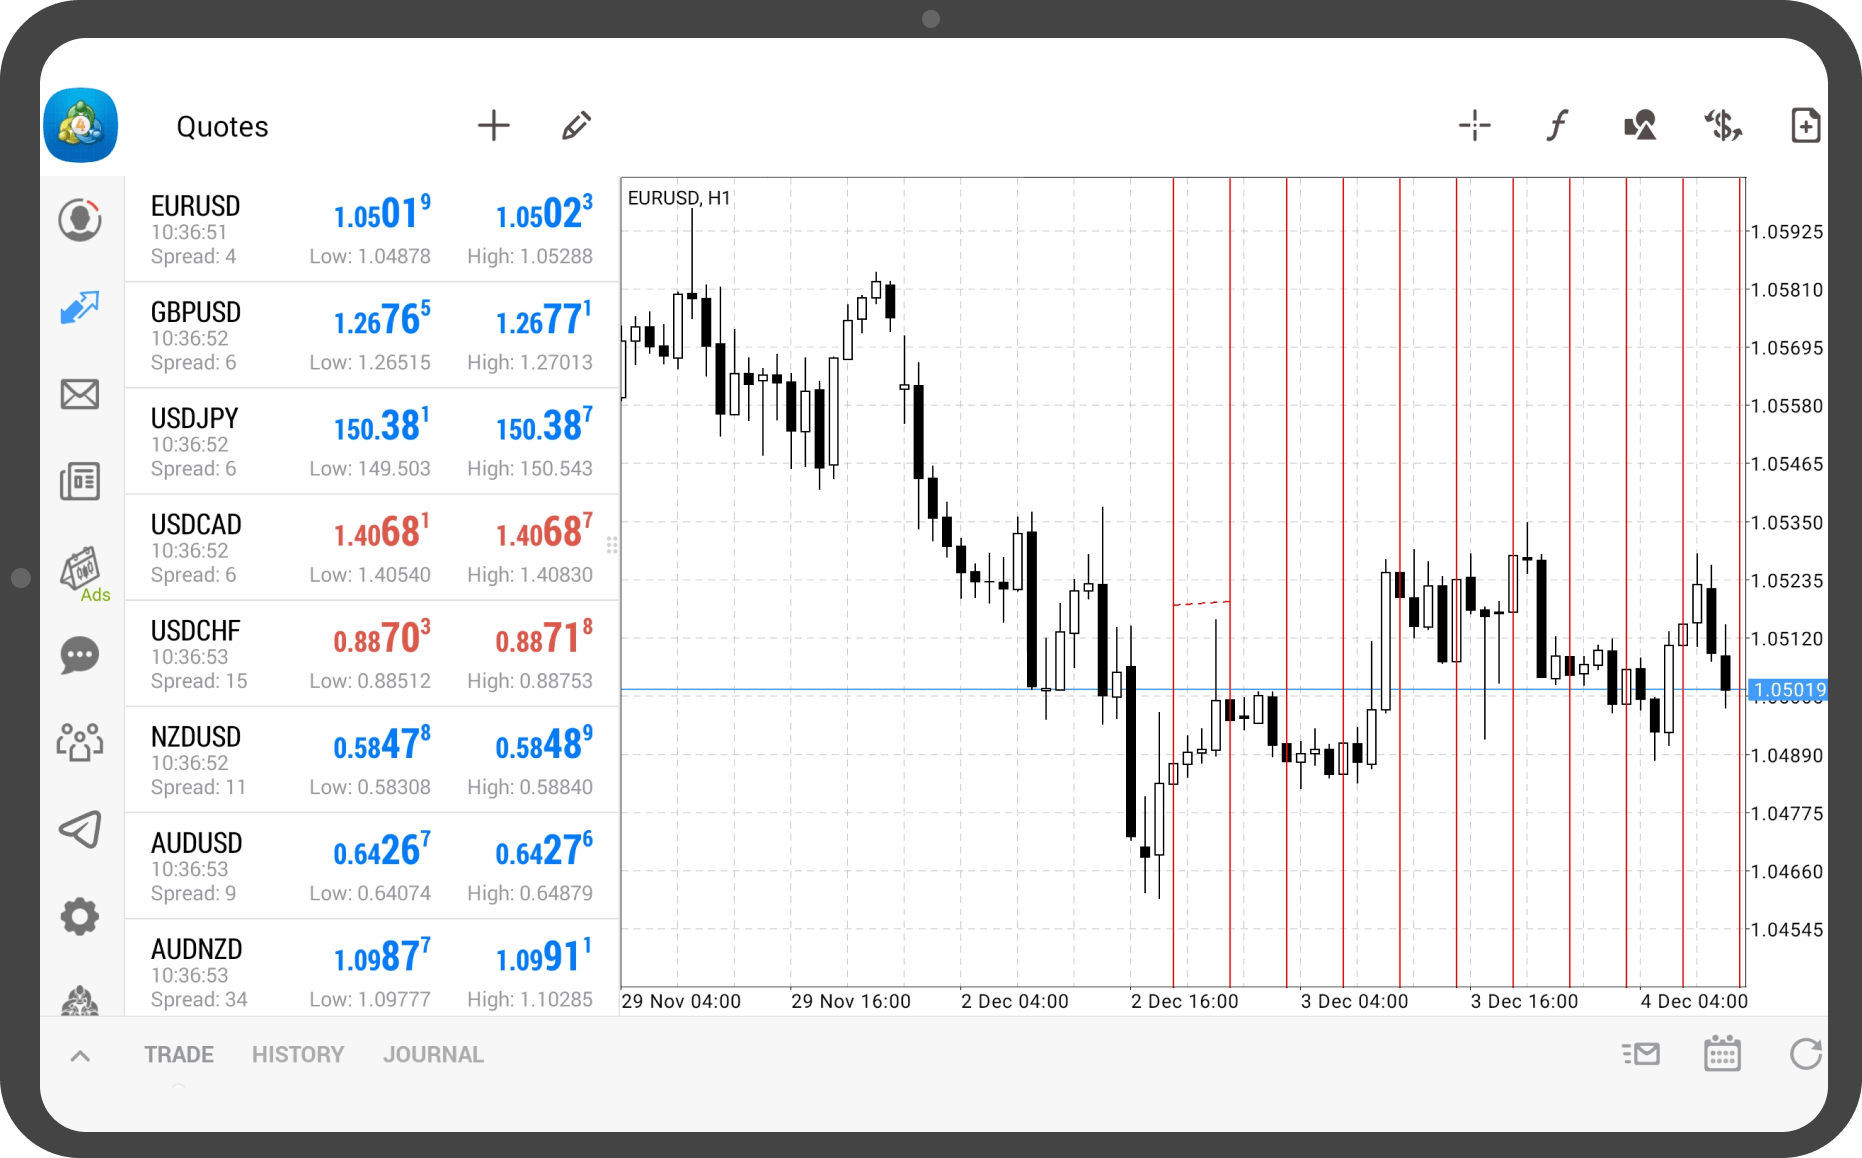
iPhone
*Scroll horizontally to see more*Swipe horizontally to see more
Step 1
Tap "Chart" on the bottom navigation bar.
Step 2
Tap the "Objects" icon at the top.
Step 3
Tap "Add Object".
Step 4
Tap "Cycle Lines".
Step 5
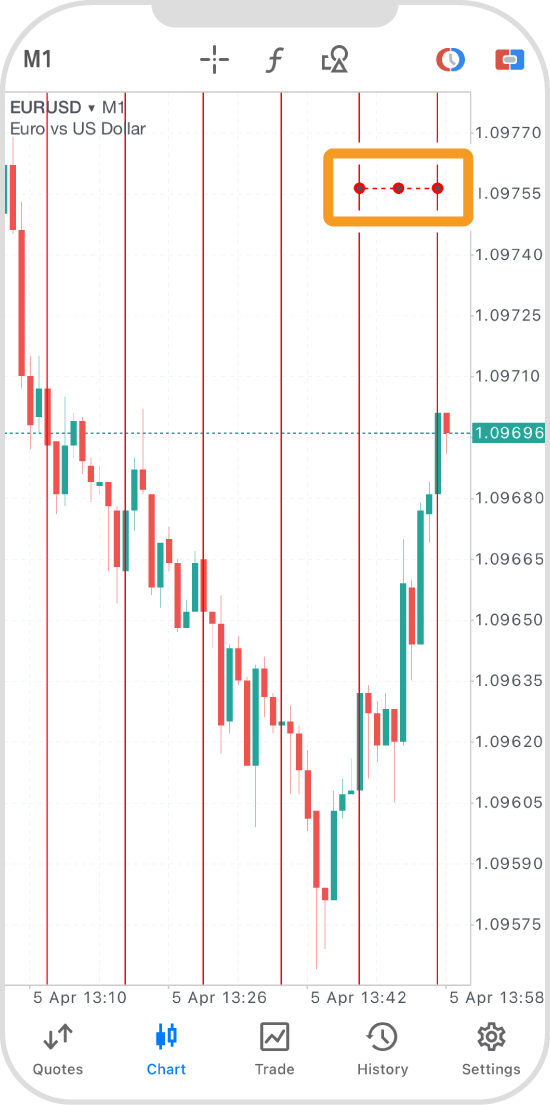
Tap the starting point, adjust the cycle interval, and drag to the end point.
Step 6
In the menu that appears after swiping, you can also change the line's color, thickness, and style.
Step 7
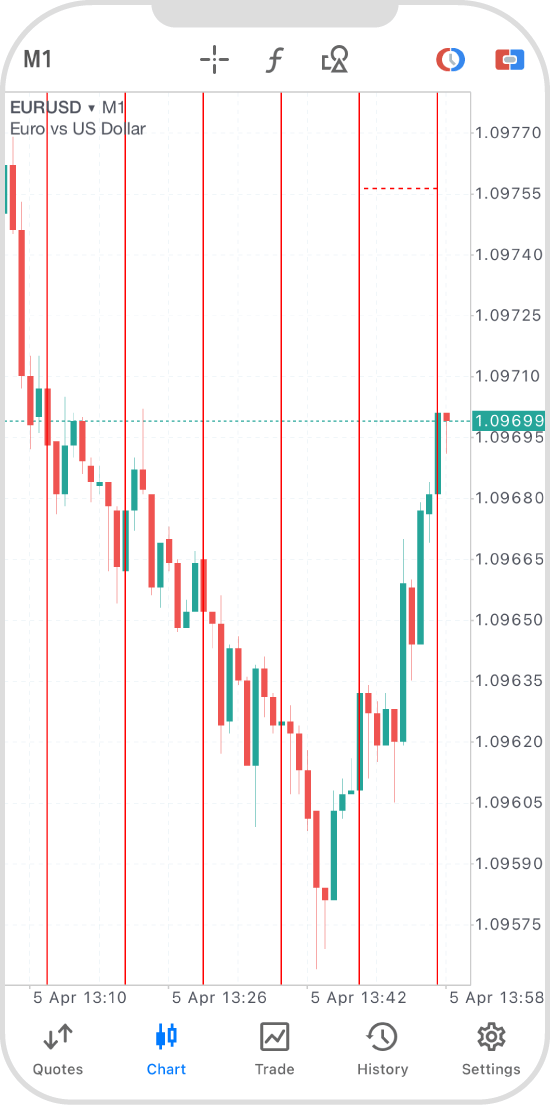
To fix the cycle lines, tap on the line to hide the dots.
Android
*Scroll horizontally to see more*Swipe horizontally to see more
Step 1
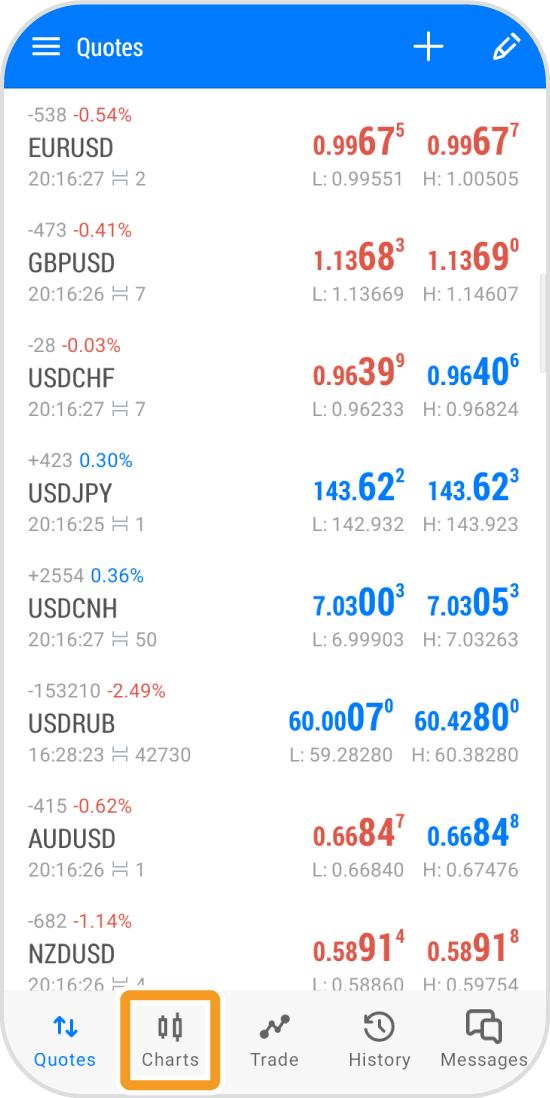
Tap "Charts" on the bottom navigation bar.
Step 2
Tap on the chart.
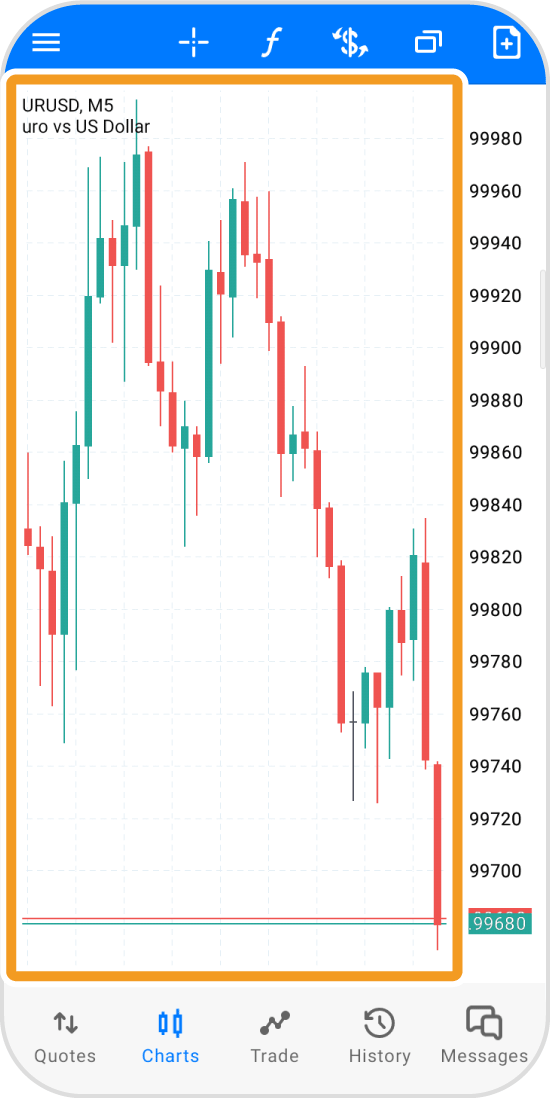
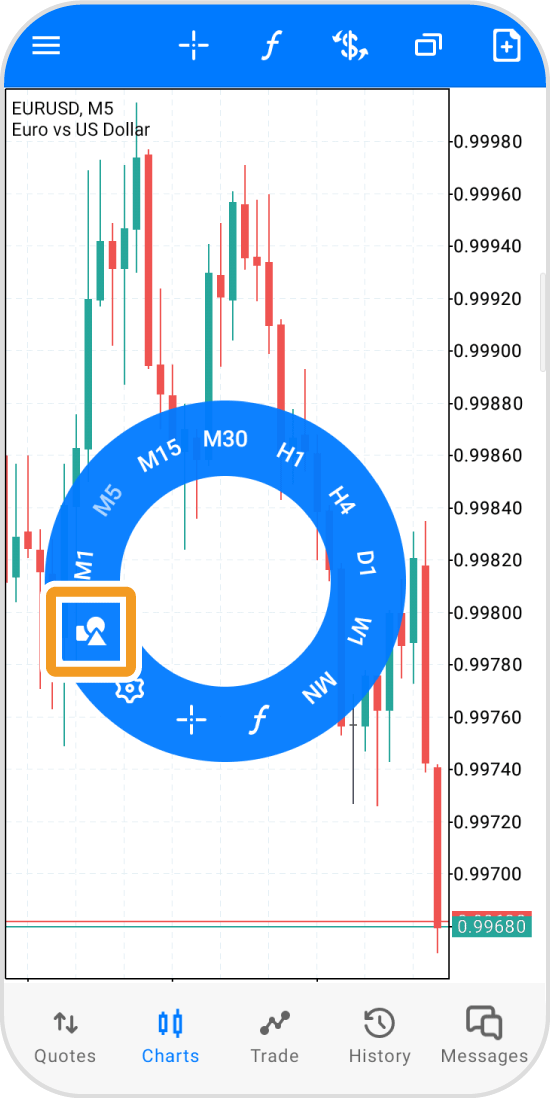
Step 3
Tap the "Objects" icon.
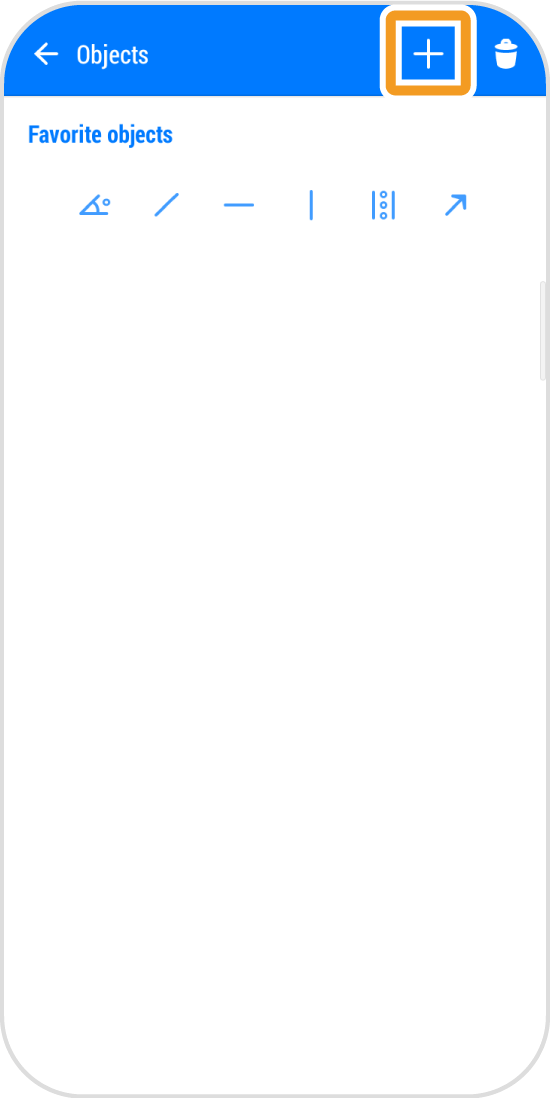
Step 4
Tap "+" in the top right corner.
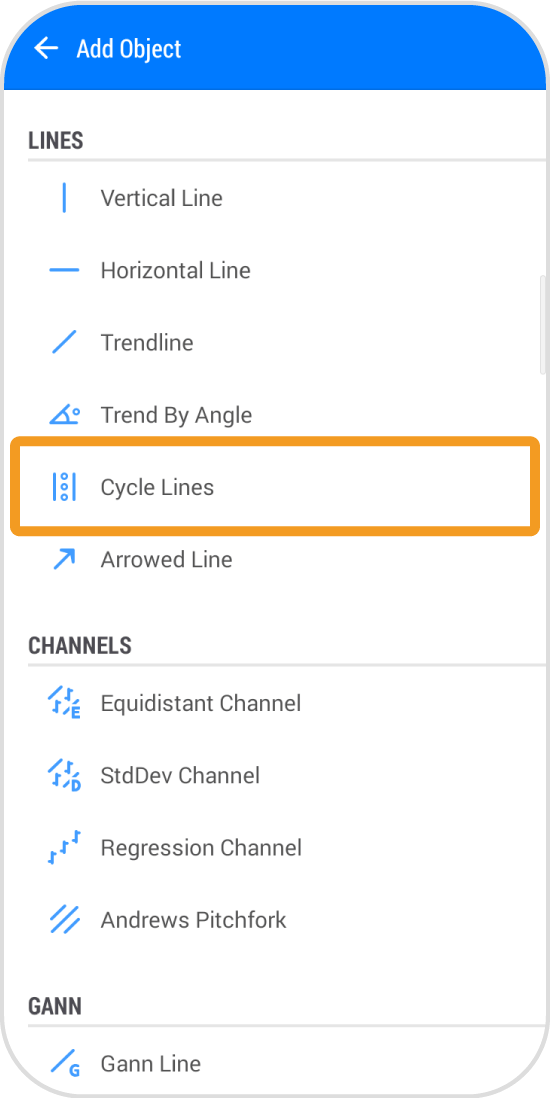
Step 5
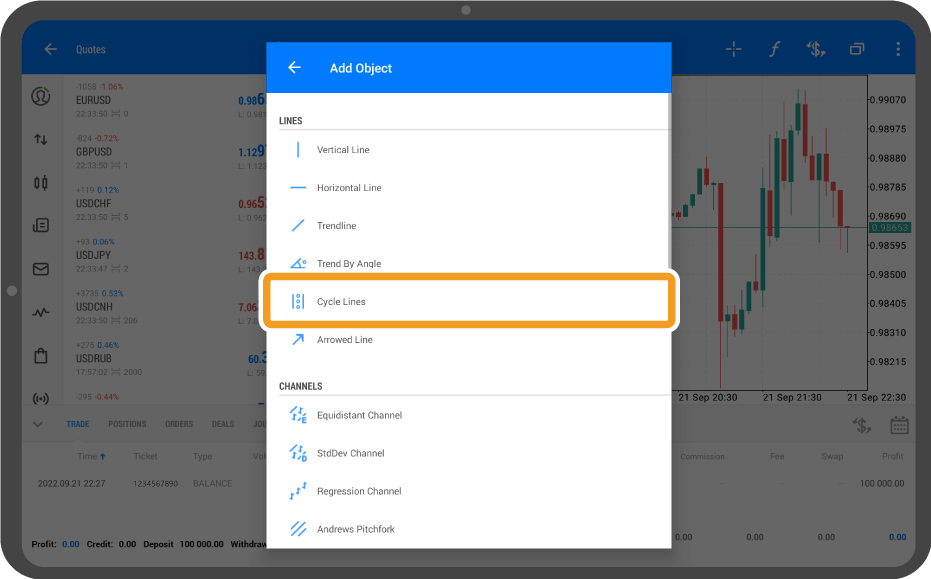
Tap "Cycle Lines".
Step 6
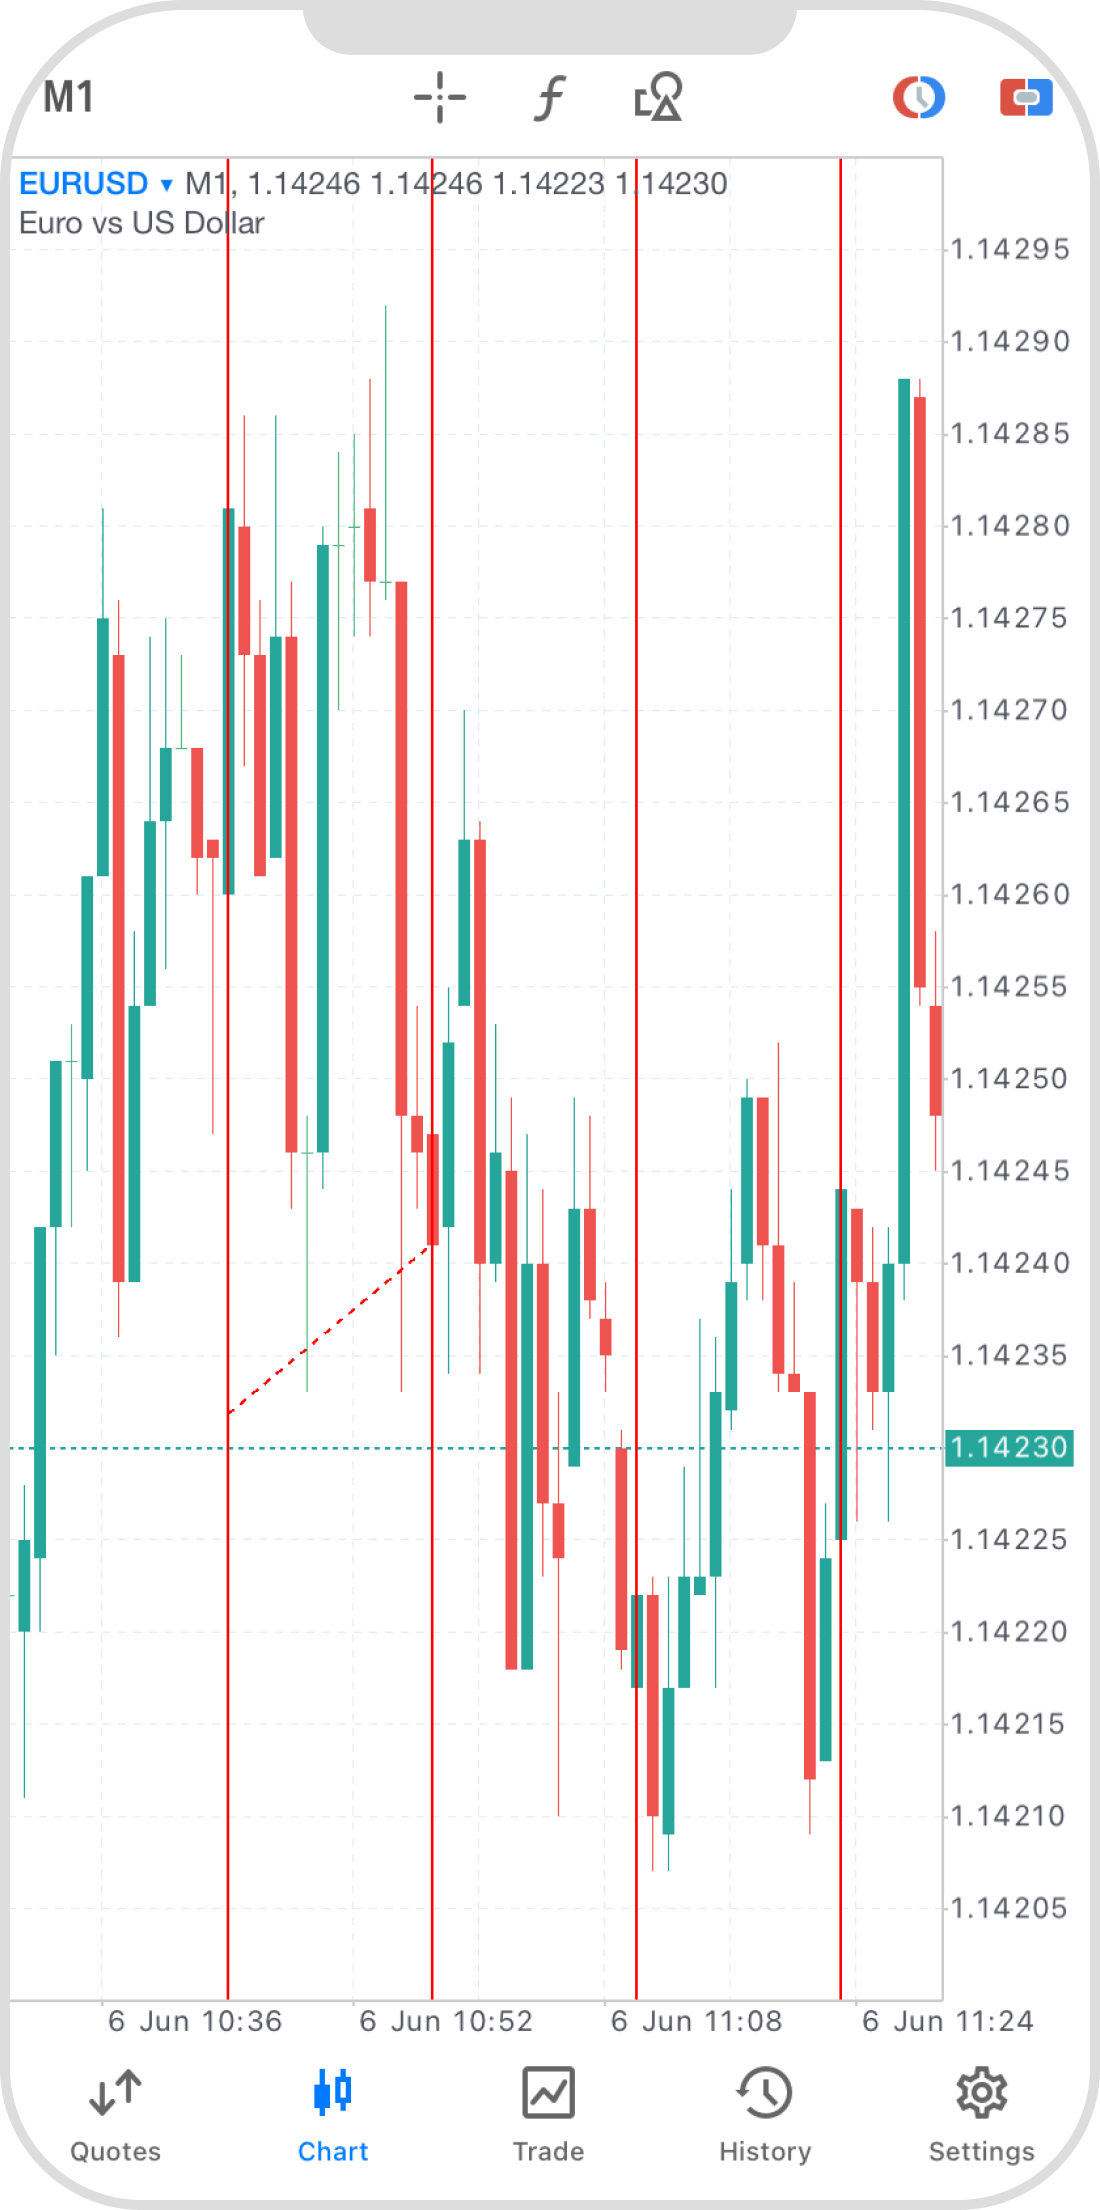
Tap the starting point and swipe to the endpoint of a cycle.
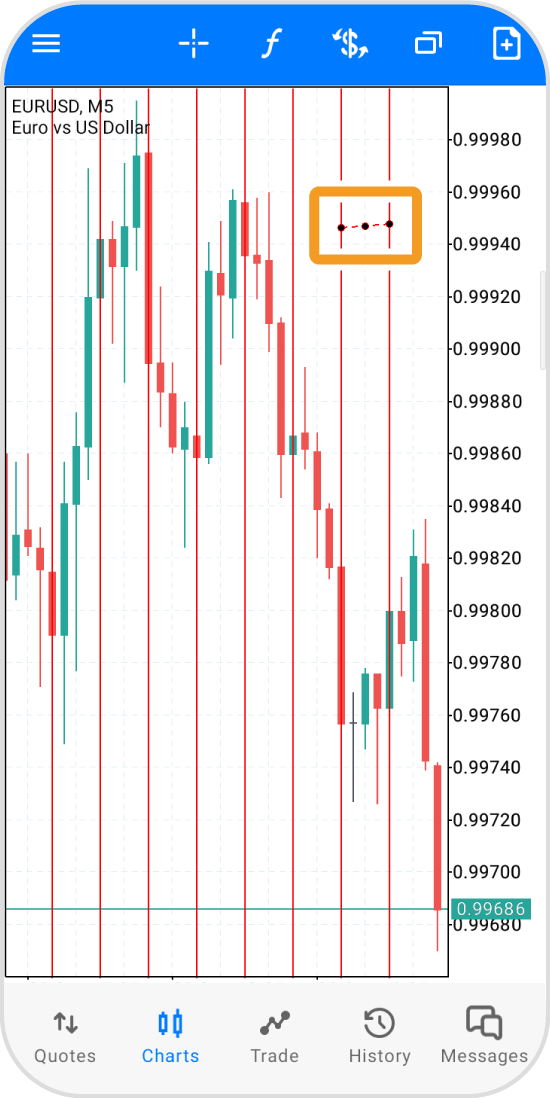
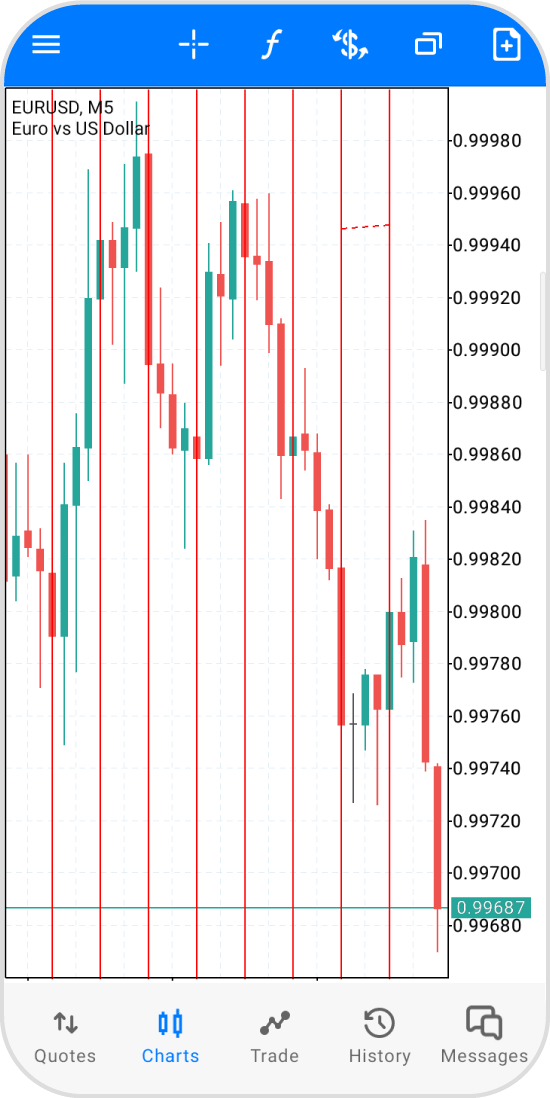
Step 7
To fix the cycle line, double-tap around the line with three black dots to hide them.
iPad
*Scroll horizontally to see more*Swipe horizontally to see more
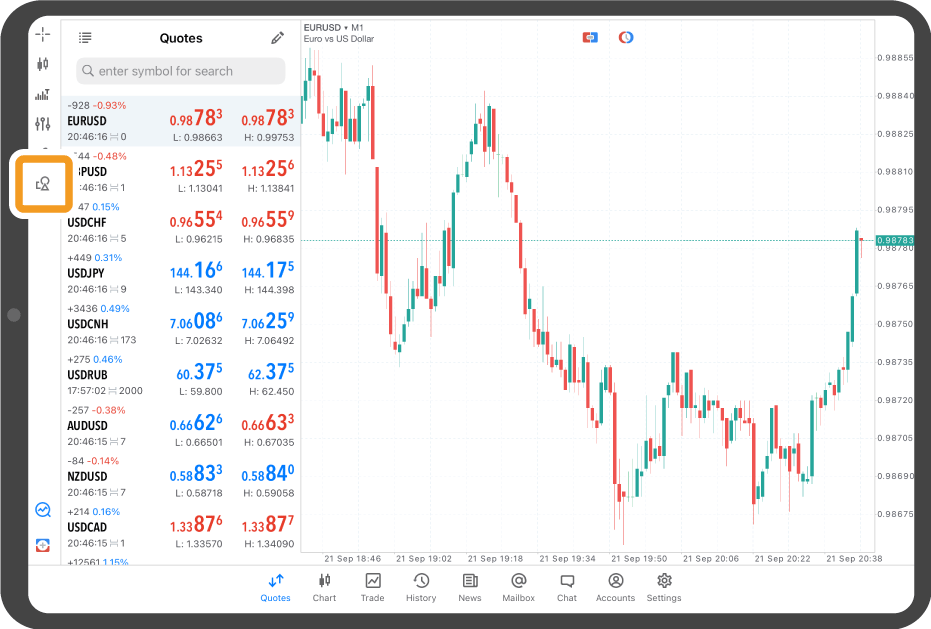
Step 1
Tap the "Objects" icon on the left.
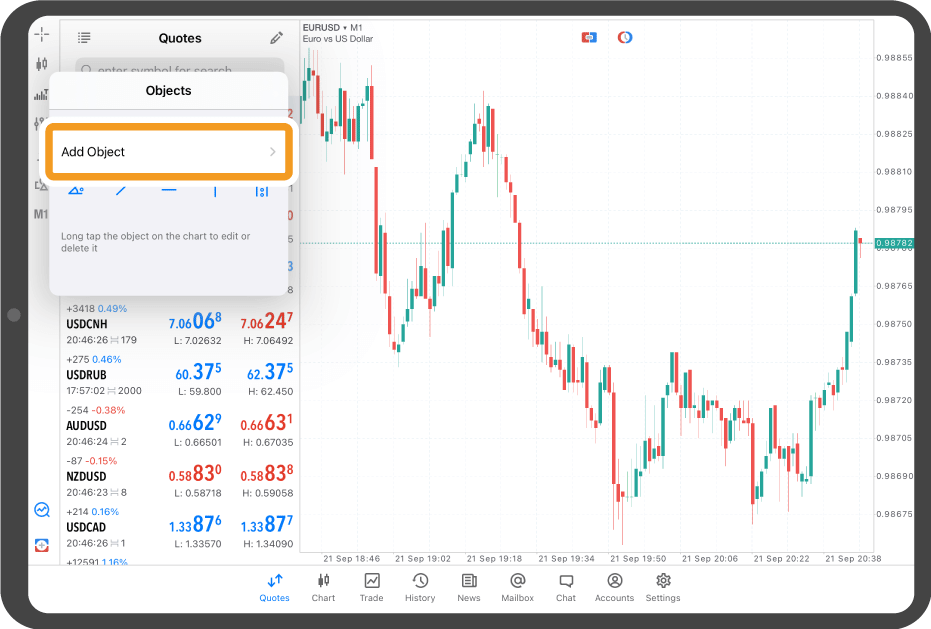
Step 2
Tap "Add Object".
Step 3
Tap "Cycle Lines".
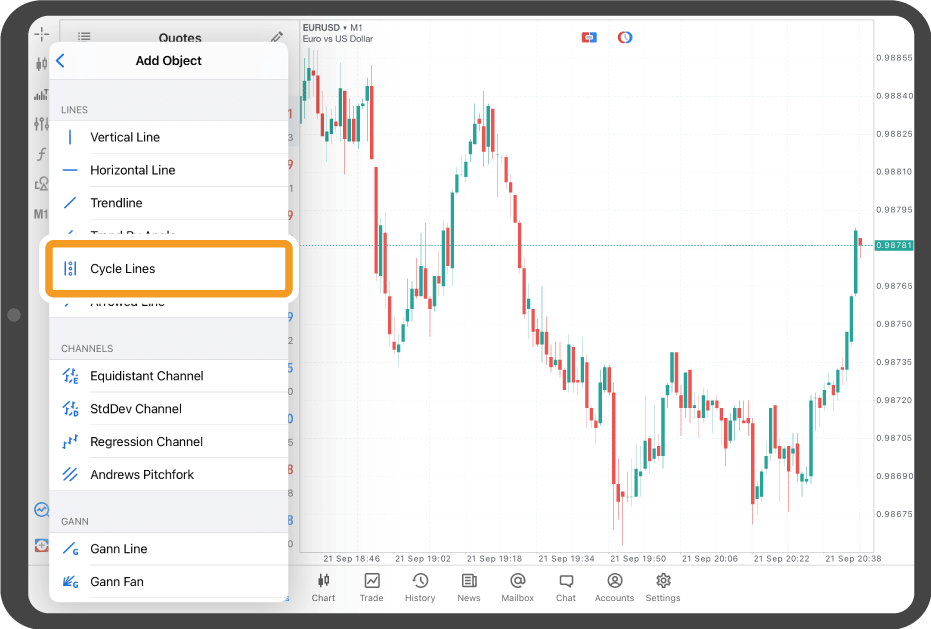
Step 4
Tap the starting point and swipe to the endpoint of a cycle.
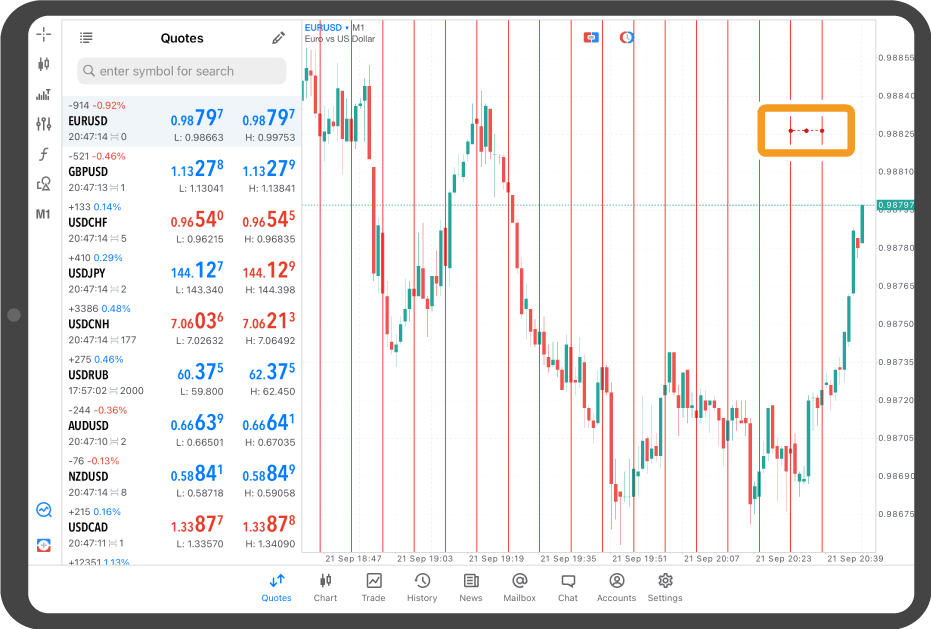
Step 5
In the menu that appears after swiping, you can also change the line's color, thickness, and style.
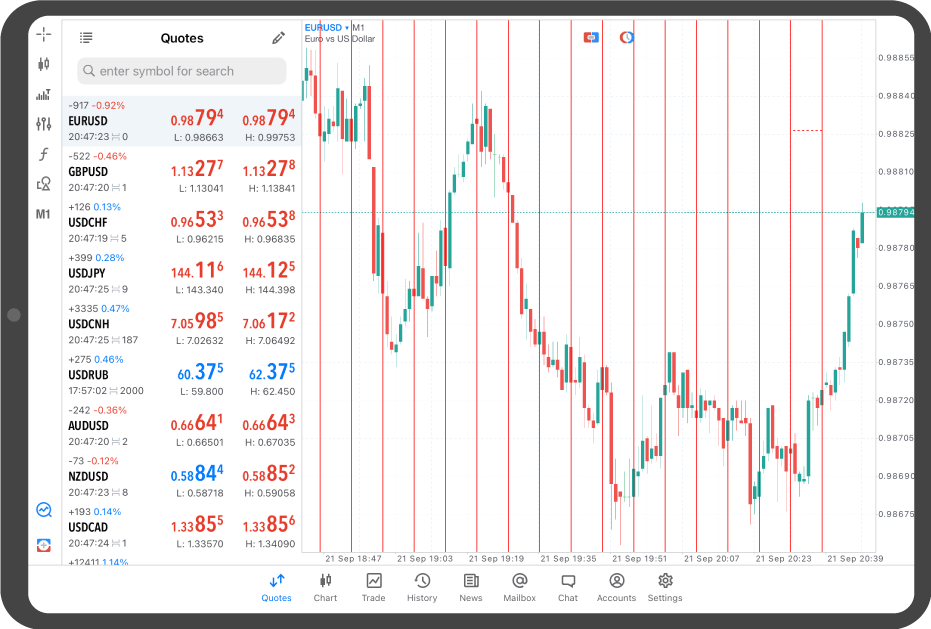
Step 6
To fix the cycle line, tap around the line with three red dots to hide them.
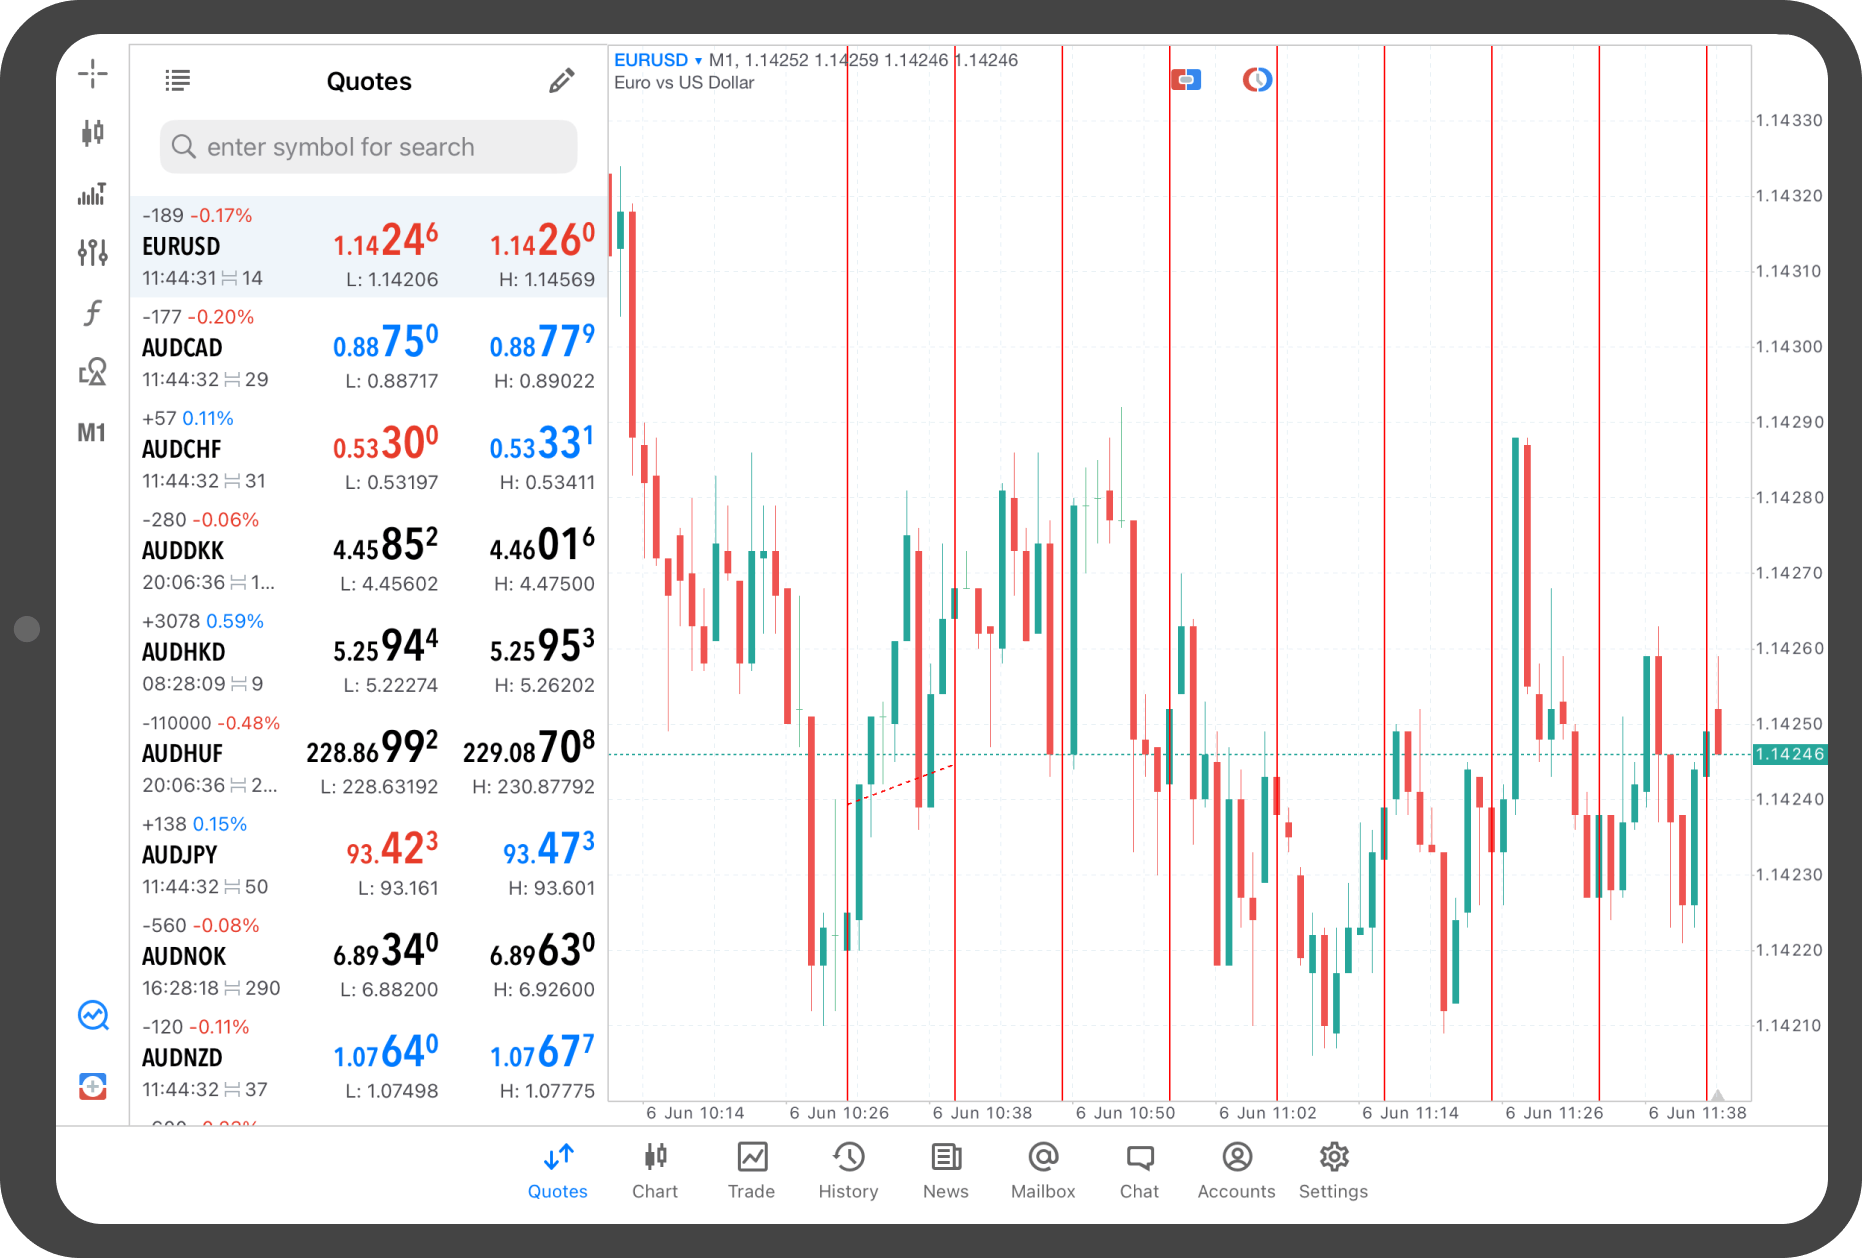
Android tablet
*Scroll horizontally to see more*Swipe horizontally to see more
Step 1
Tap on the chart.
Step 2
Tap the "Objects" icon.
Step 3
Tap "+" in the top right corner.
Step 4
Tap "Cycle Lines".
Step 5
Tap the starting point and swipe to the endpoint of a cycle.
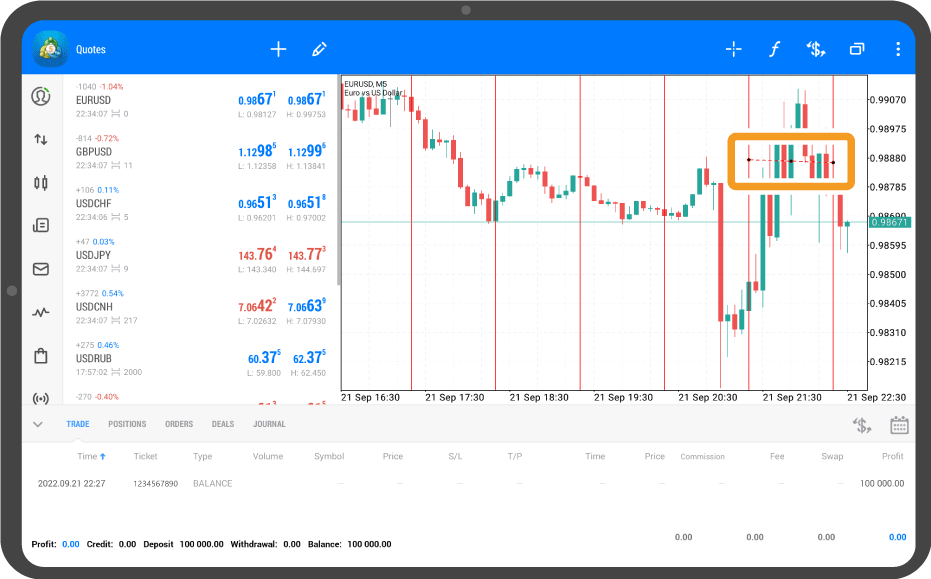
Step 6
To fix the cycle line, double-tap around the line with three black dots to hide them.
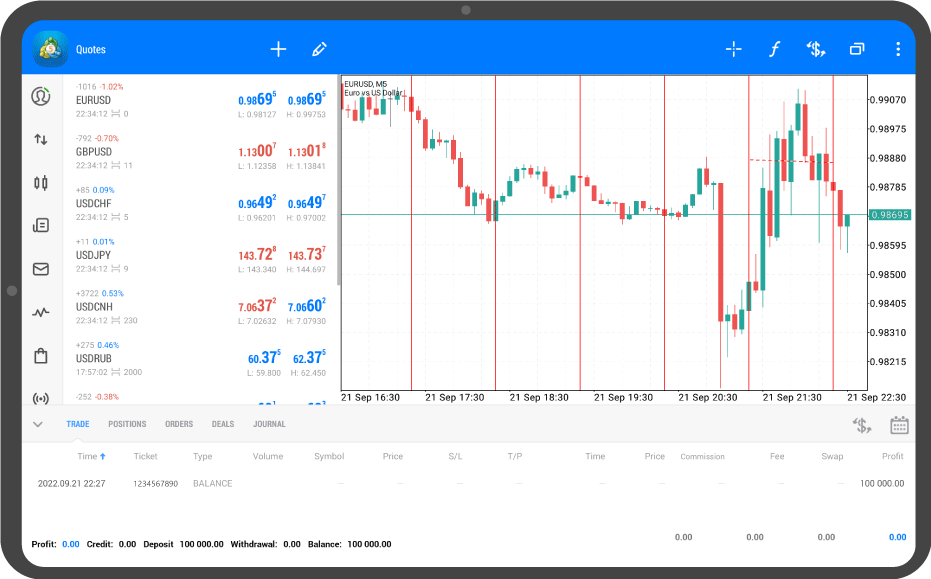
Was this article helpful?
0 out of 0 people found this article helpful.
Thank you for your feedback.
FXON uses cookies to enhance the functionality of the website and your experience on it. This website may also use cookies from third parties (advertisers, log analyzers, etc.) for the purpose of tracking your activities. Cookie Policy
