


MT4/MT5: Add space on the right side of chart
Charts (PC)
Charts (PC)

This article was :
published
updated
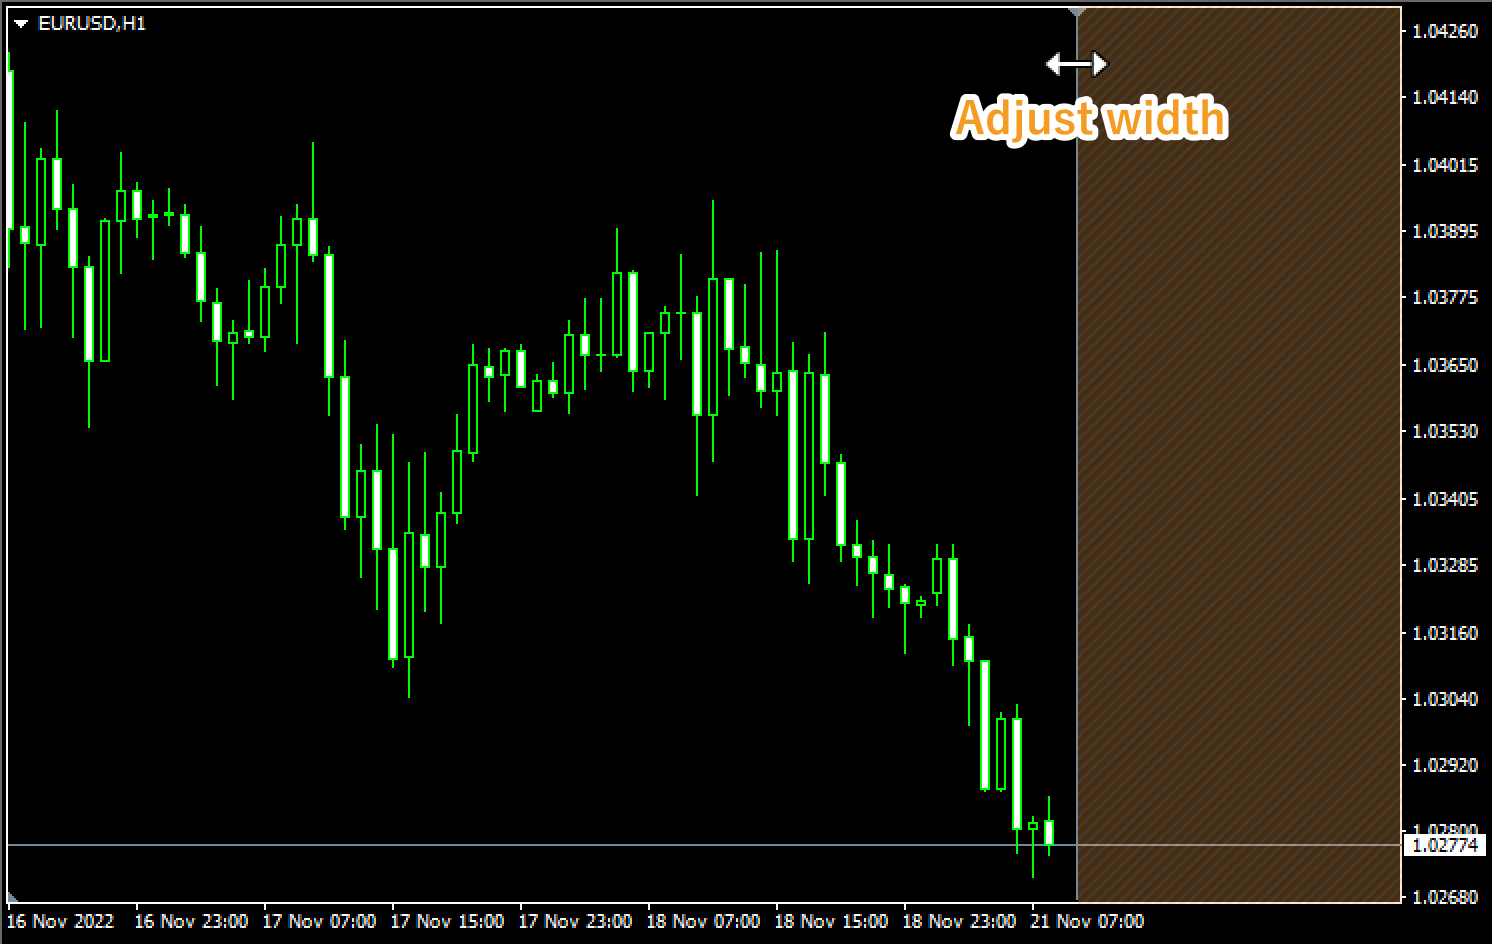
On MetaTrader4 (MT4) / MetaTrader5 (MT5), the chart takes up the entire chart screen by default but you can add a space on the right side of the chart screen if you wish. You can adjust the width and place objects in the open space.
Here we will look at how to add a space on the right side of the chart on MT4/MT5.
Switch between MT4/MT5 tabs to check the steps for each.
You can set the space from the menu, toolbar, and on the chart.
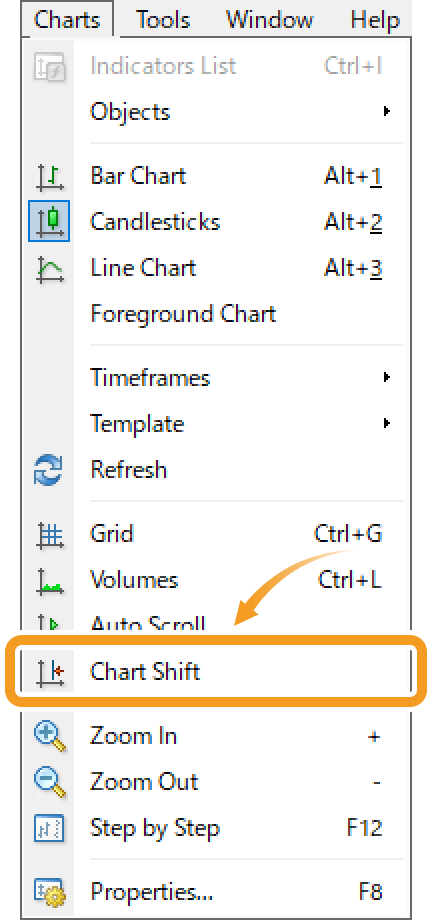
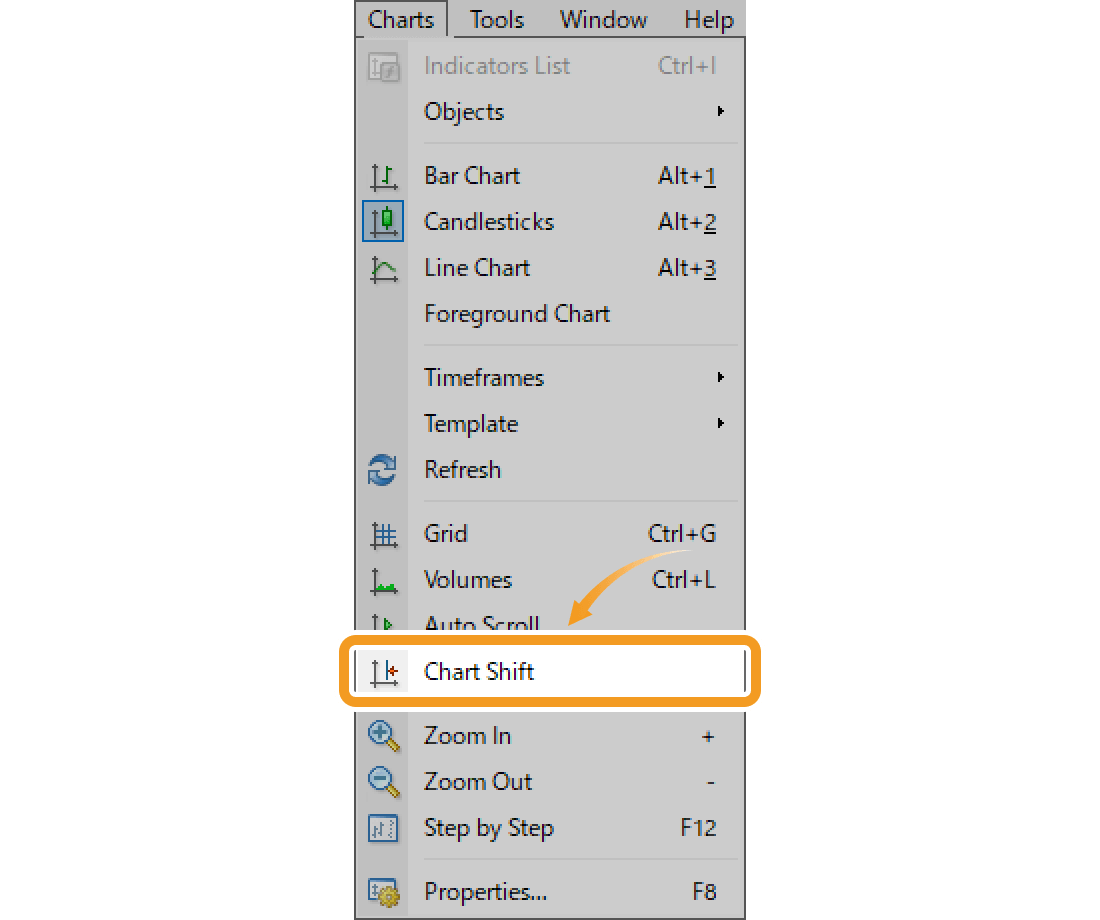
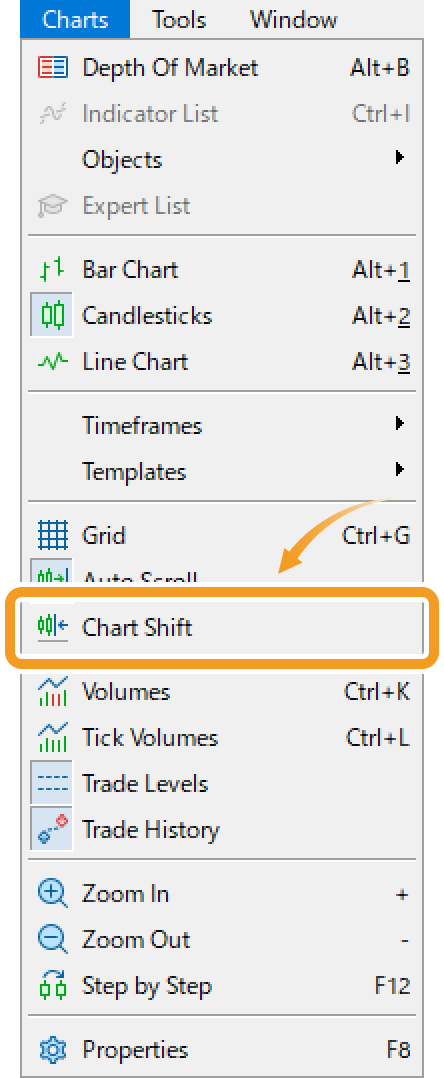
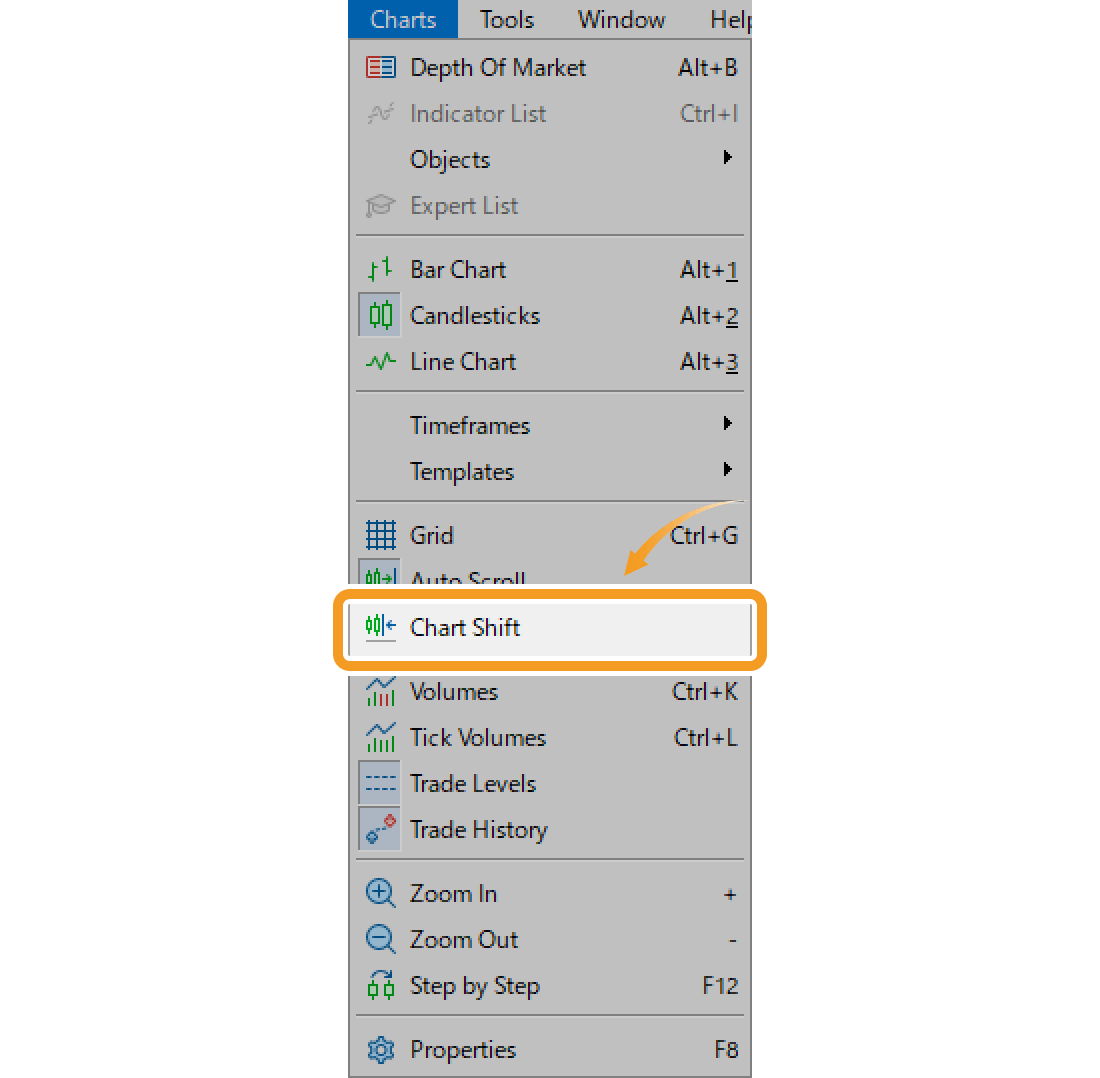
Click "Charts" in the menu and select "Chart Shift".
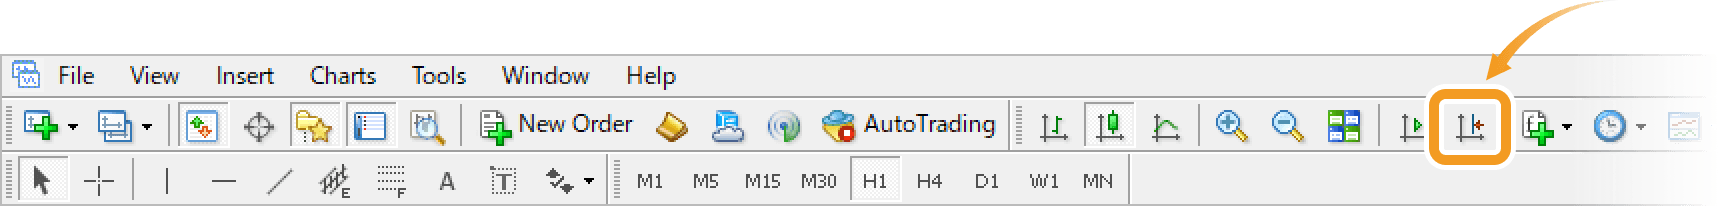
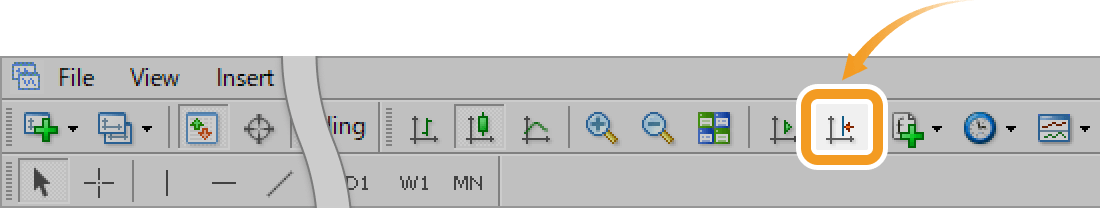
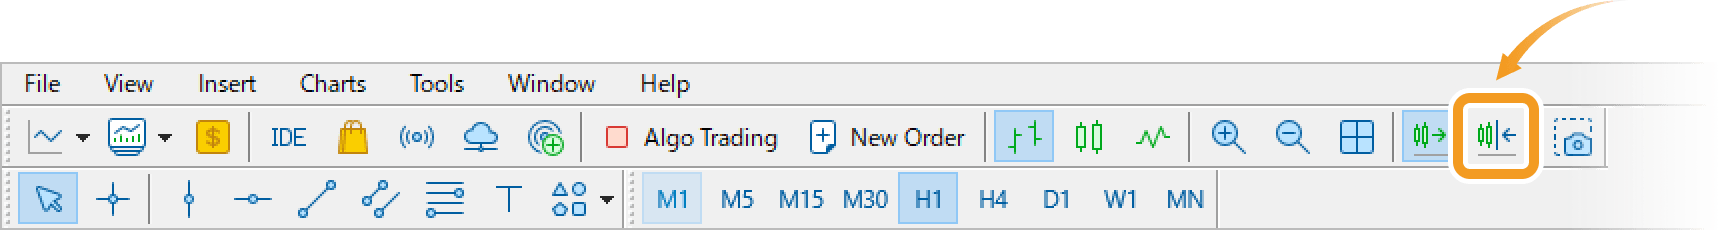
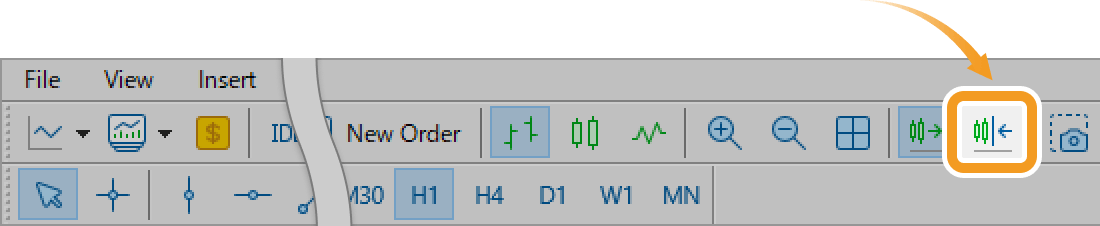
Click "Shift end of the chart from right border" in the toolbar.
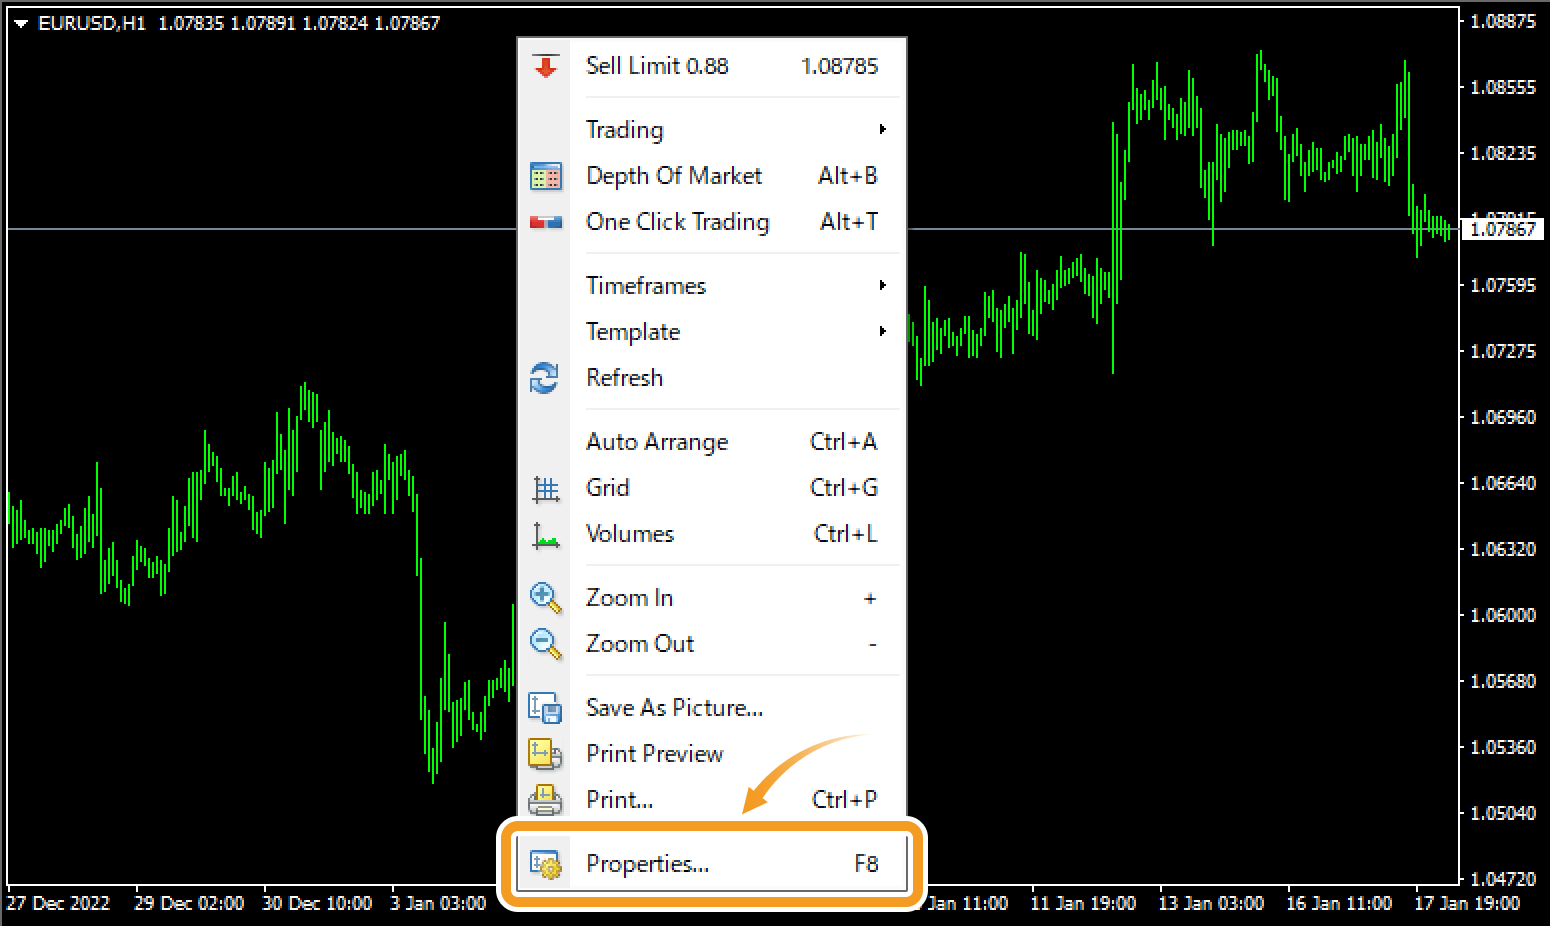
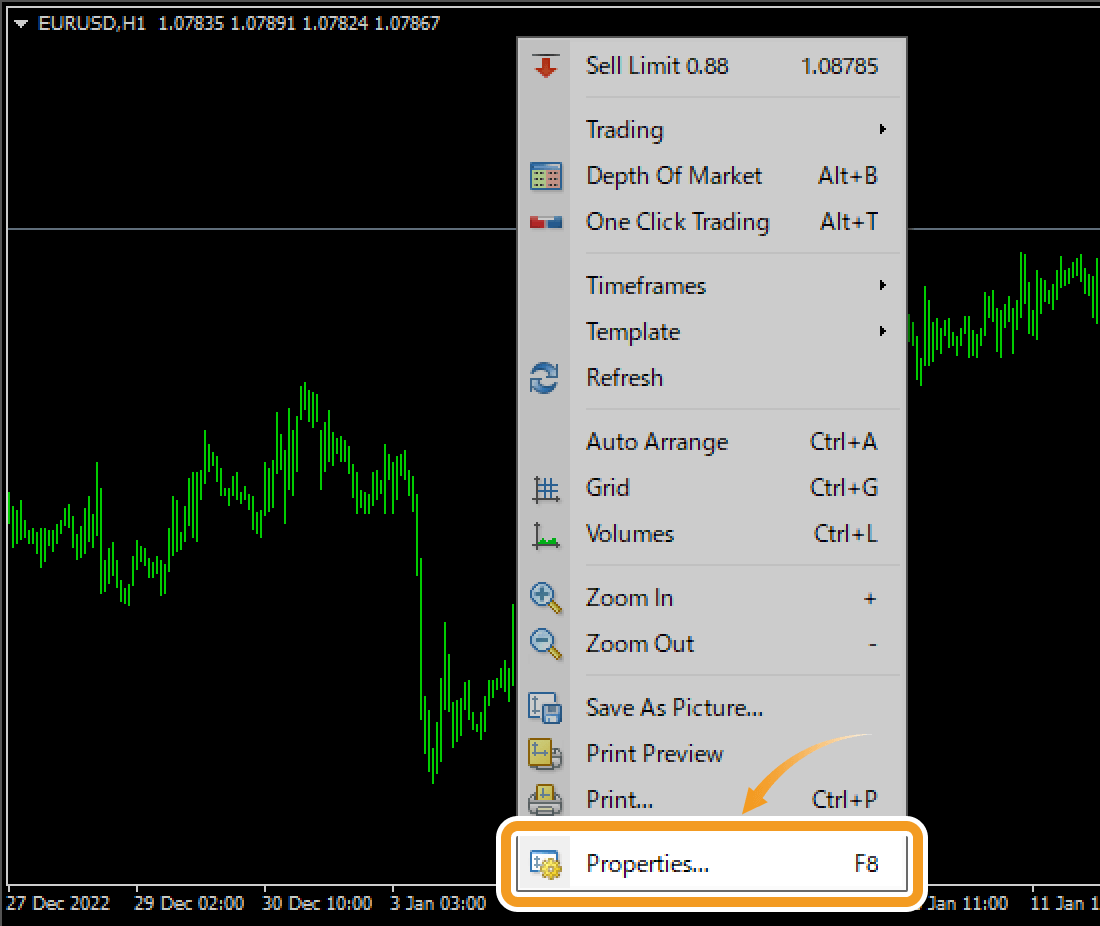
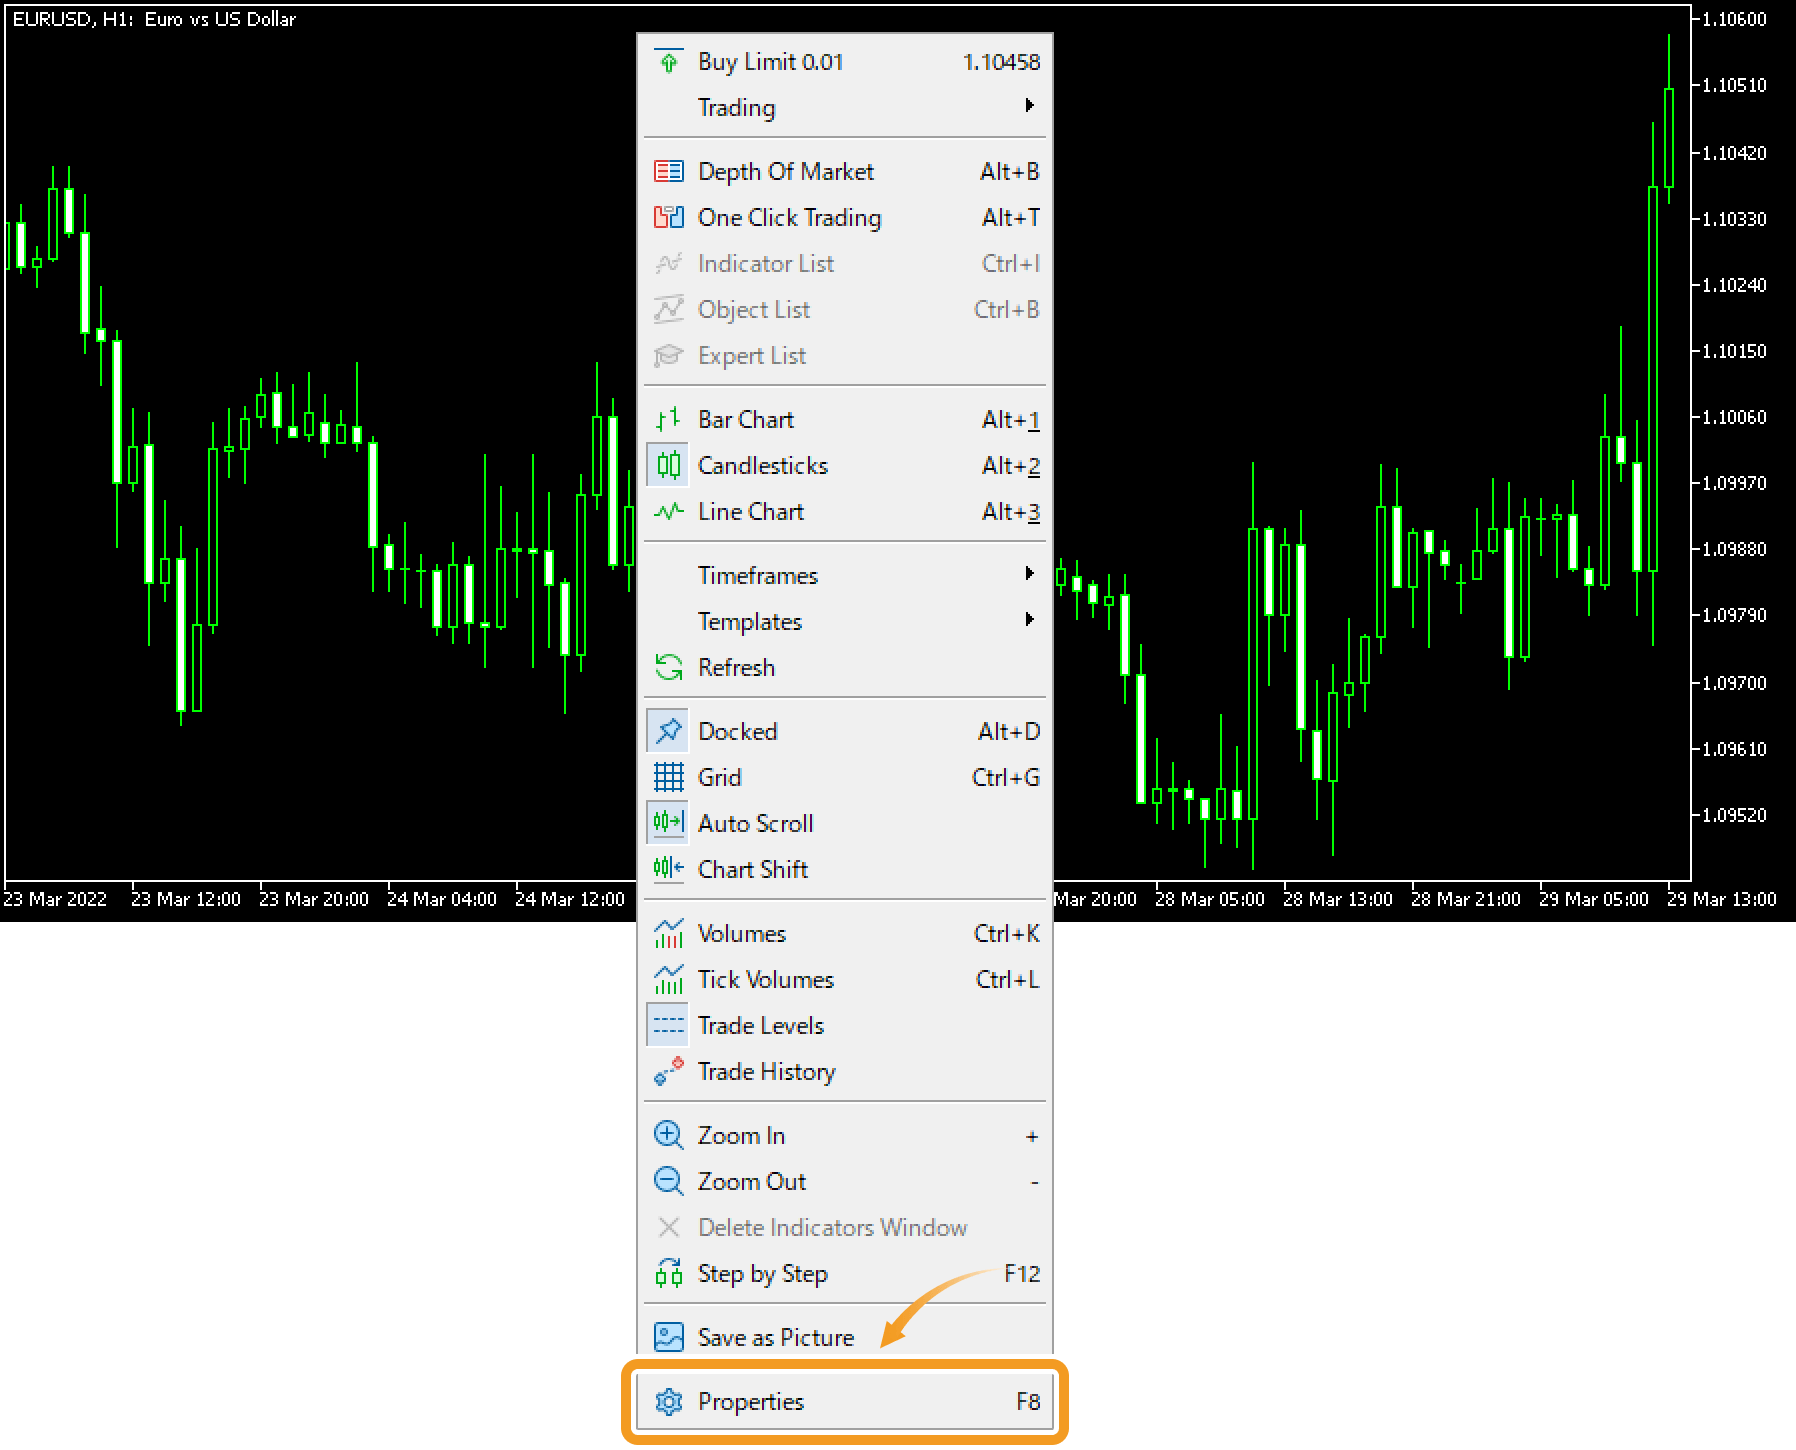
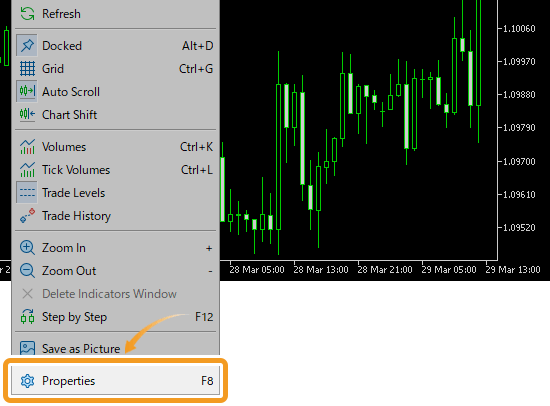
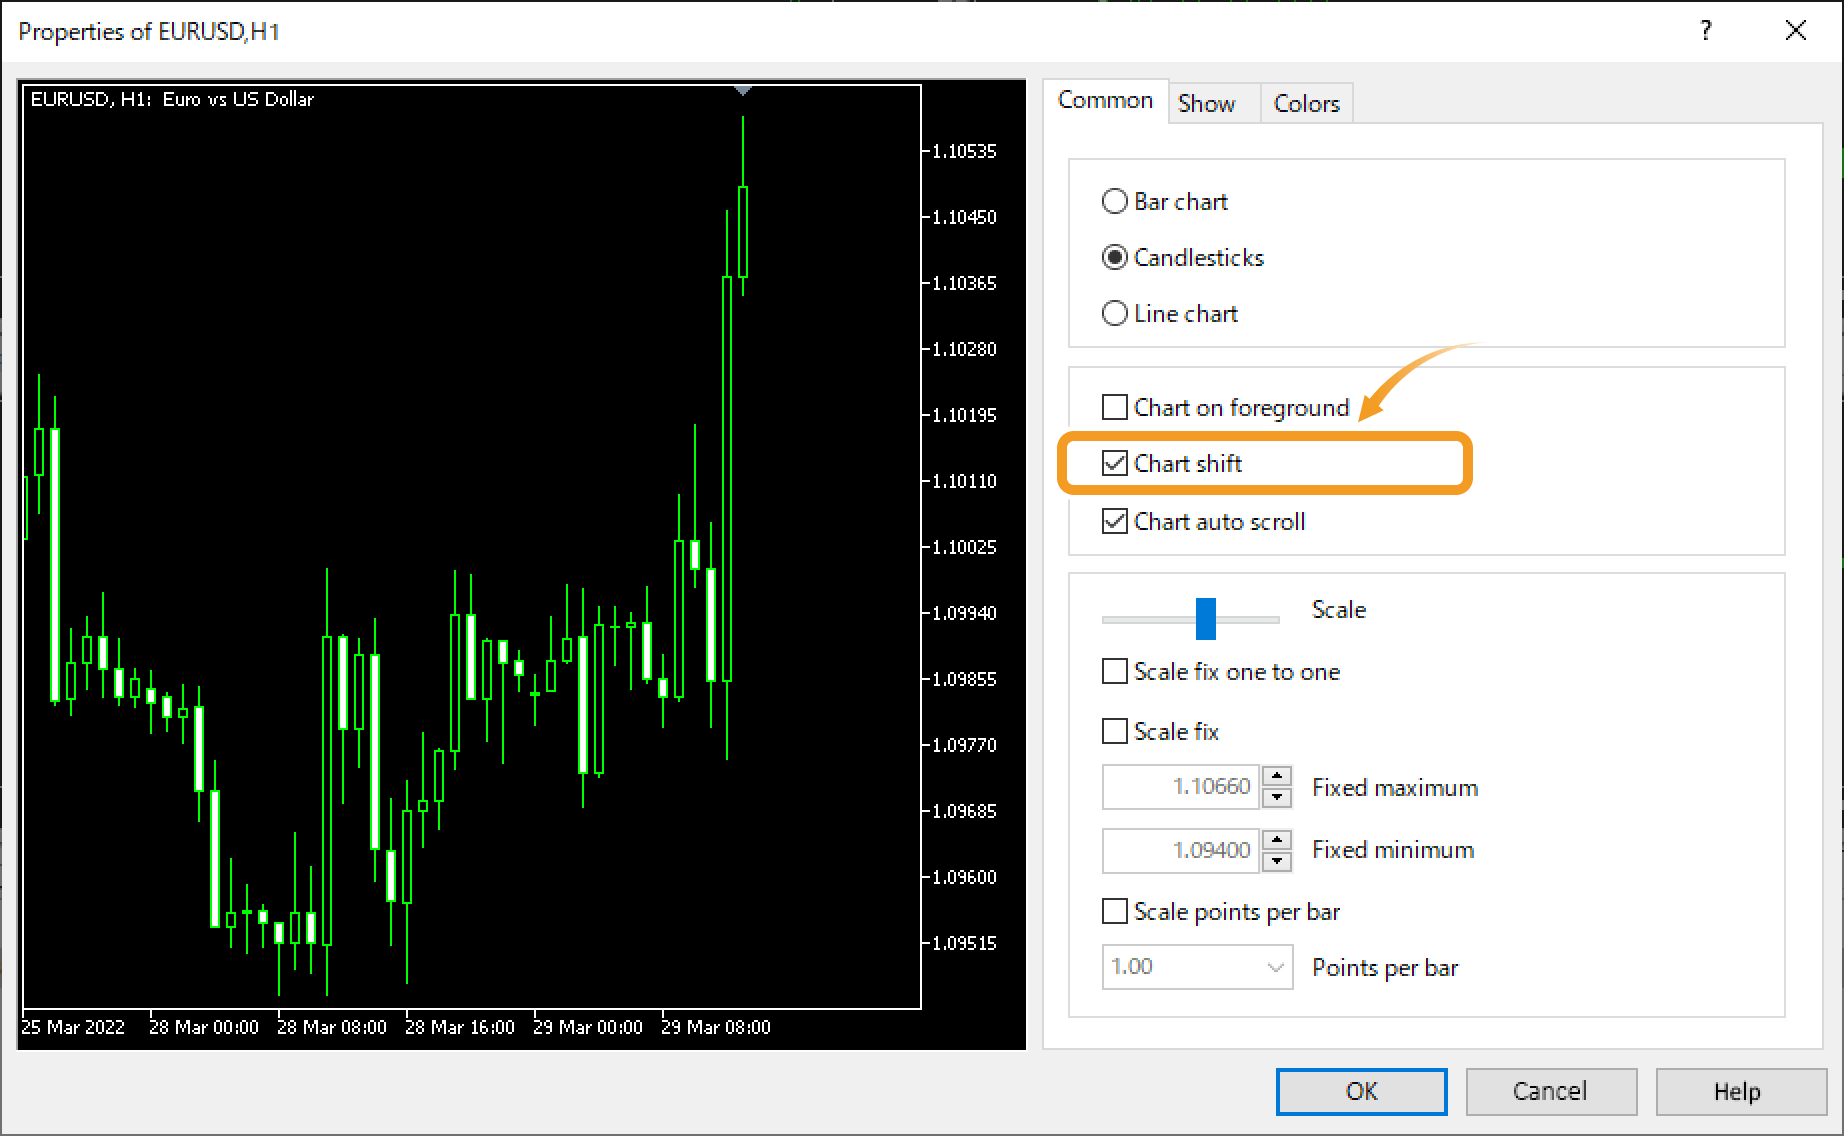
Right-click on the chart and select "Properties".
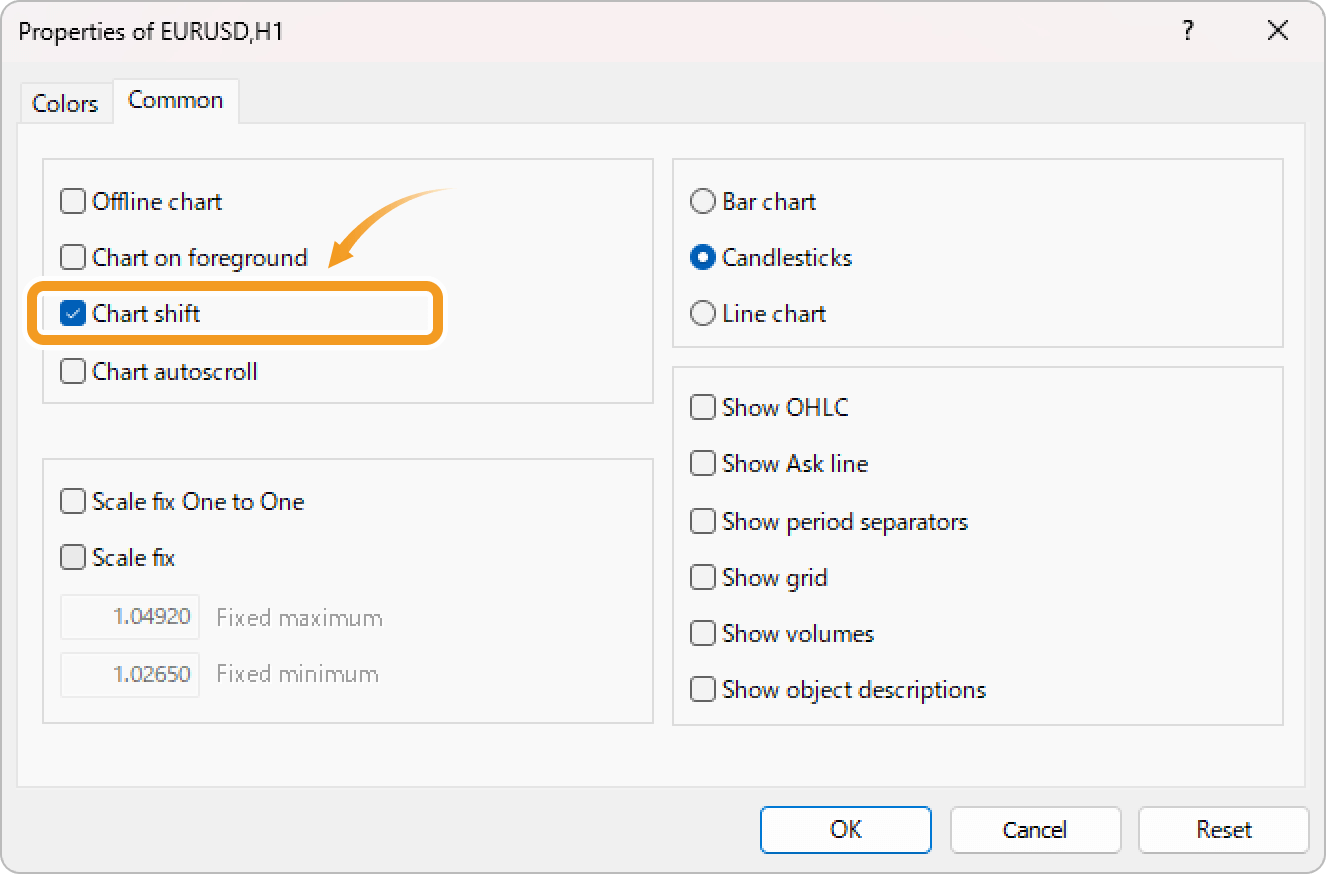
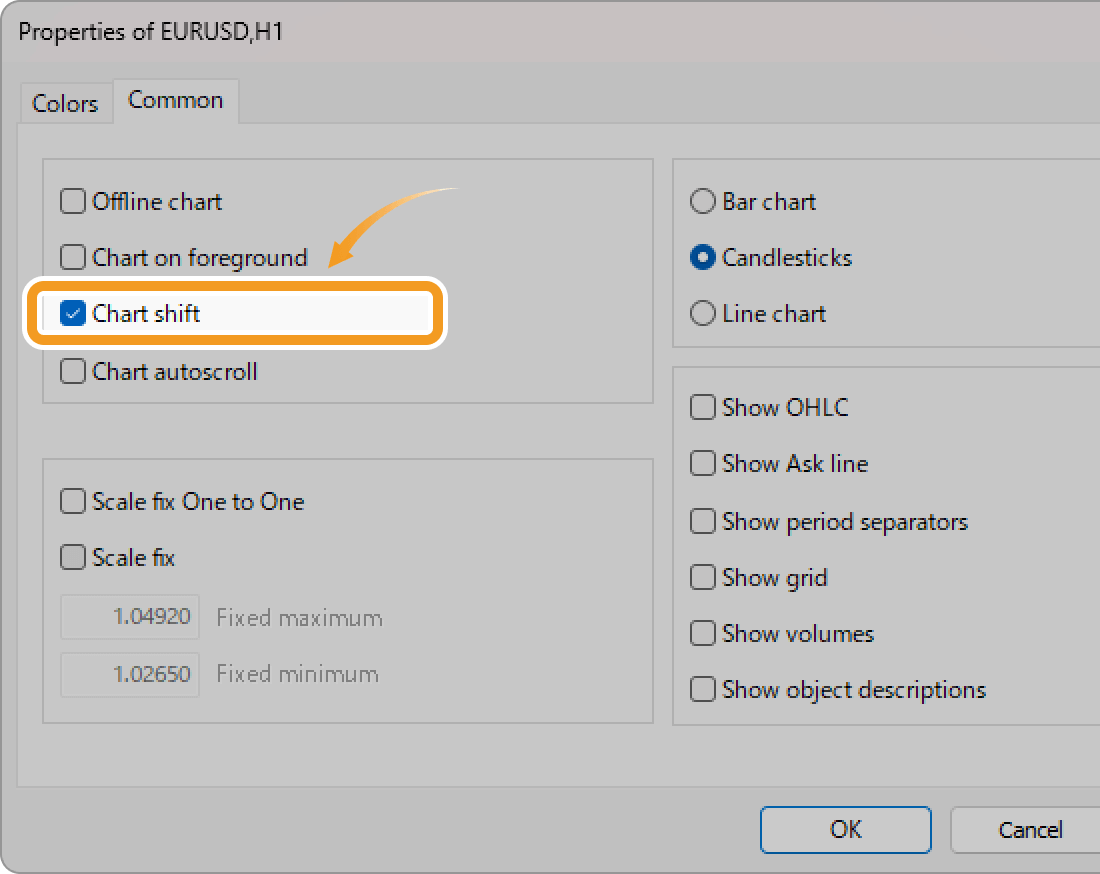
In the "Common" tab, check the "Chart shift" box and click "OK".
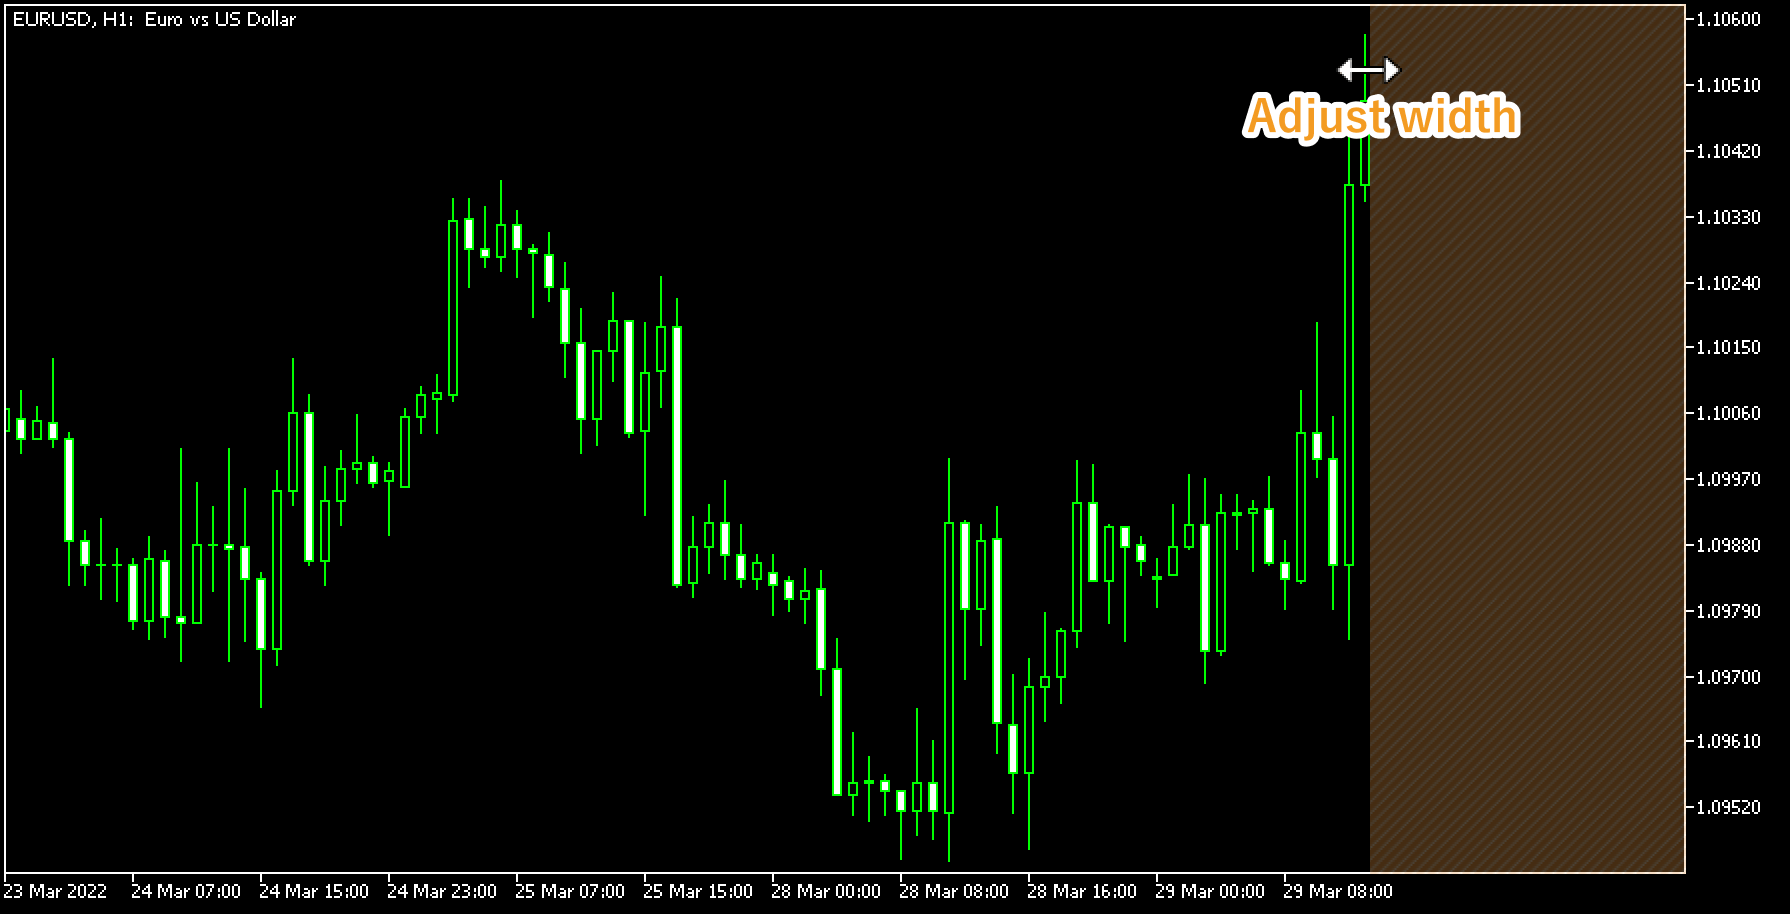
A gray triangle will be displayed on the chart. Click and hold the triangle and you'll see a vertical line. Drag the line left or right to adjust the width. Drag it to the right to make the margin smaller, or to the left to make it bigger.
You can add a space from the menu, toolbar, or chart.
Click "Charts" in the menu and select "Chart Shift".
Click "Shift end of the chart from right border" in the toolbar.
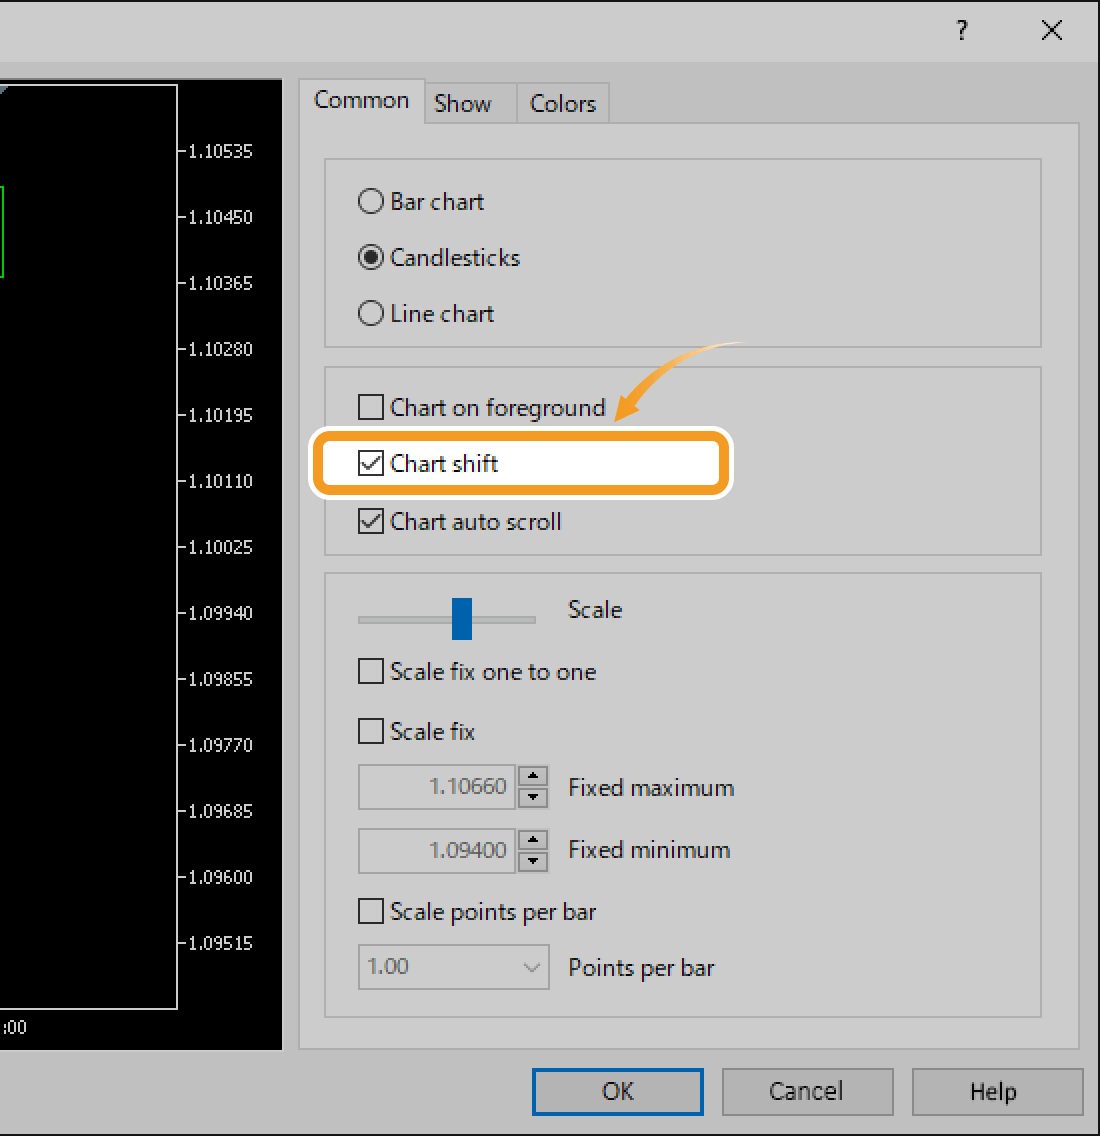
Right-click on the chart and select "Properties".
In the "Common" tab, check the "Chart shift" box and click "OK".
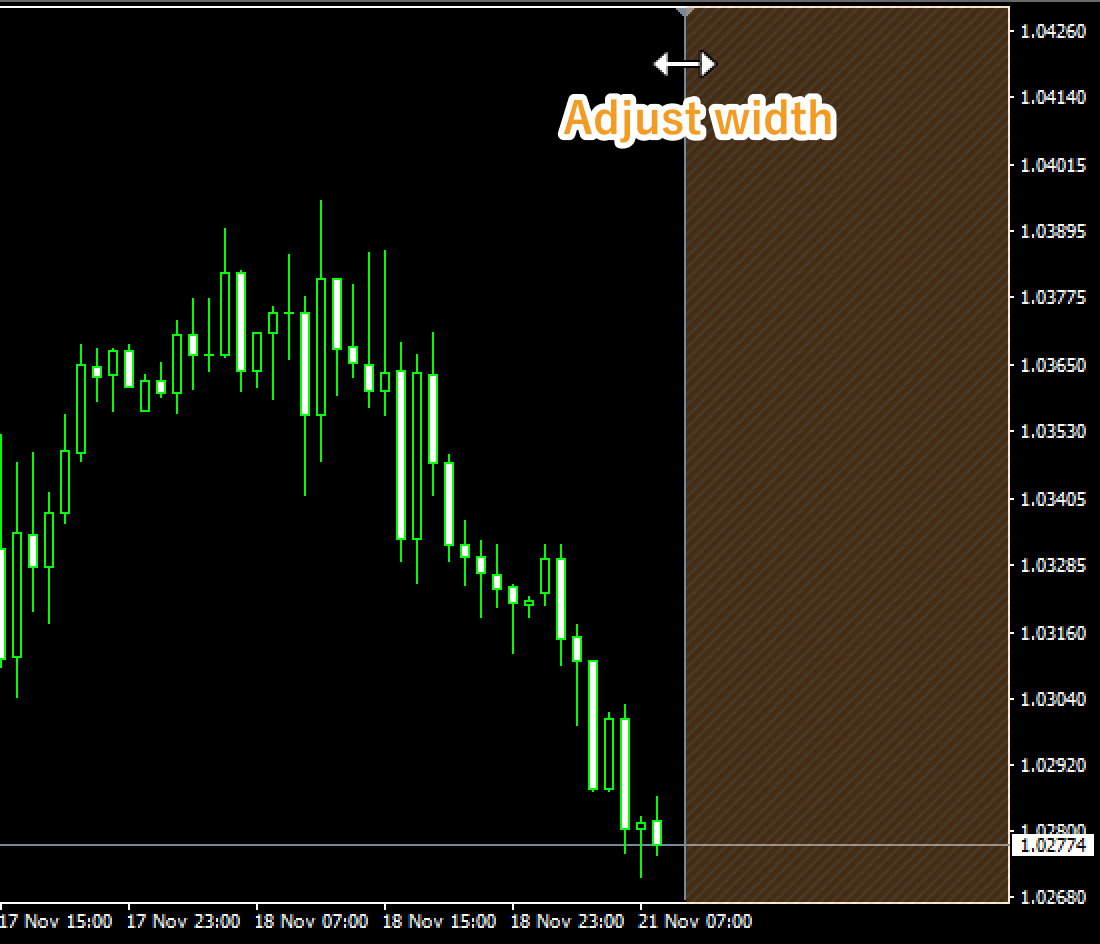
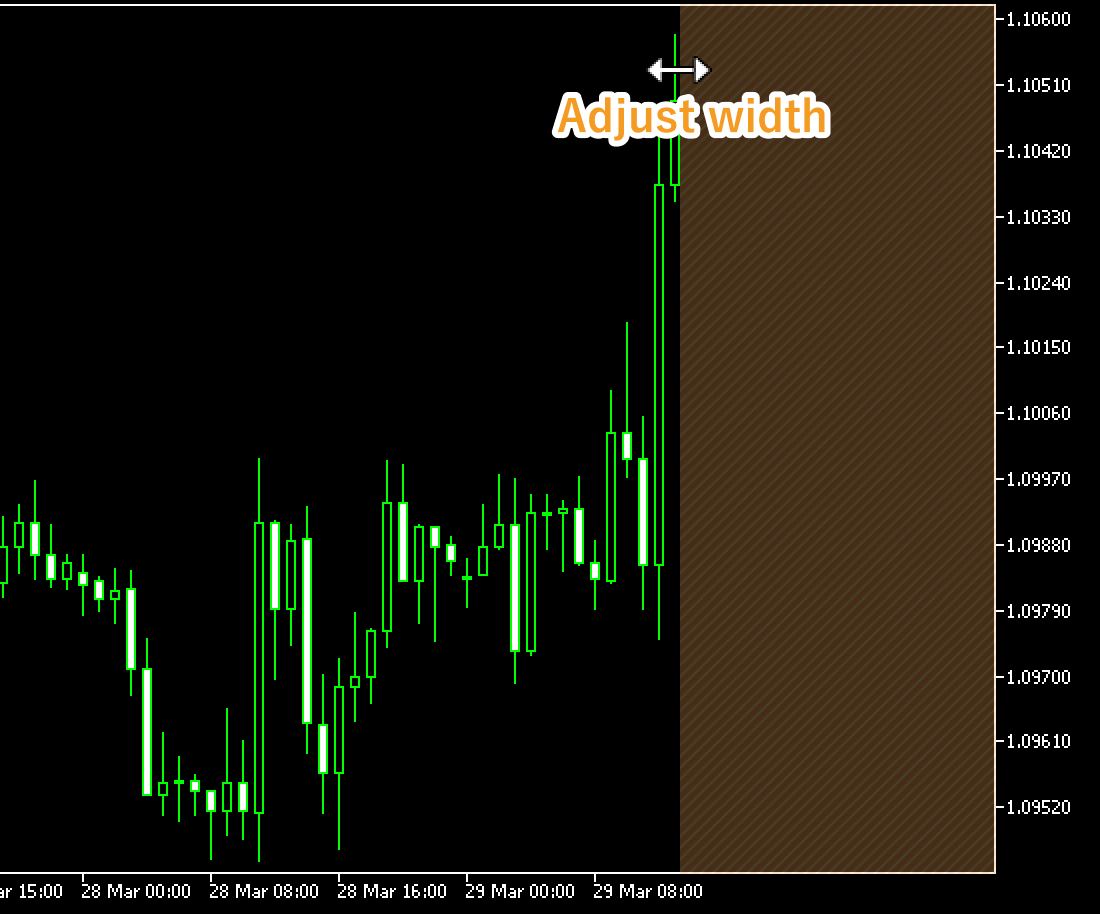
A gray triangle will be displayed on the chart. Click and hold the triangle and you'll see a vertical line and an arrow pointing both left and right. Drag the arrow left and right to adjust the width. Drag it to the right to make the margin smaller, and to the left to make it bigger.
Was this article helpful?
0 out of 0 people found this article helpful.
Thank you for your feedback.