- Features
-
Services/ProductsServices/ProductsServices/Products

Learn more about the retail trading conditions, platforms, and products available for trading that FXON offers as a currency broker.
You can't start without it.
Trading Platforms Trading Platforms Trading Platforms
Features and functionality comparison of MetaTrader 4/5, and correspondence table of each function by OS
Two account types to choose
Trading Account Types Trading Account Types Trading Account Types
Introducing FXON's Standard and Elite accounts.
close close

-
SupportSupportSupport

Support information for customers, including how to open an account, how to use the trading tools, and a collection of QAs from the help desk.
Recommended for beginner!
Account Opening Account Opening Account Opening
Detailed explanation of everything from how to open a real account to the deposit process.
MetaTrader4/5 User Guide MetaTrader4/5 User Guide MetaTrader4/5 User Guide
The most detailed explanation of how to install and operate MetaTrader anywhere.
FAQ FAQ FAQ
Do you have a question? All the answers are here.
Coming Soon
Glossary Glossary GlossaryGlossary of terms related to trading and investing in general, including FX, virtual currencies and CFDs.
News News News
Company and License Company and License Company and License
Sitemap Sitemap Sitemap
Contact Us Contact Us Contact Us
General, personal information and privacy inquiries.
close close

- Promotion
- Trader's Market
- Partner
-
close close
Learn more about the retail trading conditions, platforms, and products available for trading that FXON offers as a currency broker.
You can't start without it.
Features and functionality comparison of MetaTrader 4/5, and correspondence table of each function by OS
Two account types to choose
Introducing FXON's Standard and Elite accounts.
Support information for customers, including how to open an account, how to use the trading tools, and a collection of QAs from the help desk.
Recommended for beginner!
Detailed explanation of everything from how to open a real account to the deposit process.
The most detailed explanation of how to install and operate MetaTrader anywhere.
Do you have a question? All the answers are here.
Coming Soon
Glossary of terms related to trading and investing in general, including FX, virtual currencies and CFDs.
General, personal information and privacy inquiries.
Useful information for trading and market information is posted here. You can also view trader-to-trader trading performance portfolios.
Find a trading buddy!
Share trading results among traders. Share operational results and trading methods.
- Legal Documents TOP
- Client Agreement
- Risk Disclosure and Warning Notice
- Order and Execution Policy
- Complaints Procedure Policy
- AML/CFT and KYC Policy
- Privacy Policy
- eKYC Usage Policy
- Cookies Policy
- Website Access and Usage Policy
- Introducer Agreement
- Business Partner Agreement
- VPS Service Terms and Condition


This article was :
published
updated
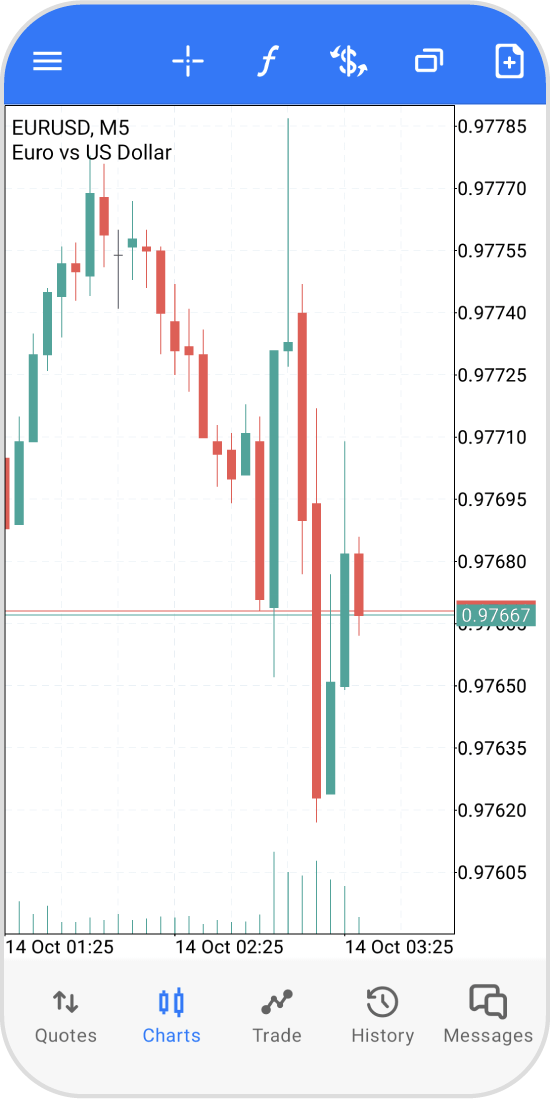
Here we'll look over the steps on how to display tick volumes on the chart in MetaTrader5 (MT5) app for Android and iOS mobile devices. Tick volumes displayed in MT5 come from the forex broker. The volume displays the total trade volume.
Related article: Display volumes on chart
iPhone
*Scroll horizontally to see more*Swipe horizontally to see more
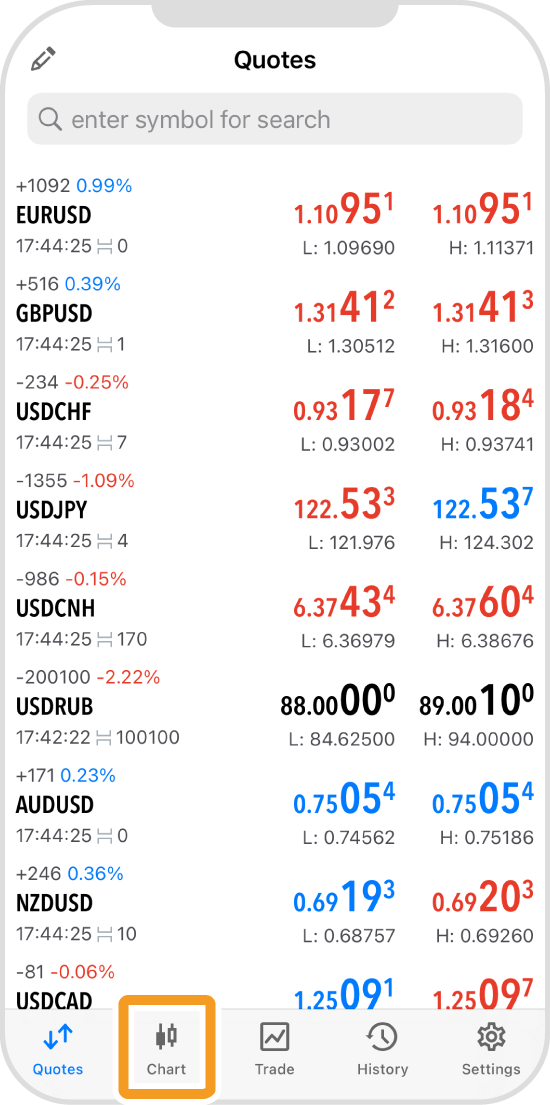
Step 1
Tap "Chart" on the bottom navigation bar.
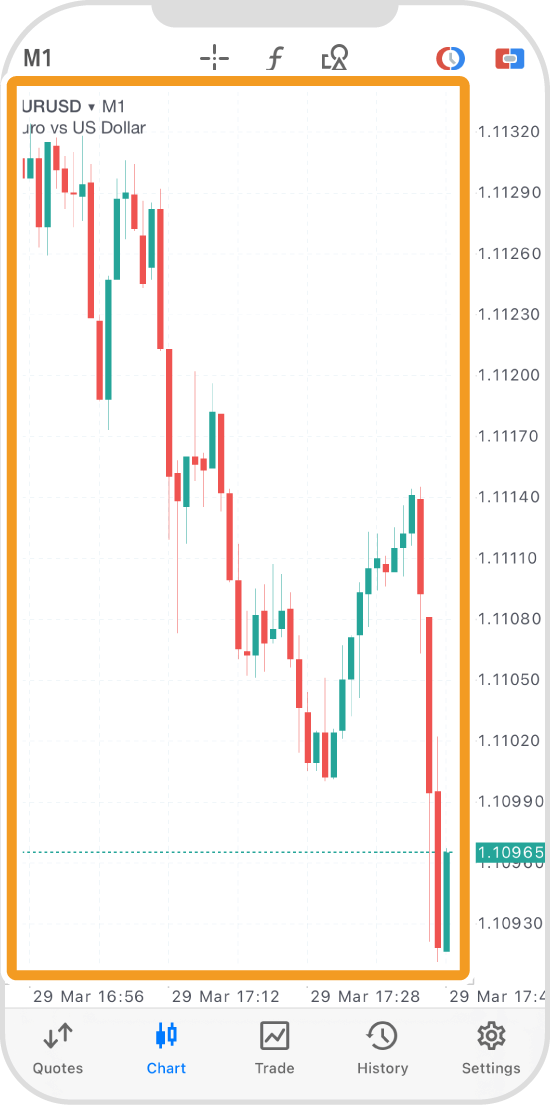
Step 2
Tap on the chart.
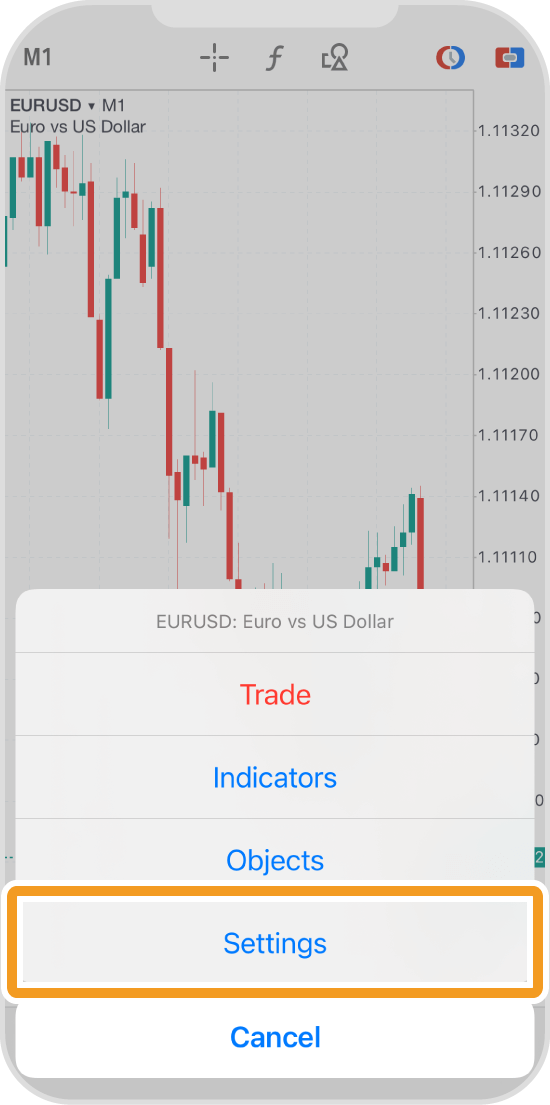
Step 3
Tap "Settings".
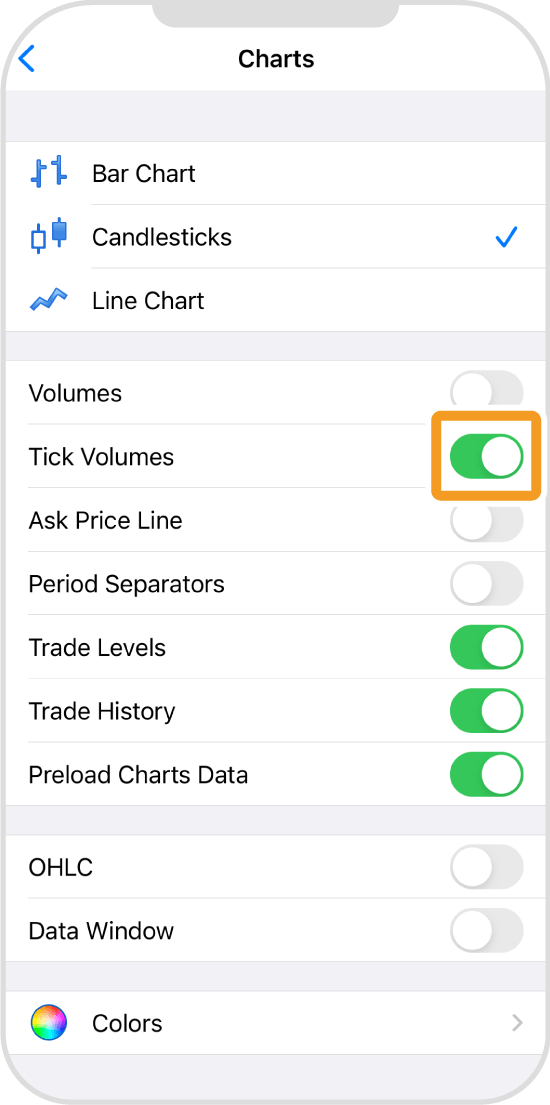
Step 4
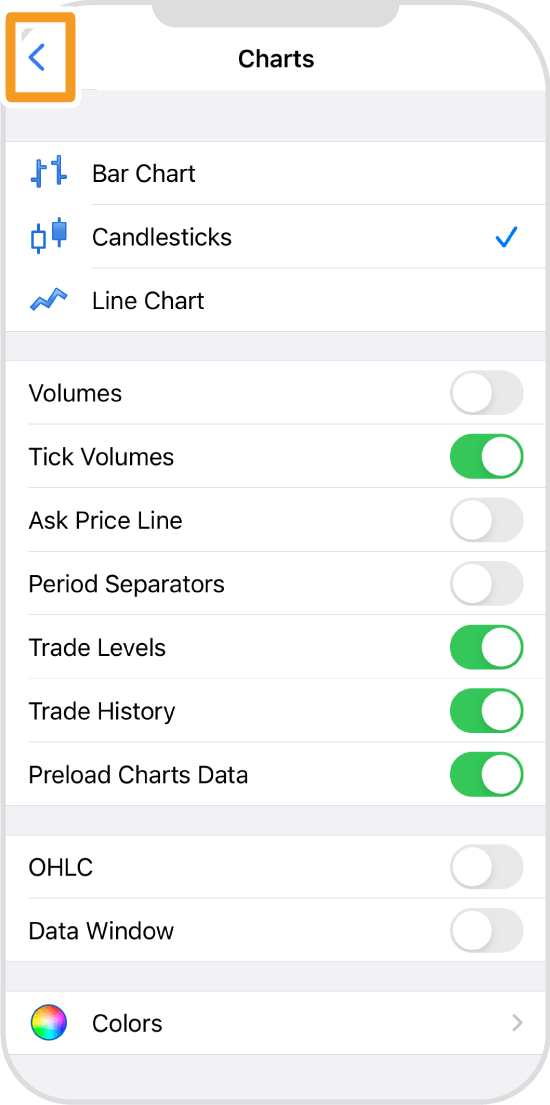
Toggle the "Tick Volumes" button ON.
Step 5
Tap the arrow icon in the top left corner.
Step 6
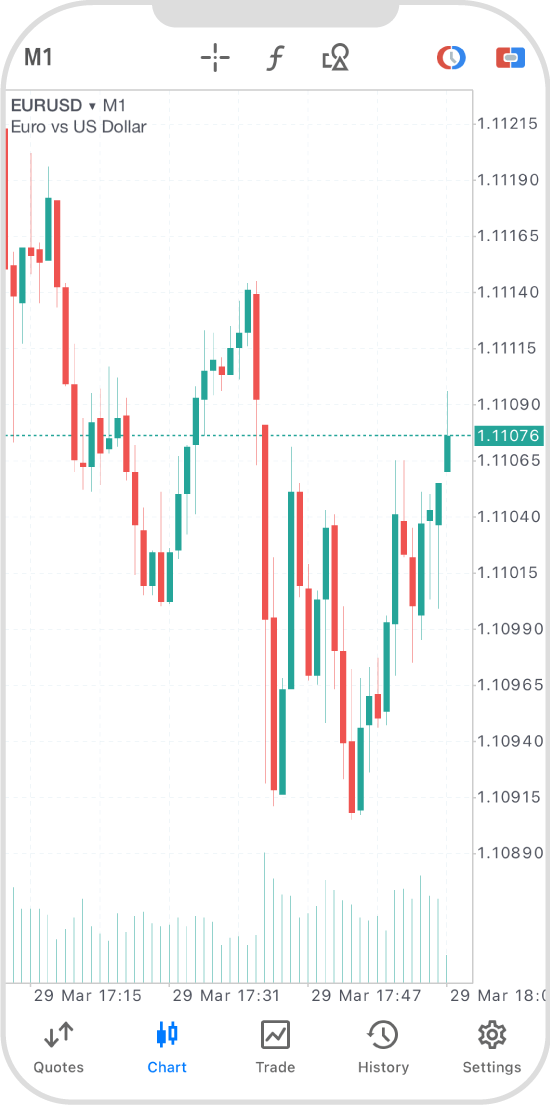
The tick volumes will be displayed at the bottom of the chart.
Android
*Scroll horizontally to see more*Swipe horizontally to see more
Step 1
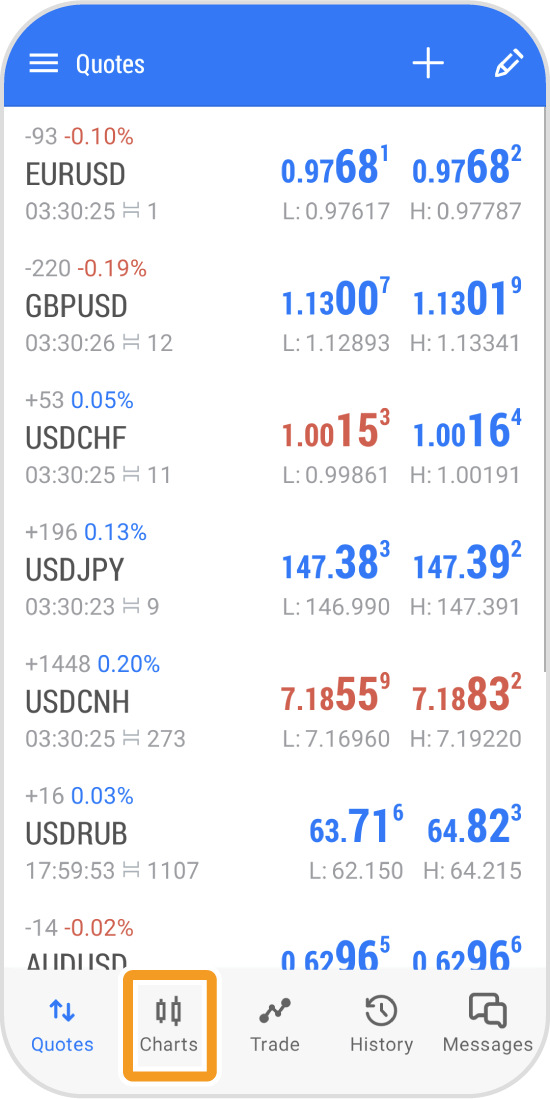
Tap "Charts" on the bottom navigation bar.
Step 2
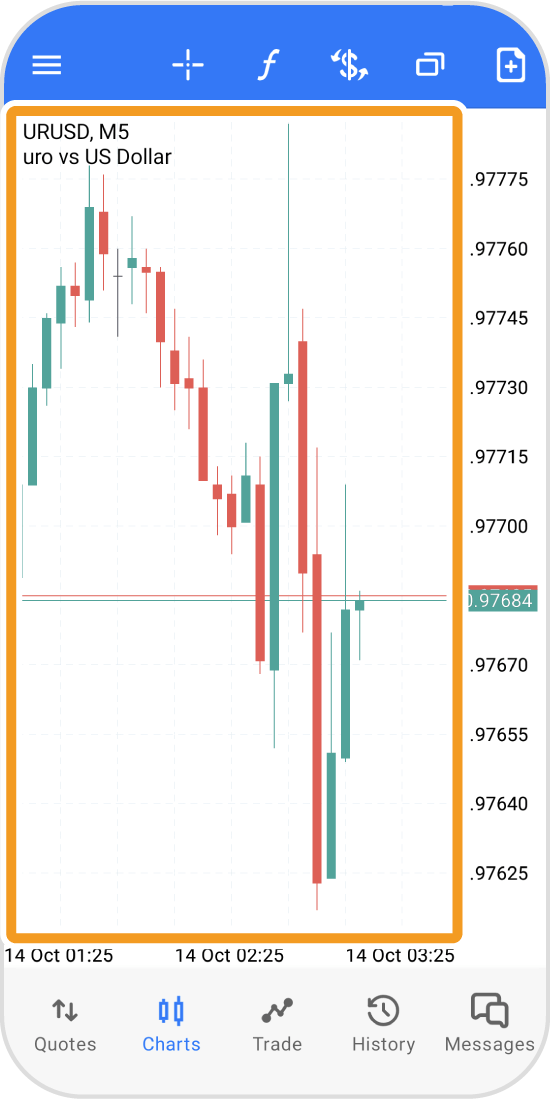
Tap on the chart.
Step 3
Tap the "Settings" icon.
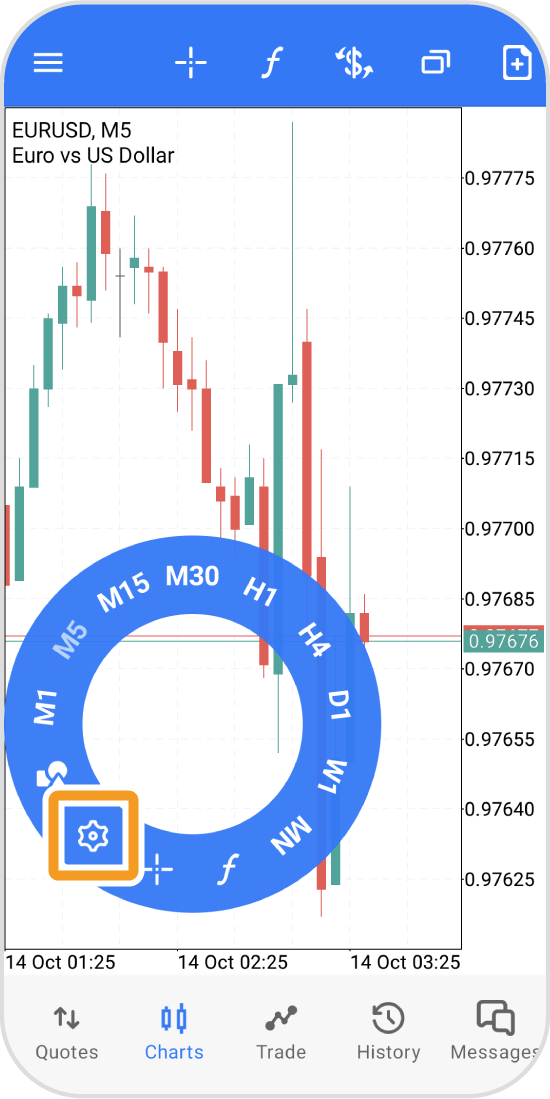
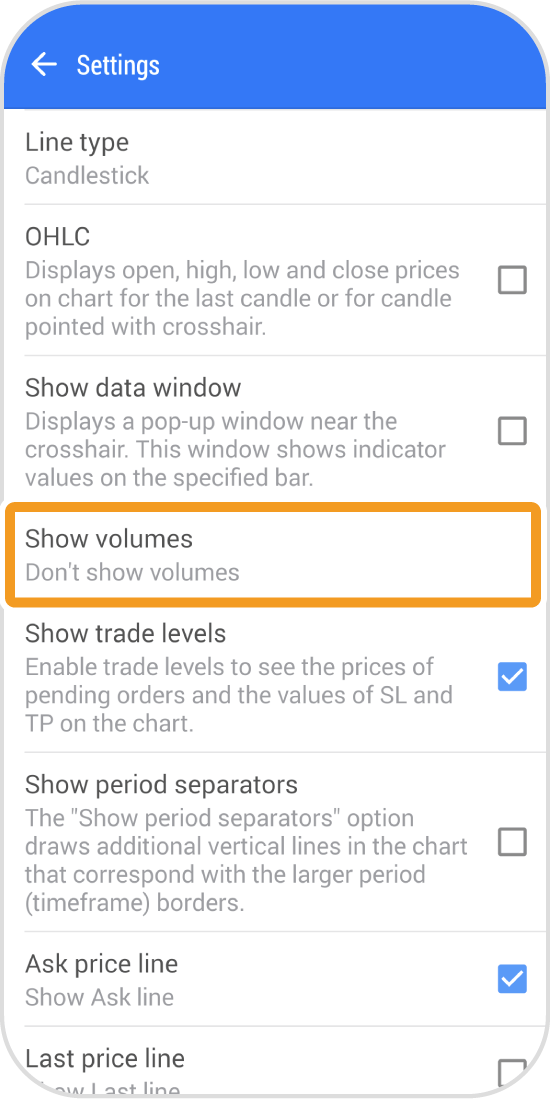
Step 4
Tap "Show volumes".
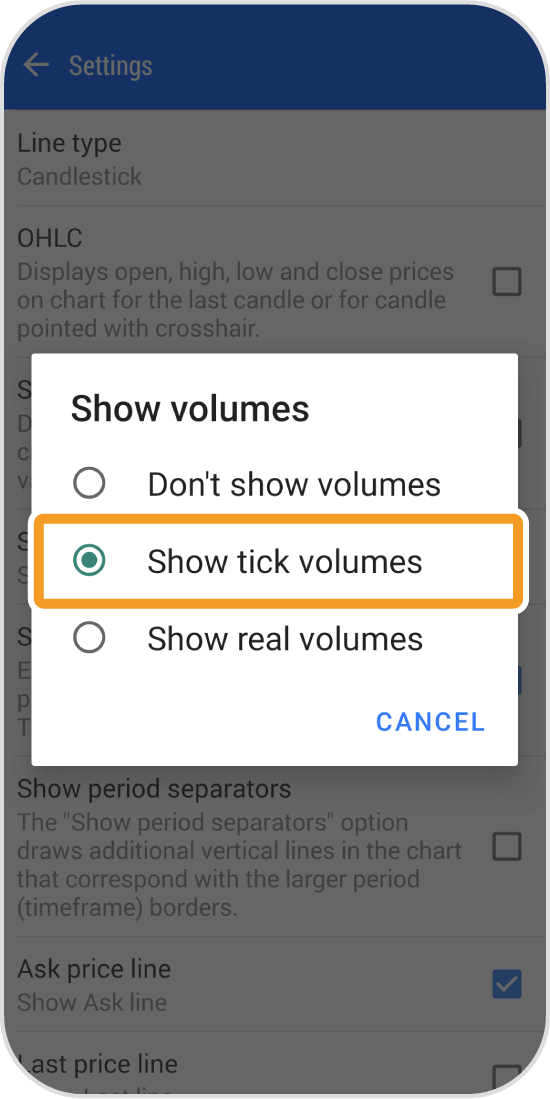
Step 5
Tap "Show tick volumes".
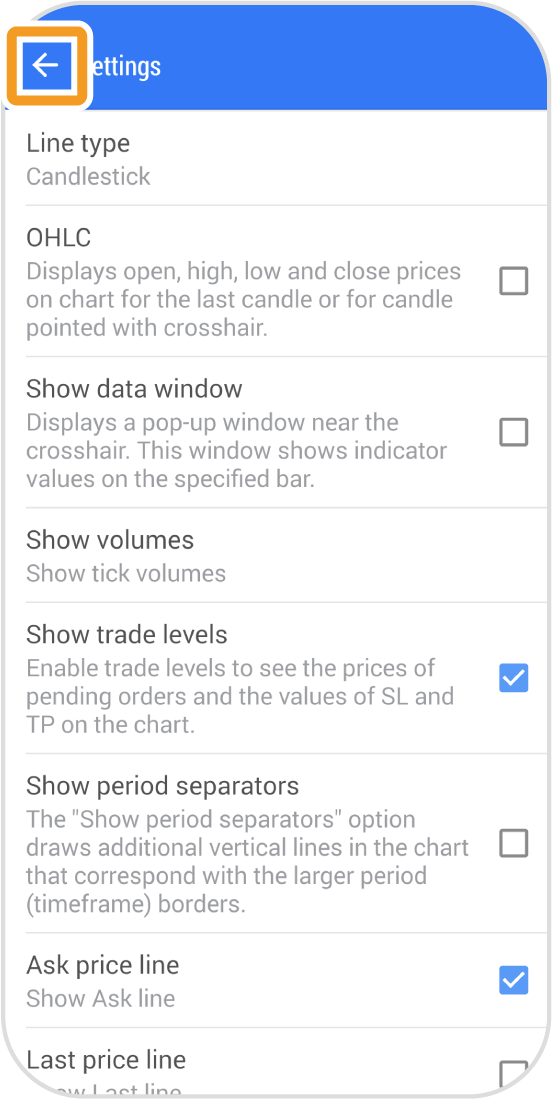
Step 6
Tap the arrow icon in the top left corner.
Step 7
The tick volumes will be displayed at the bottom of the chart.
iPad
*Scroll horizontally to see more*Swipe horizontally to see more
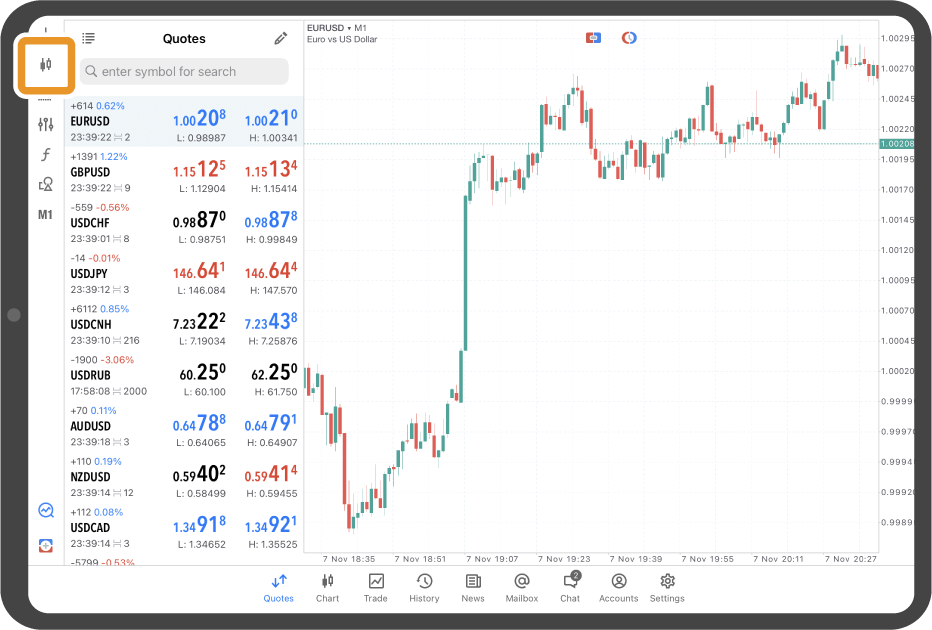
Step 1
Tap the "Volumes" icon on the left.
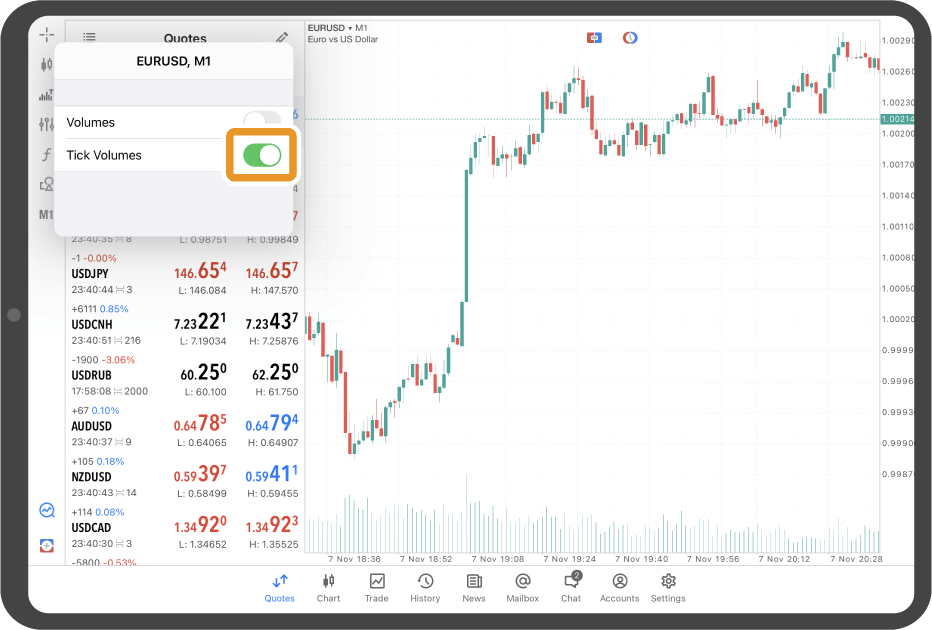
Step 2
Toggle the "Tick Volumes" button ON.
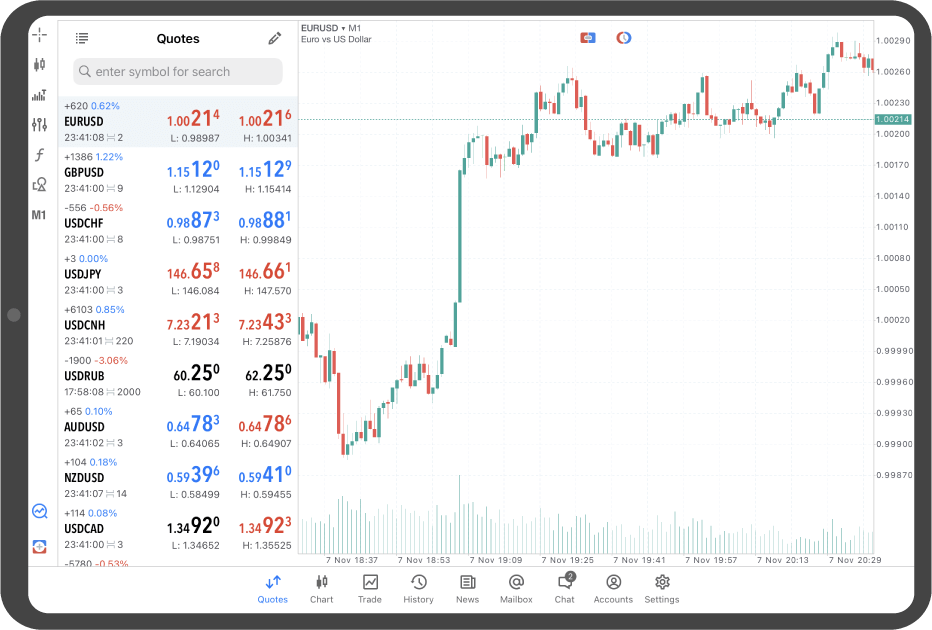
Step 3
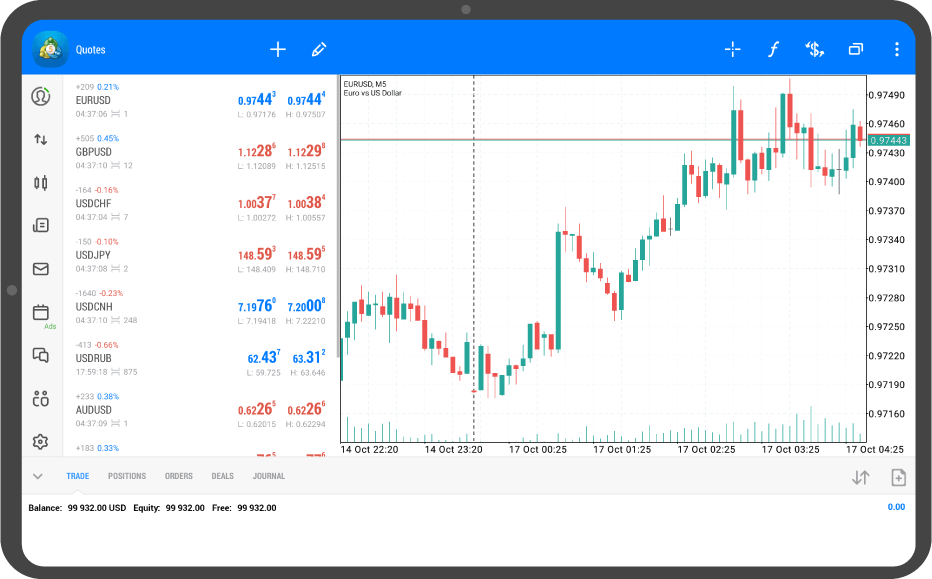
The tick volumes will be displayed at the bottom of the chart.
Android tablet
*Scroll horizontally to see more*Swipe horizontally to see more
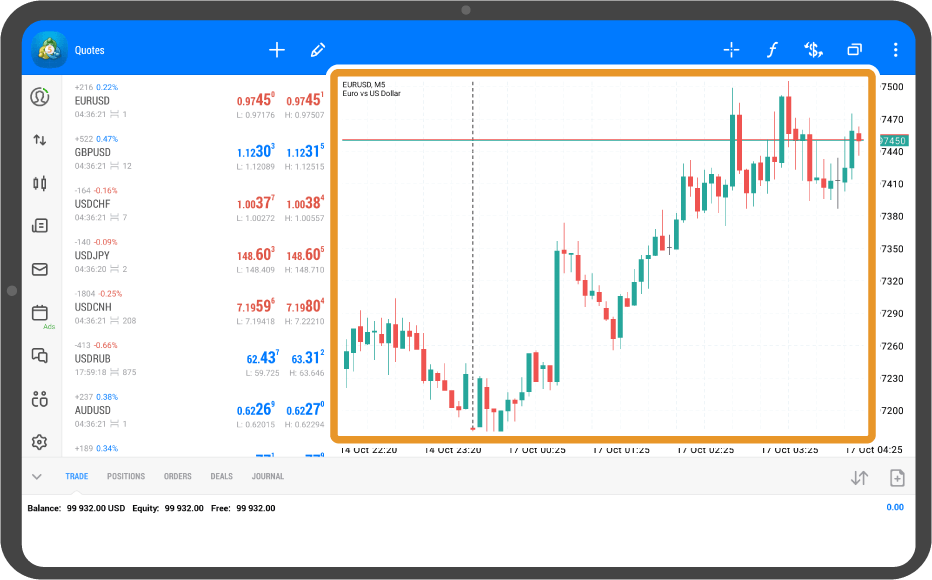
Step 1
Tap on the chart.
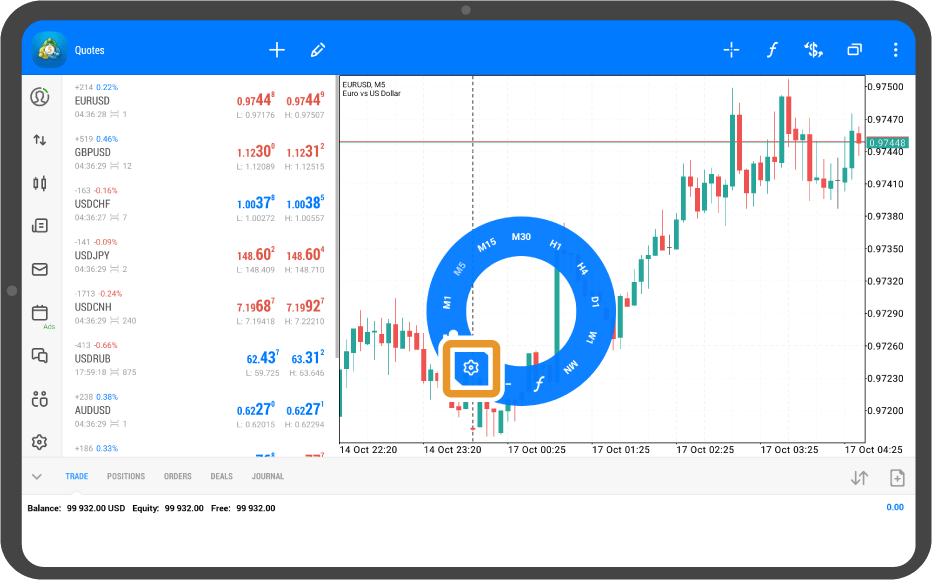
Step 2
Tap the "Settings" icon.
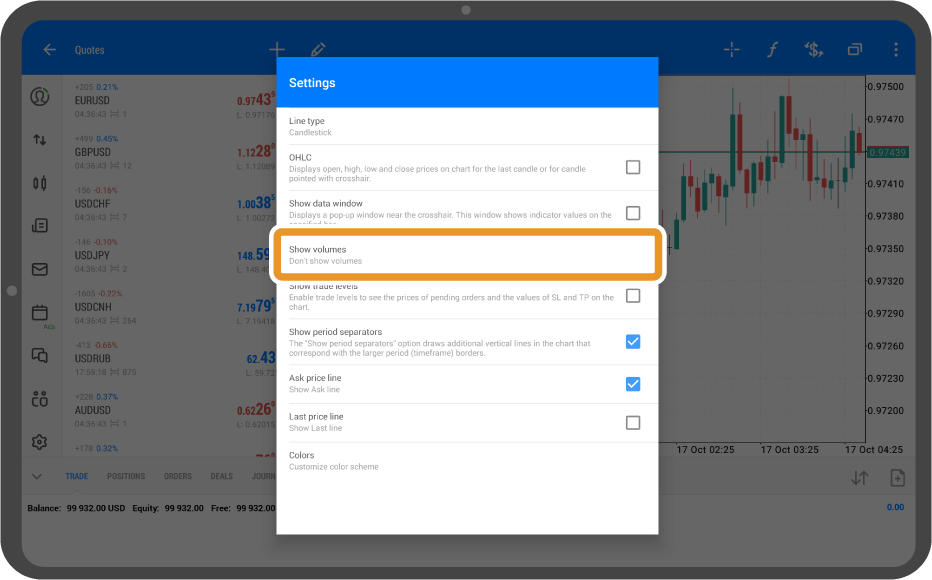
Step 3
Tap "Show volumes".
Step 4
Tap "Show tick volumes".
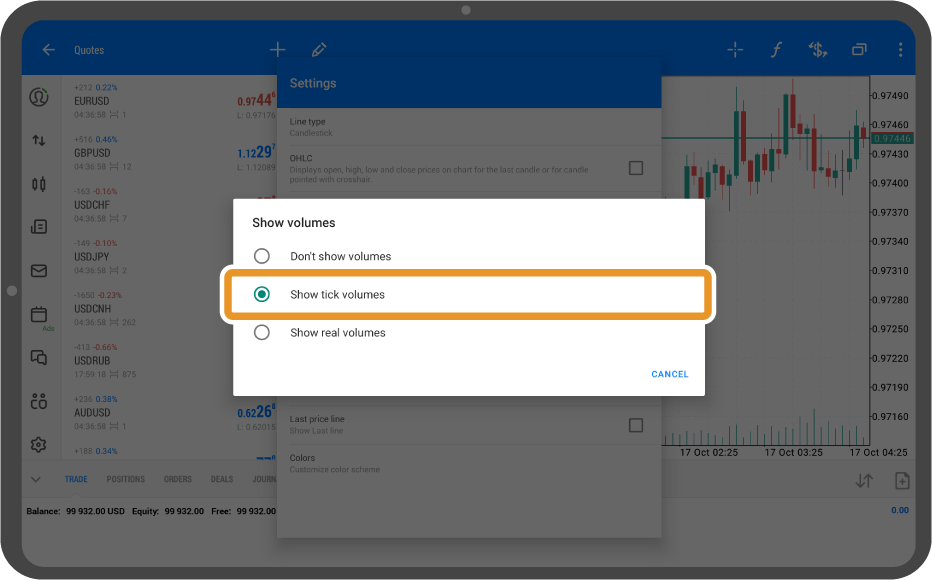
Step 5
The tick volumes will be displayed at the bottom of the chart.
Was this article helpful?
0 out of 0 people found this article helpful.
Thank you for your feedback.
FXON uses cookies to enhance the functionality of the website and your experience on it. This website may also use cookies from third parties (advertisers, log analyzers, etc.) for the purpose of tracking your activities. Cookie Policy
