


MT4/MT5: Display rectangle/triangle/ellipse
EA, indicators & objects (PC)
EA, indicators & objects (PC)

This article was :
published
updated
In MetaTrader 4 (MT4) and MetaTrader 5 (MT5), you can add shapes such as rectangles, triangles, and ellipses to your charts. These shapes can be customized in color and positioned behind the chart. Use these tools to enhance your market analysis with greater precision.
Here we will look at how to display and set up the shapes like rectangle, triangle, and ellipse on MT4/MT5.
Switch between MT4/MT5 tabs to check the steps for each.
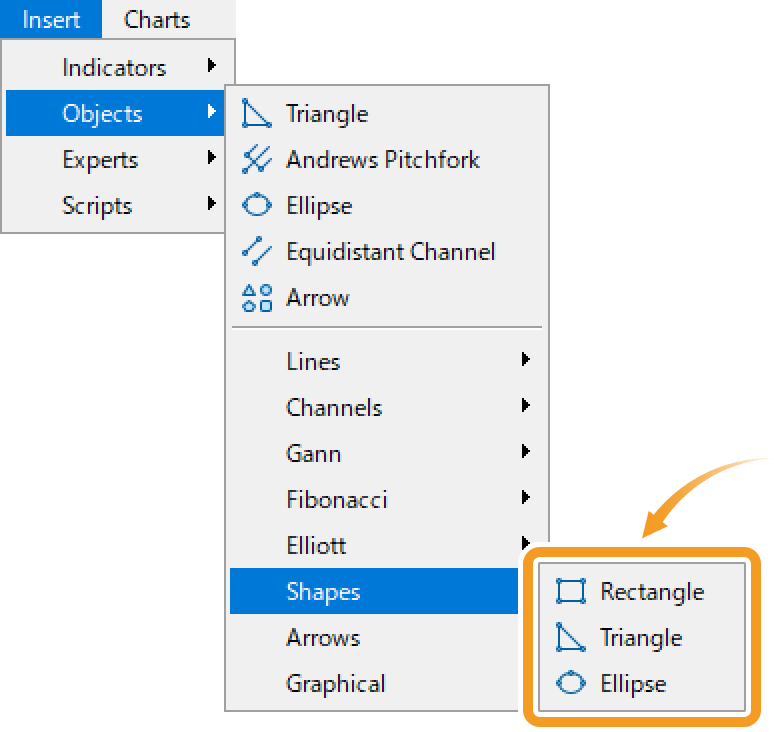
Click "Insert" in the menu. Hover the pointer over "Shapes" and select a shape.
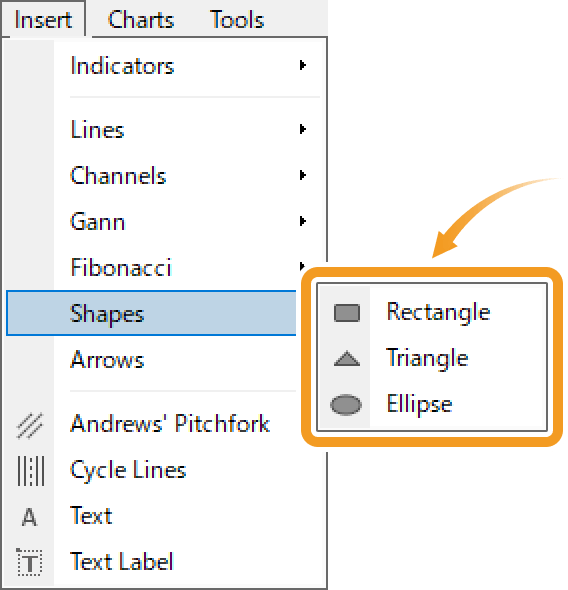
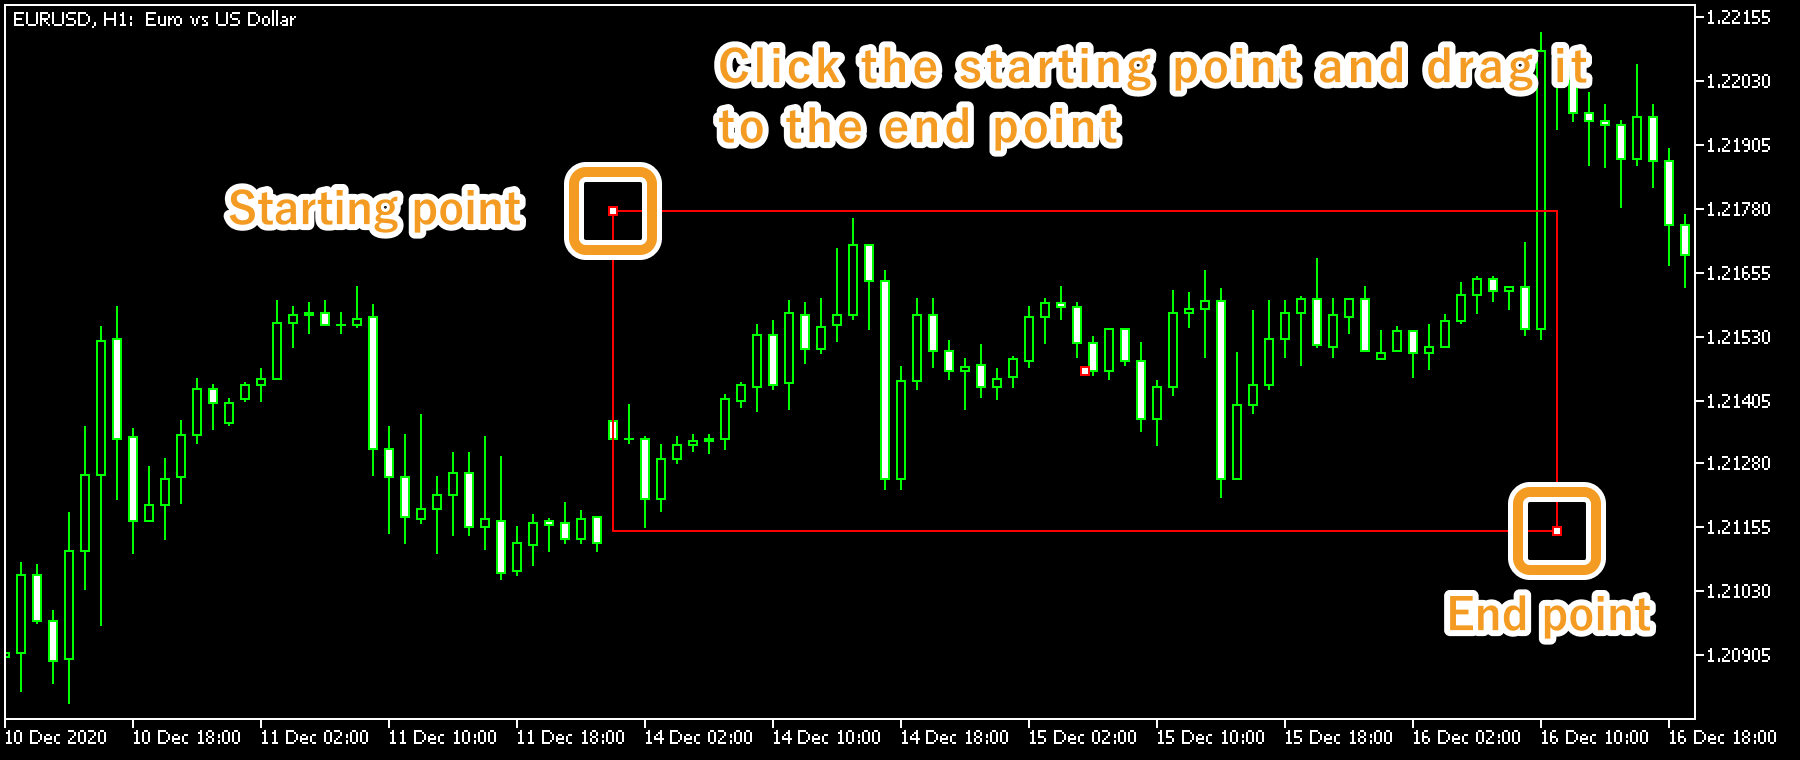
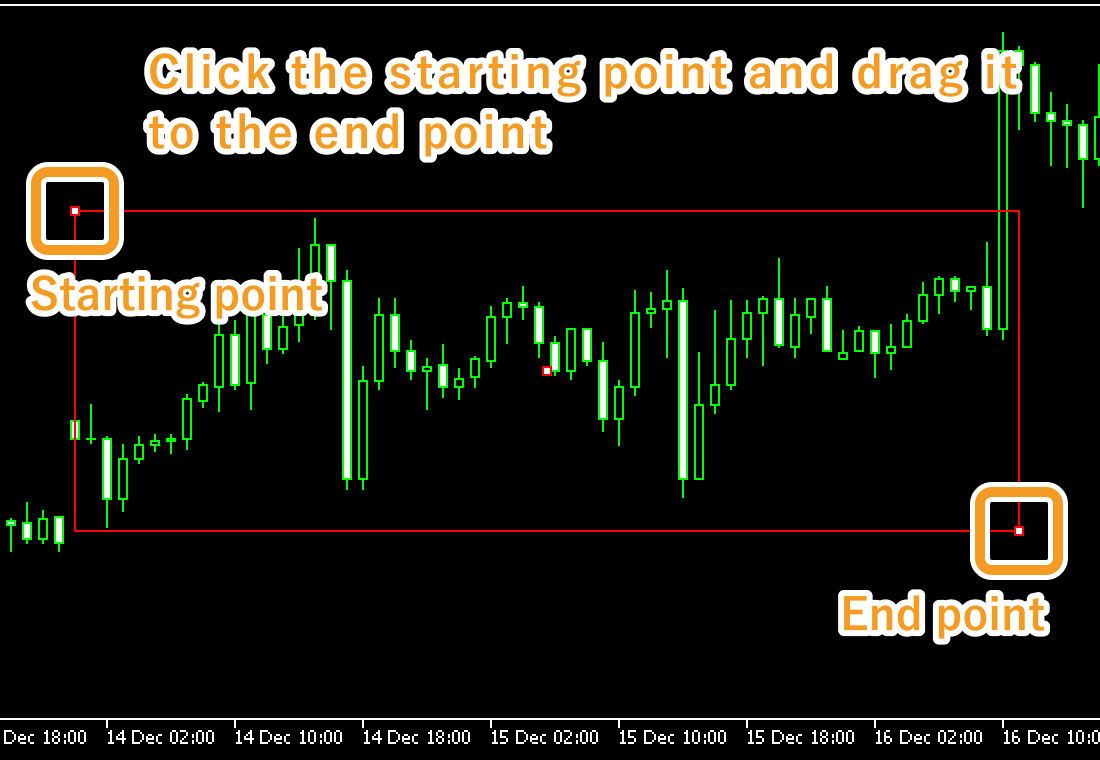
Rectangle

Highlight a specific part of the chart with a rectangle.
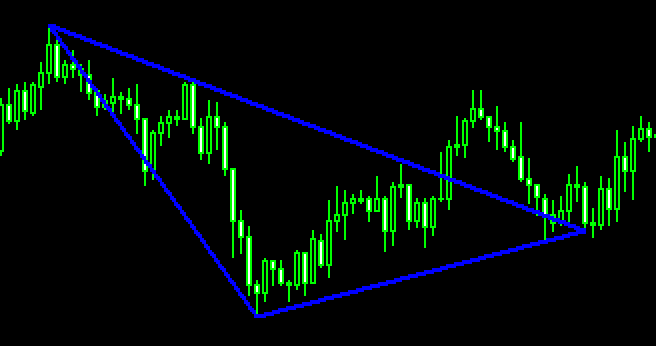
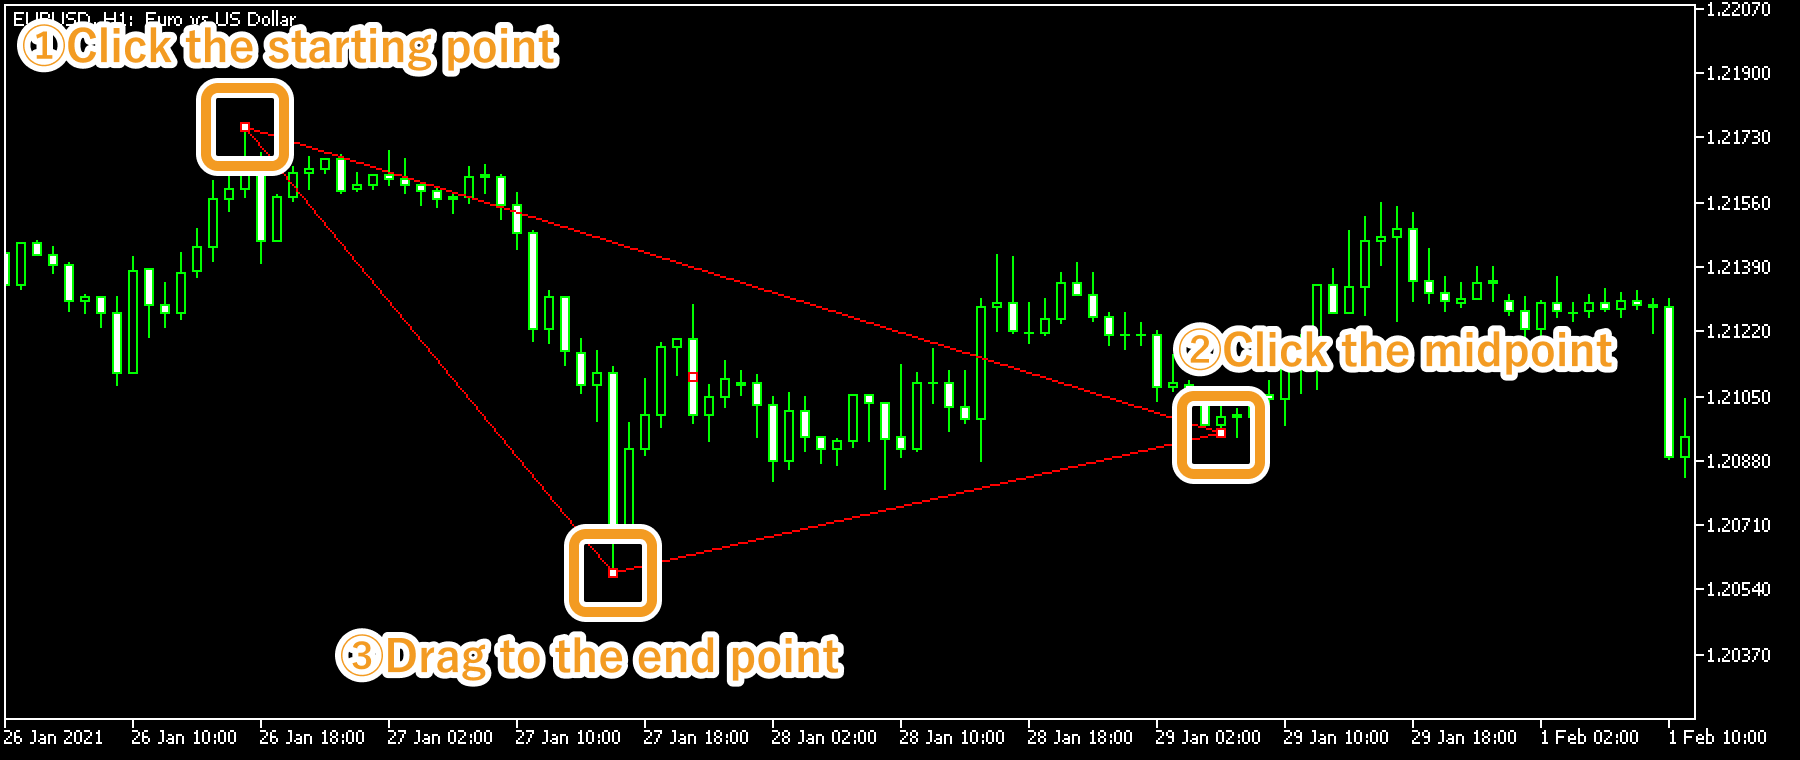
Triangle

Highlight a specific part of the chart with a triangle.
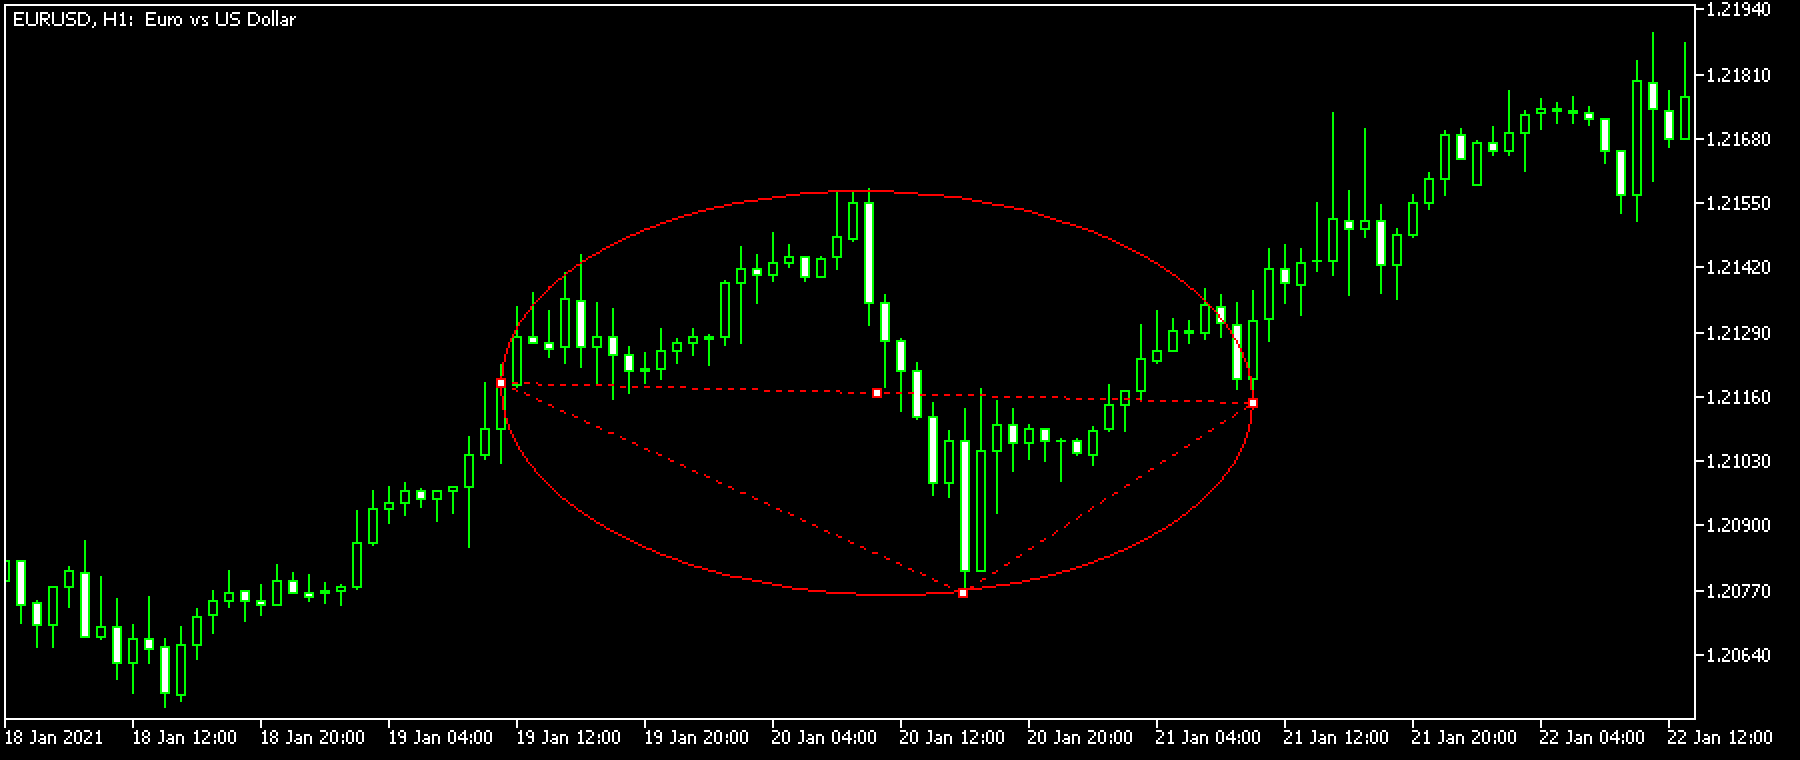
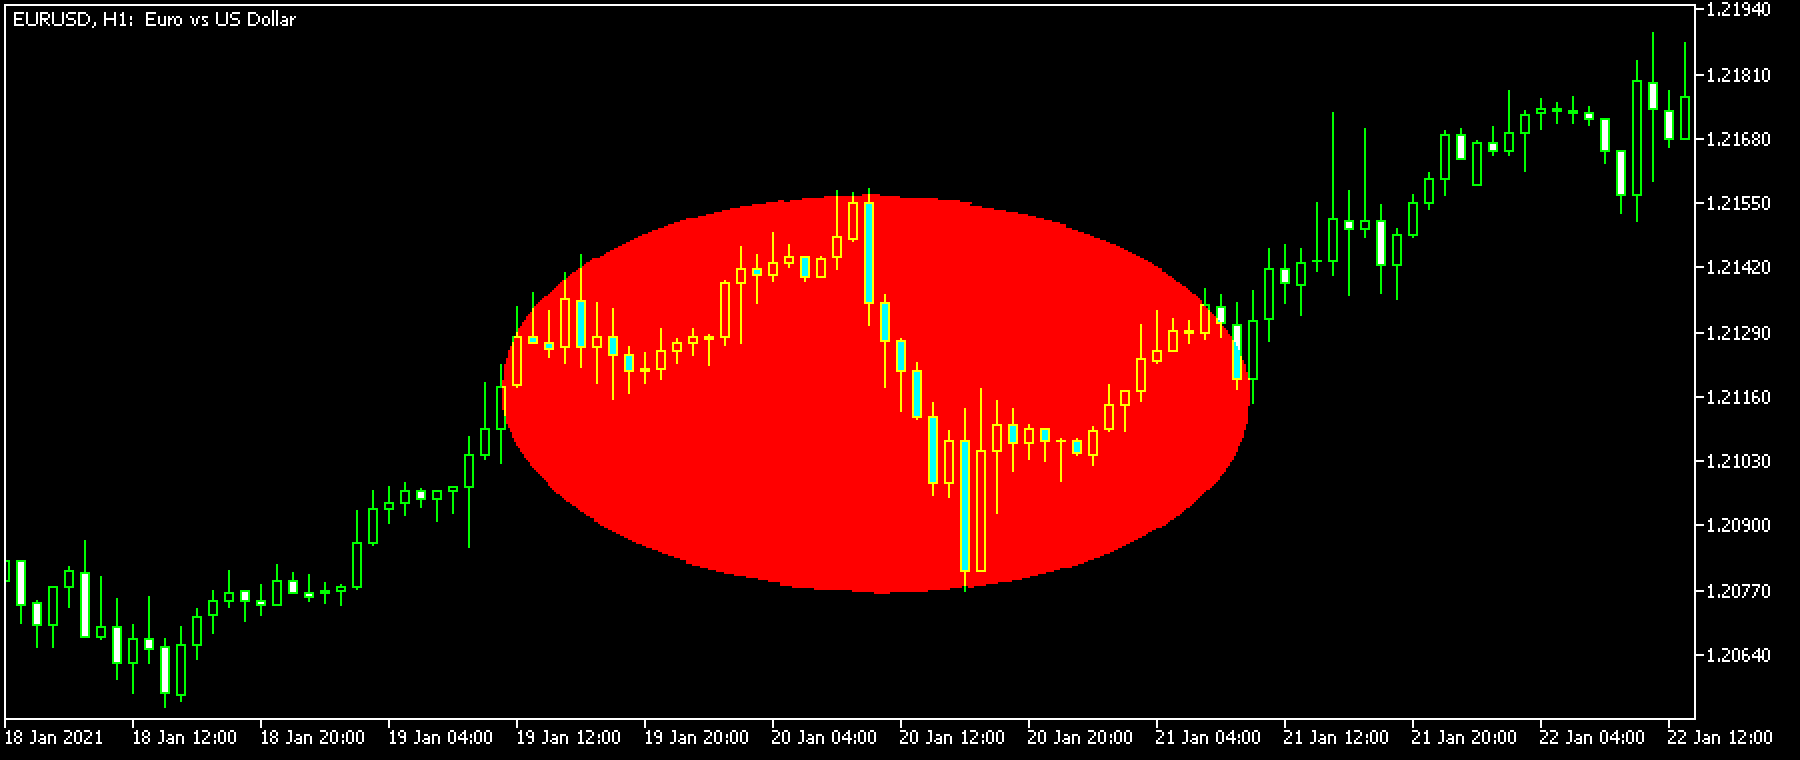
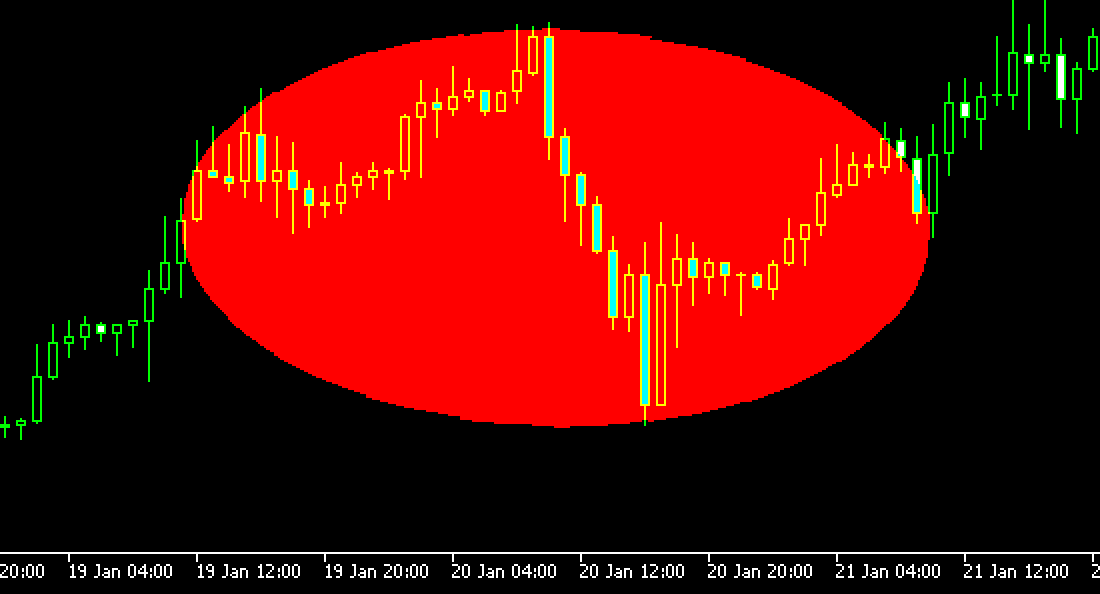
Ellipse
Highlight a specific part of the chart with an ellipse.
The methods for drawing vary by shape. Here, we'll cover how to draw a rectangle, triangle, and ellipse.
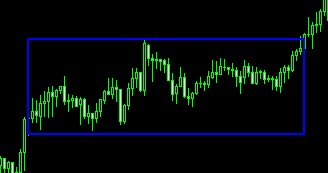
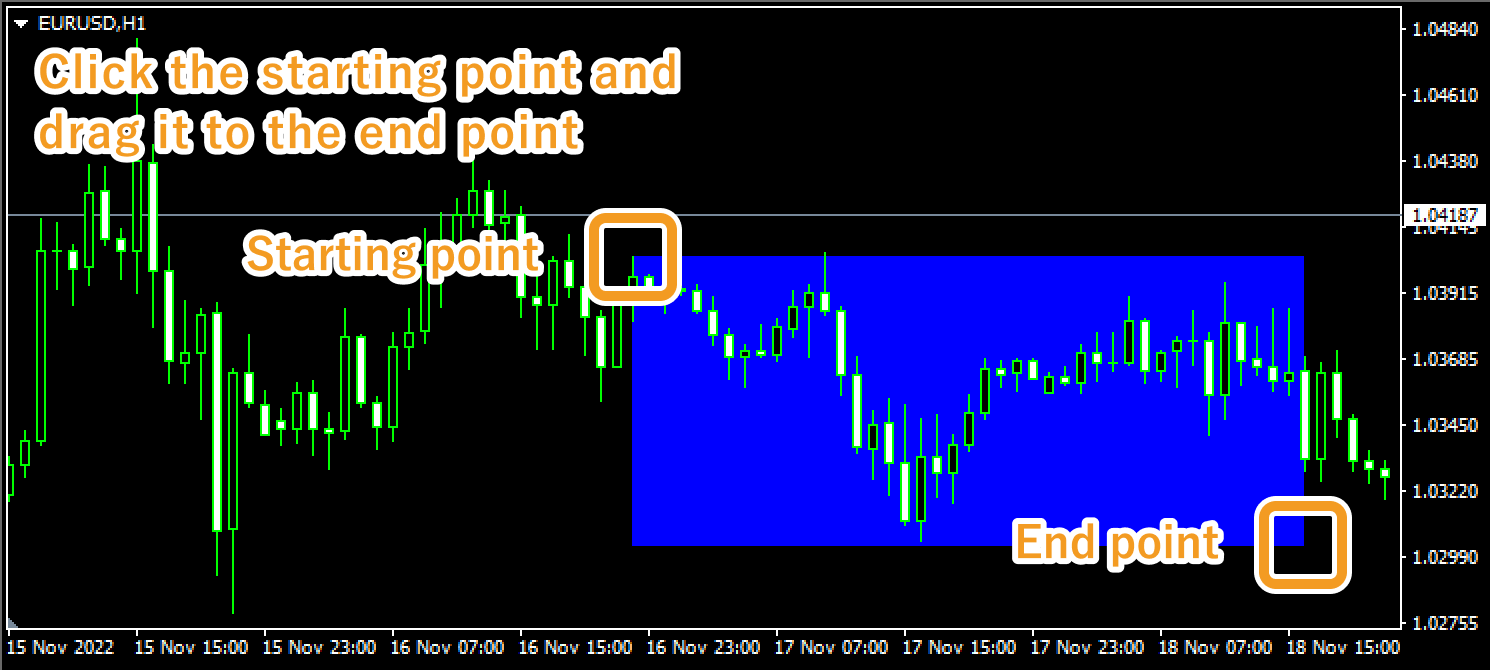
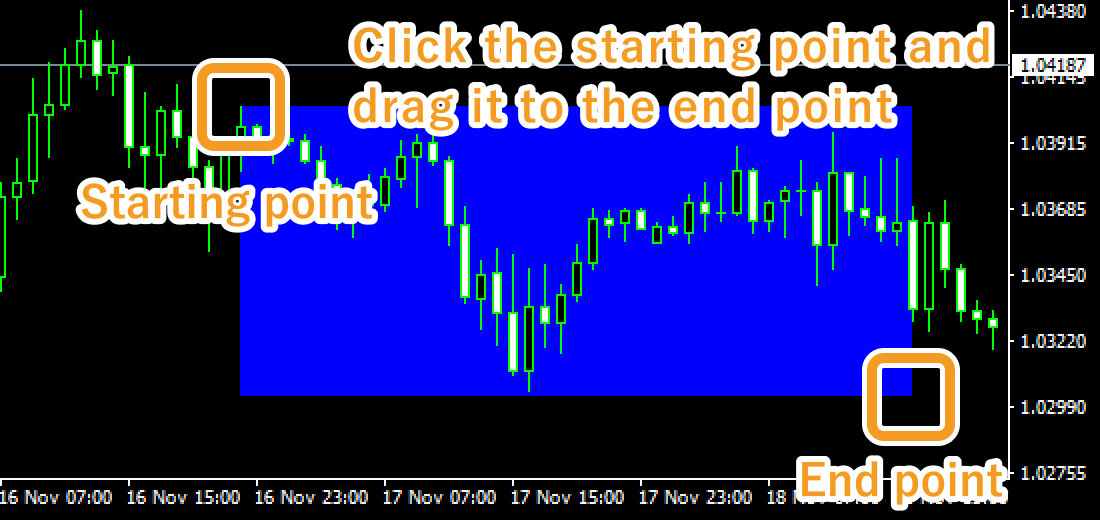
Click the starting point on the chart and drag it to the end point to create a rectangle.
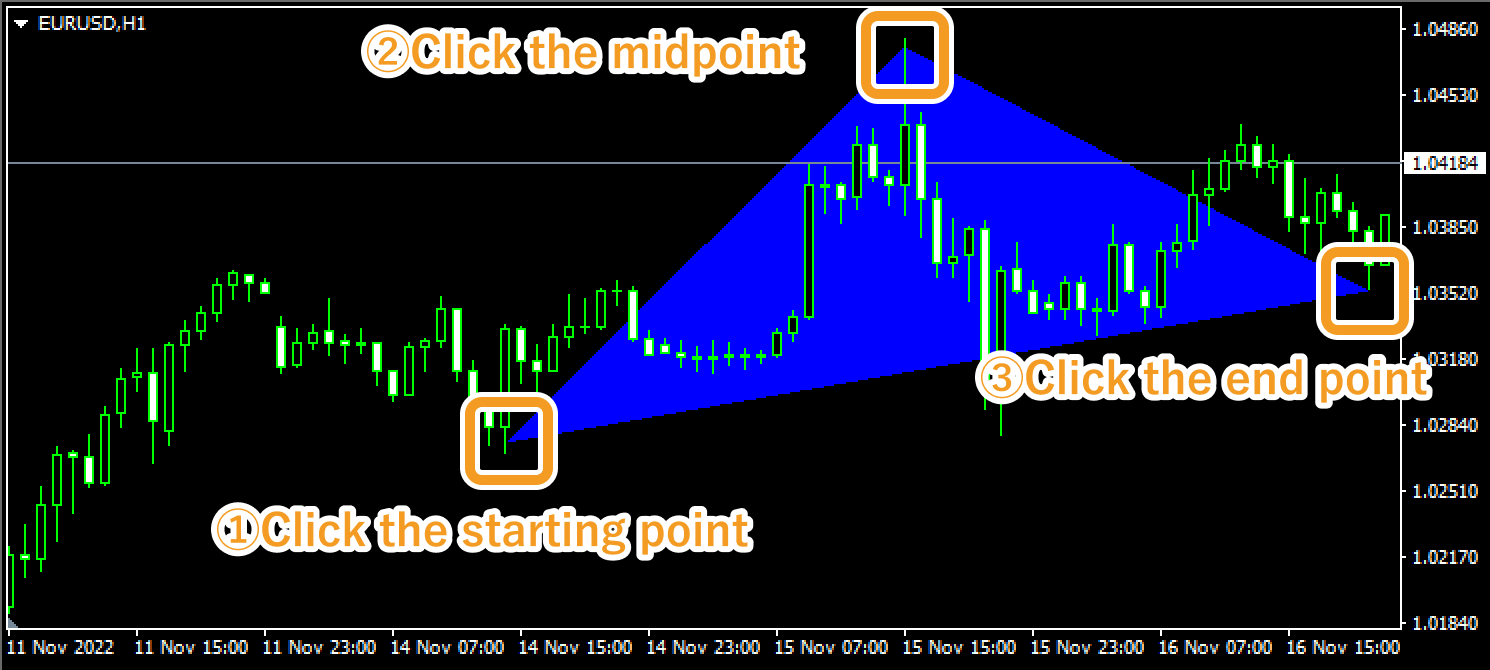
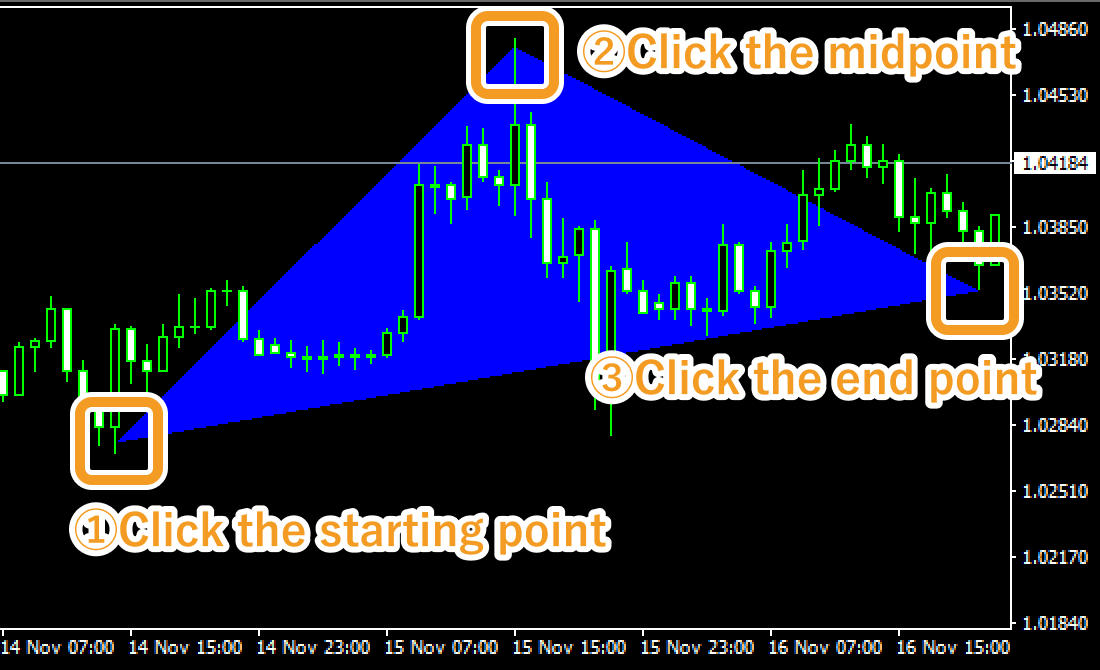
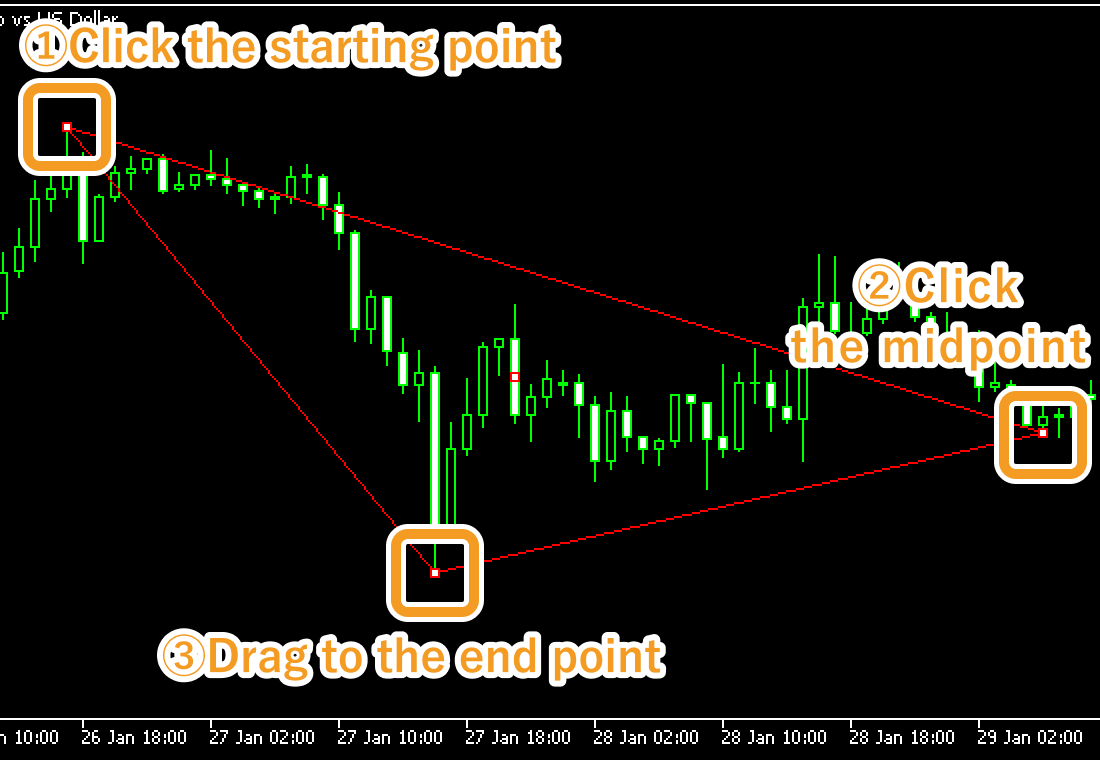
Click the starting point of the triangle on the chart. Click again at the midpoint, then drag the pointer to the end point to draw the triangle.
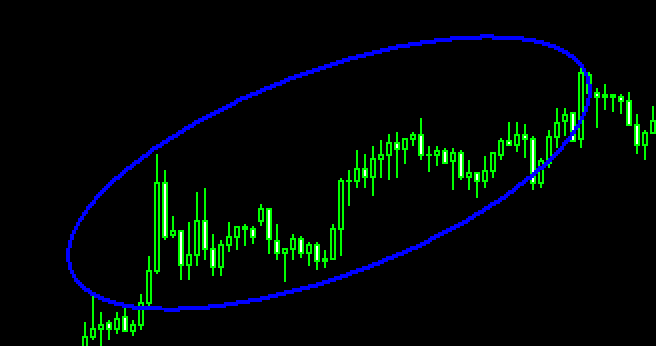
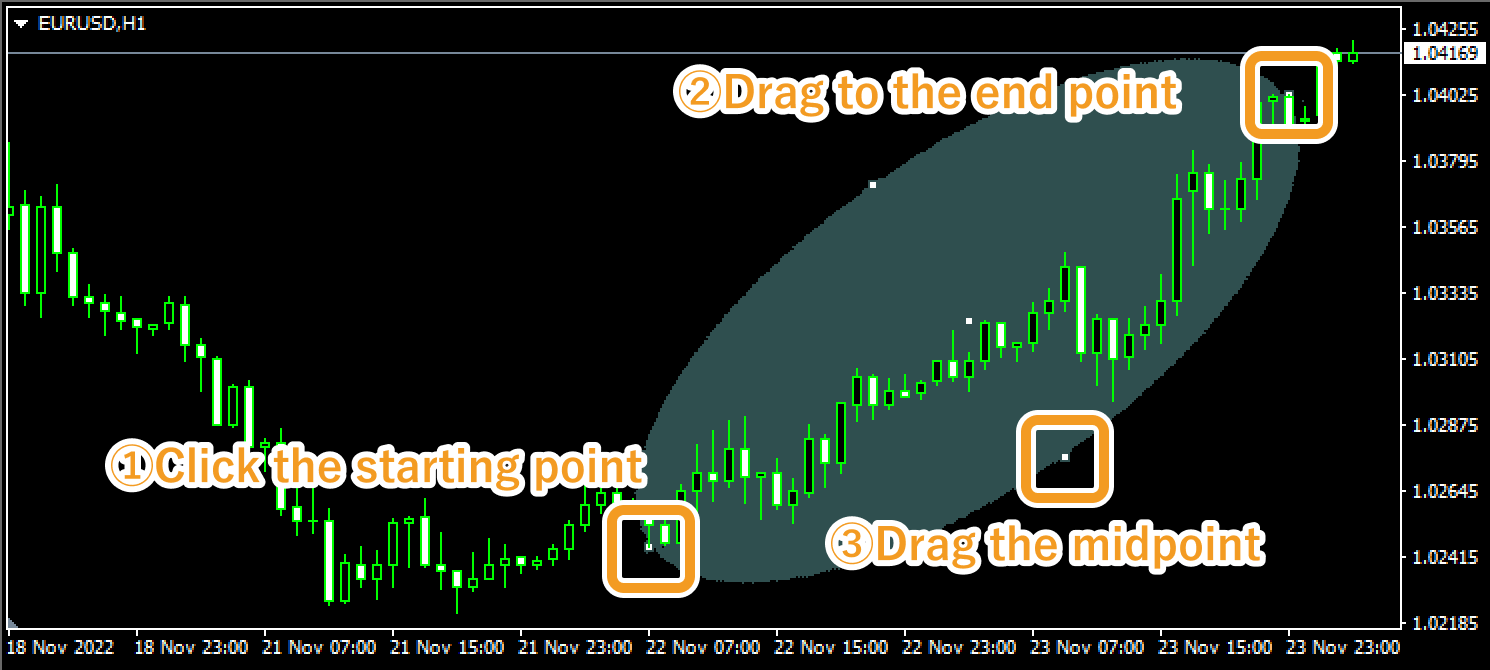
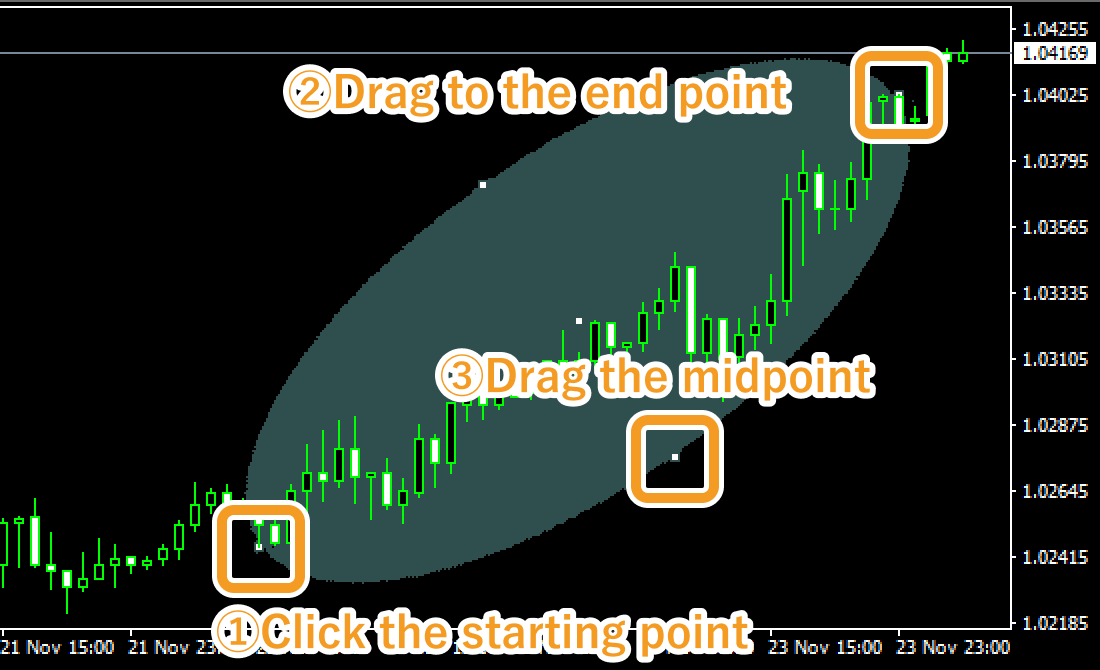
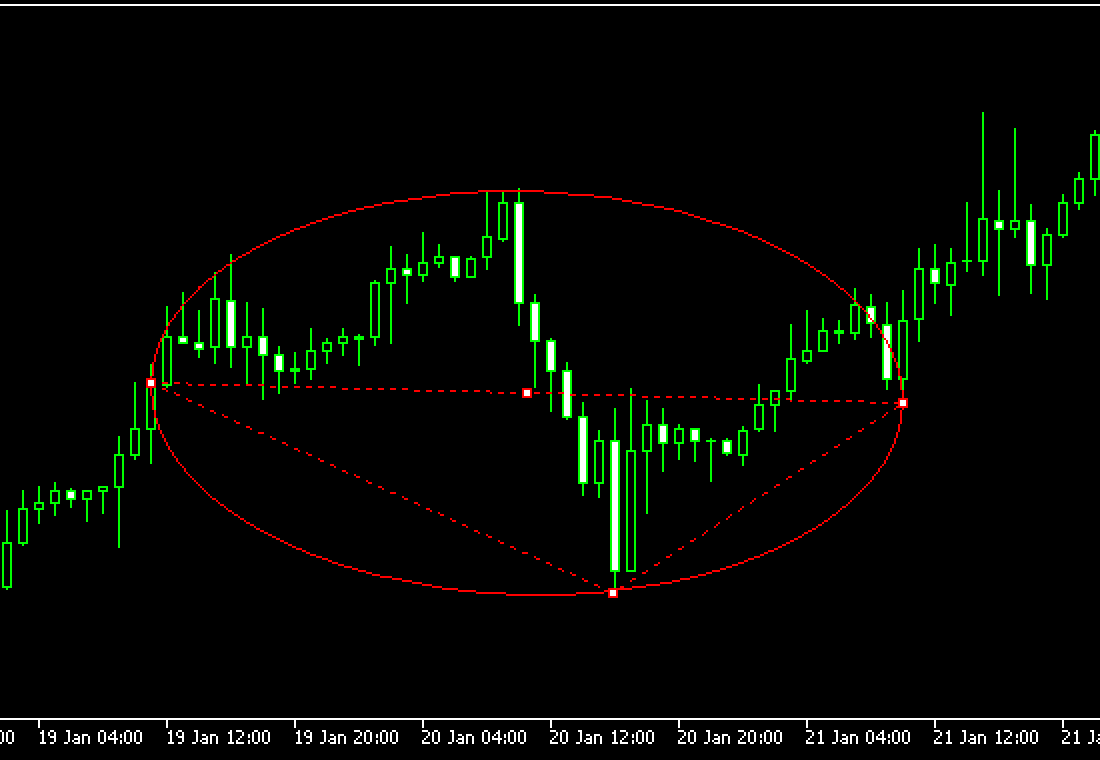
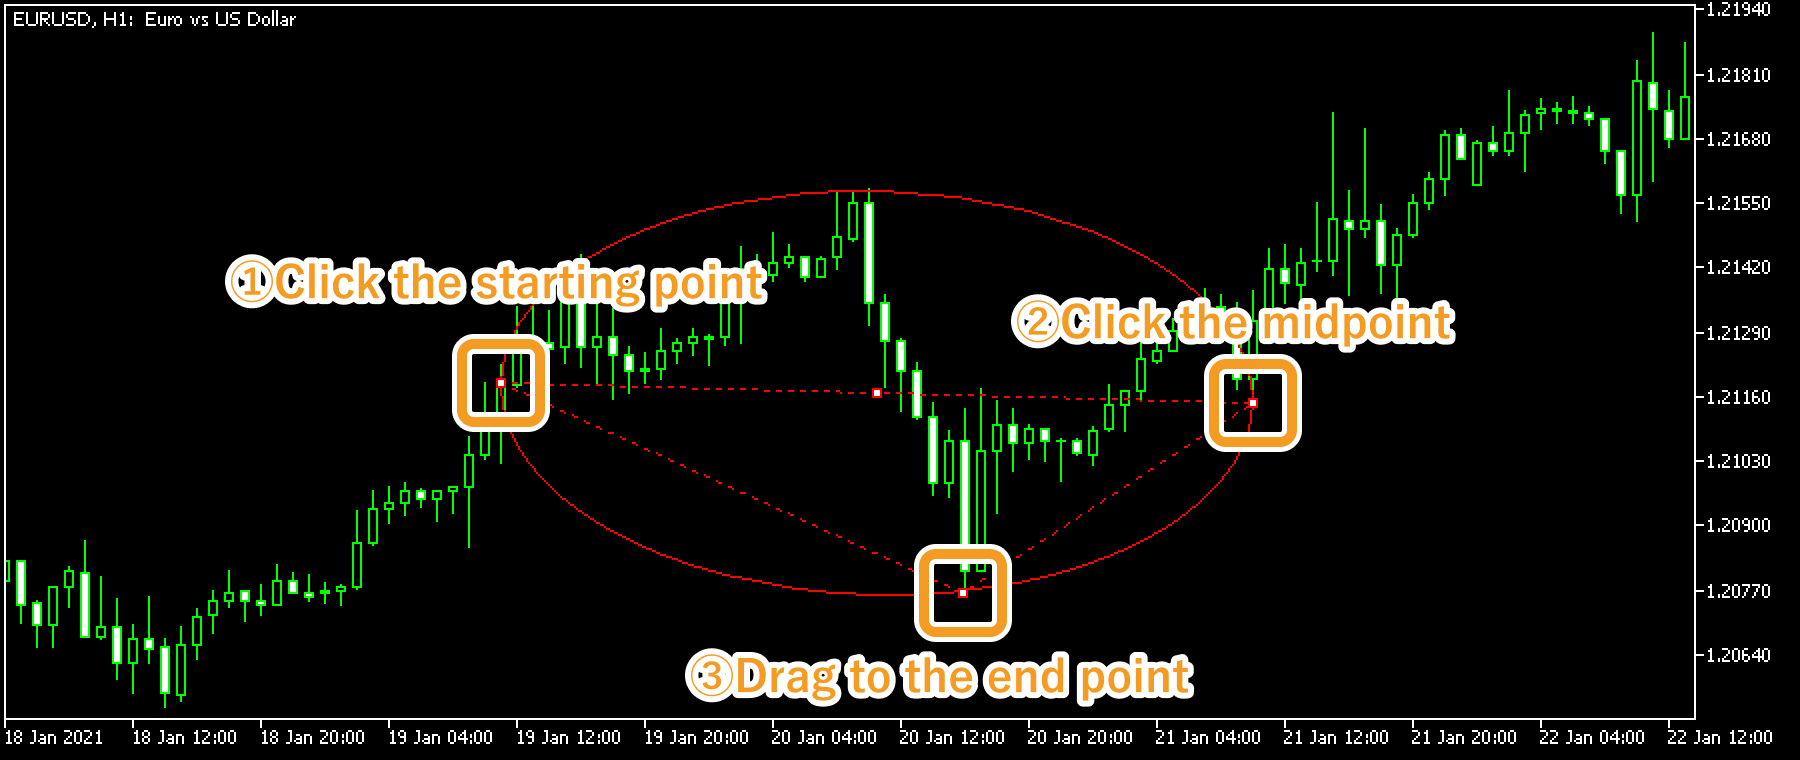
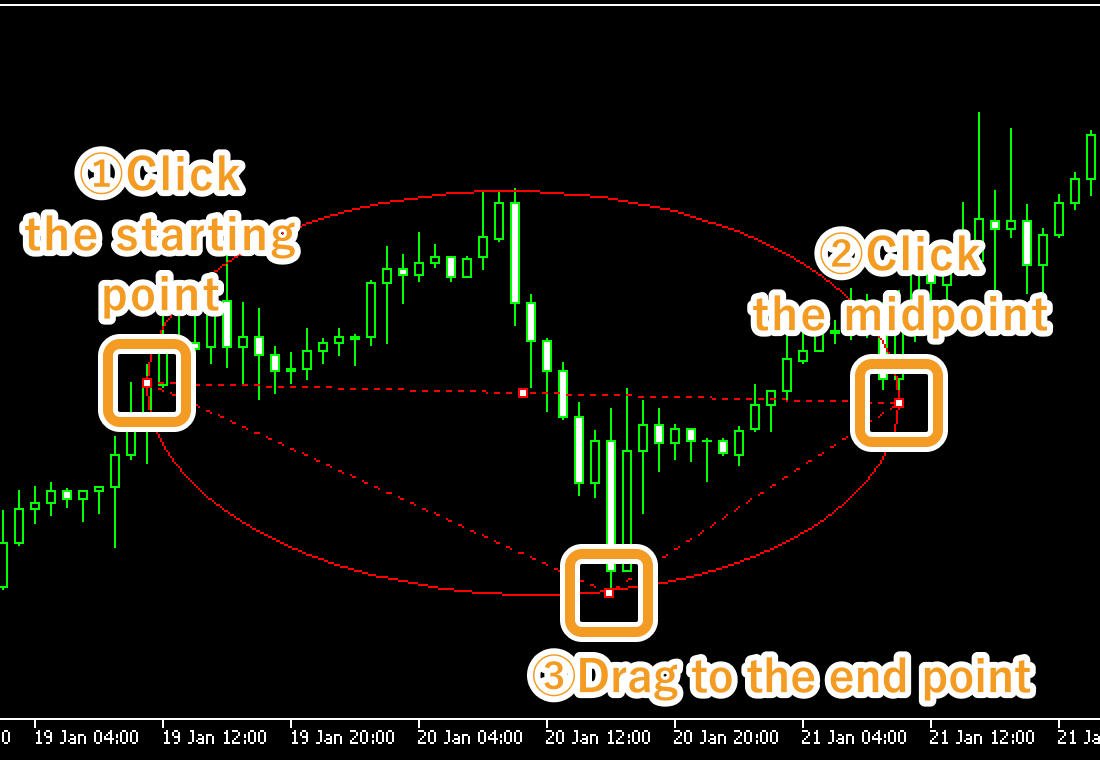
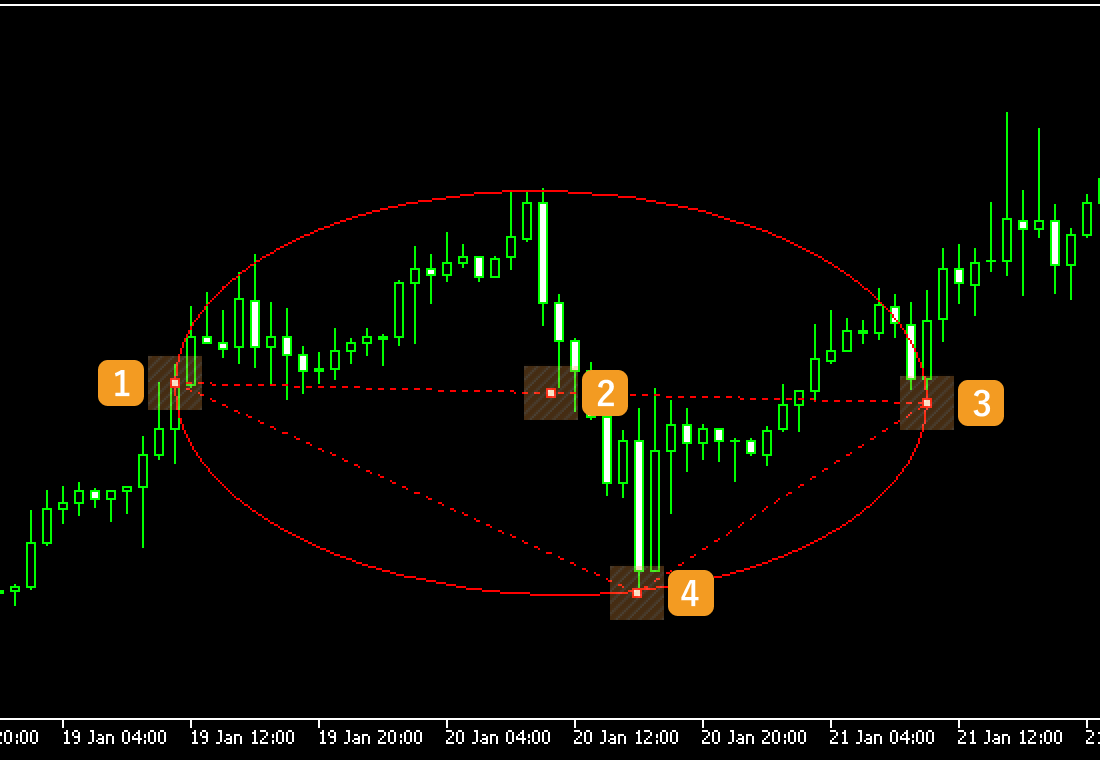
Click the starting point of the ellipse on the chart and drag it to the end point to plot the major axis. Then drag the white midpoint in the direction of the minor axis to create an ellipse. If you can't find the white point on the major axis, double-click around the area with a number in the image below.
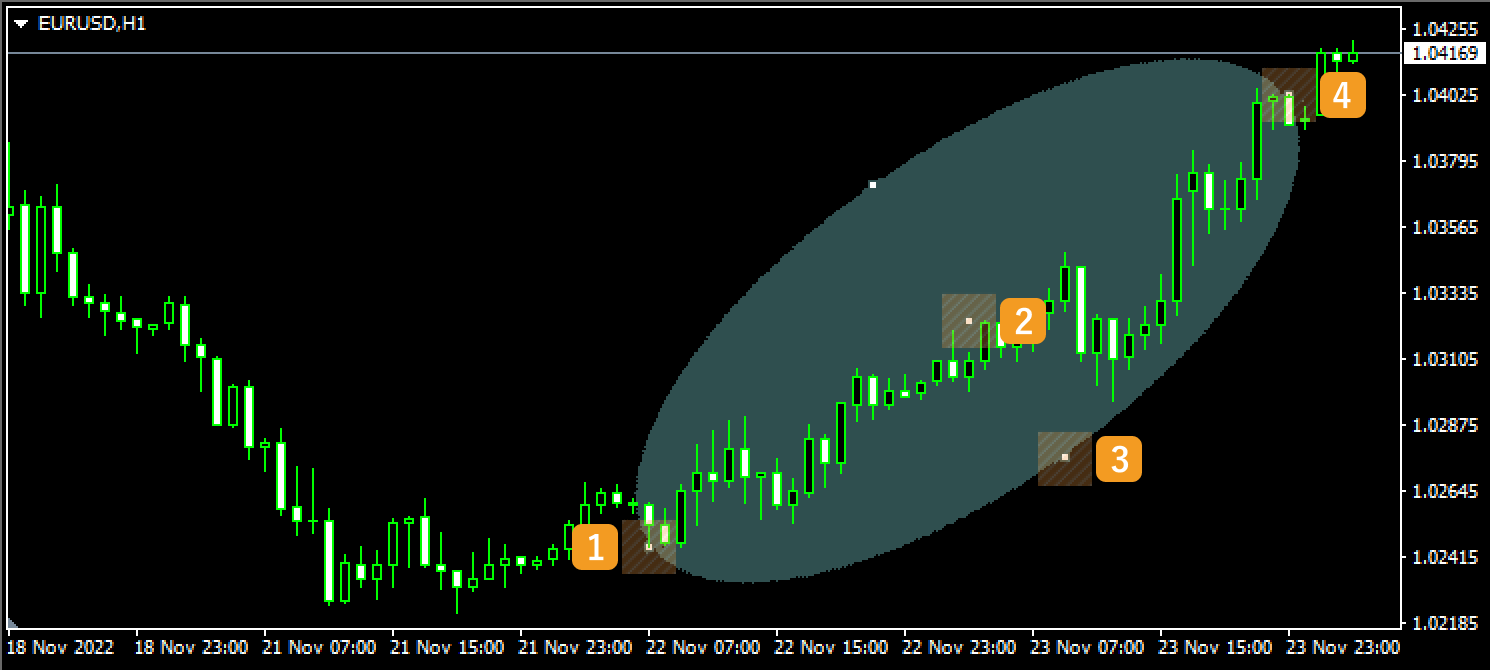
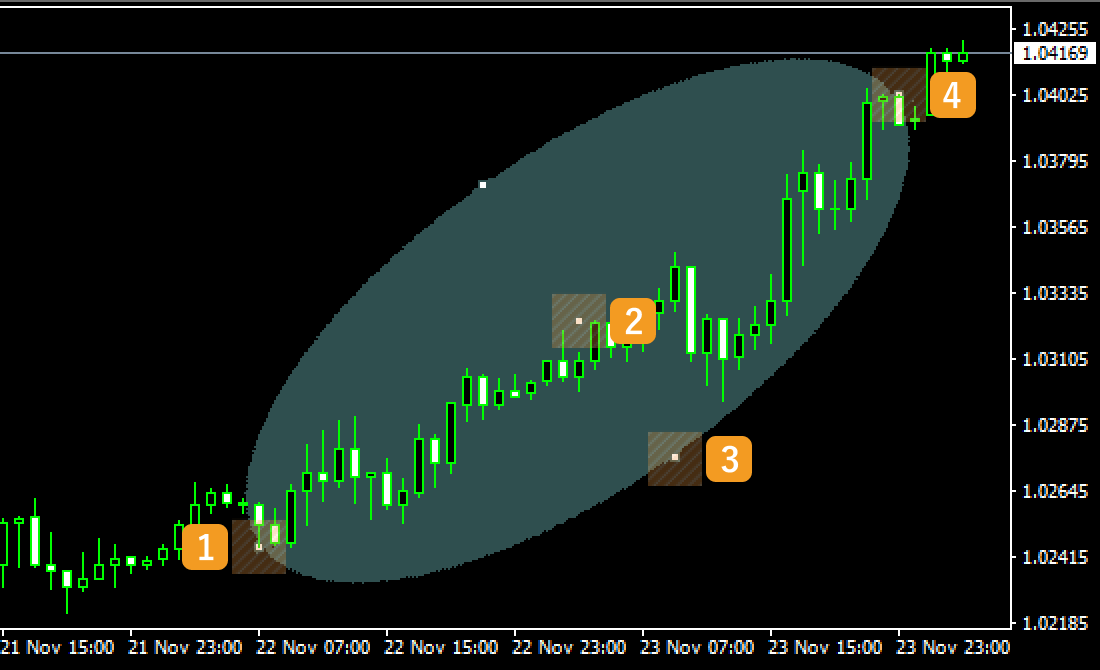
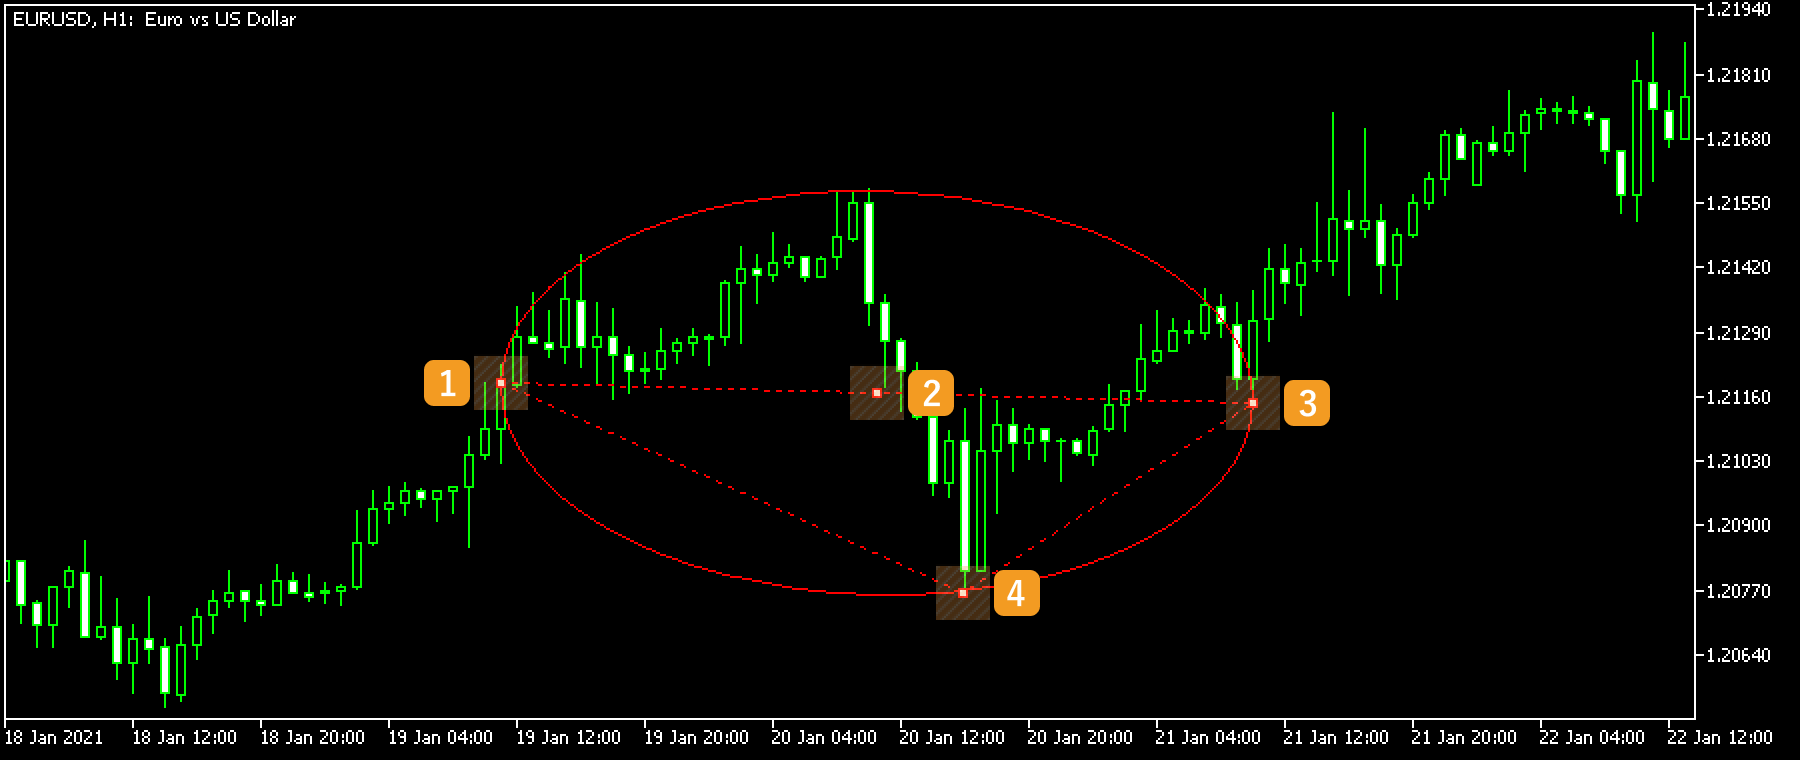
If you want to adjust the position of the shape, make sure the white dots are being displayed on the shape and move each dot as necessary. If you cannot see the white dots, double-click near the shape to display the white dots.
|
Number |
Descriptions |
|---|---|
|
1 |
Change the starting point of the shape. |
|
2 |
Change the position of the shape. |
|
3 |
Change the midpoint of the shape. |
|
4 |
Change the end point of the shape. |
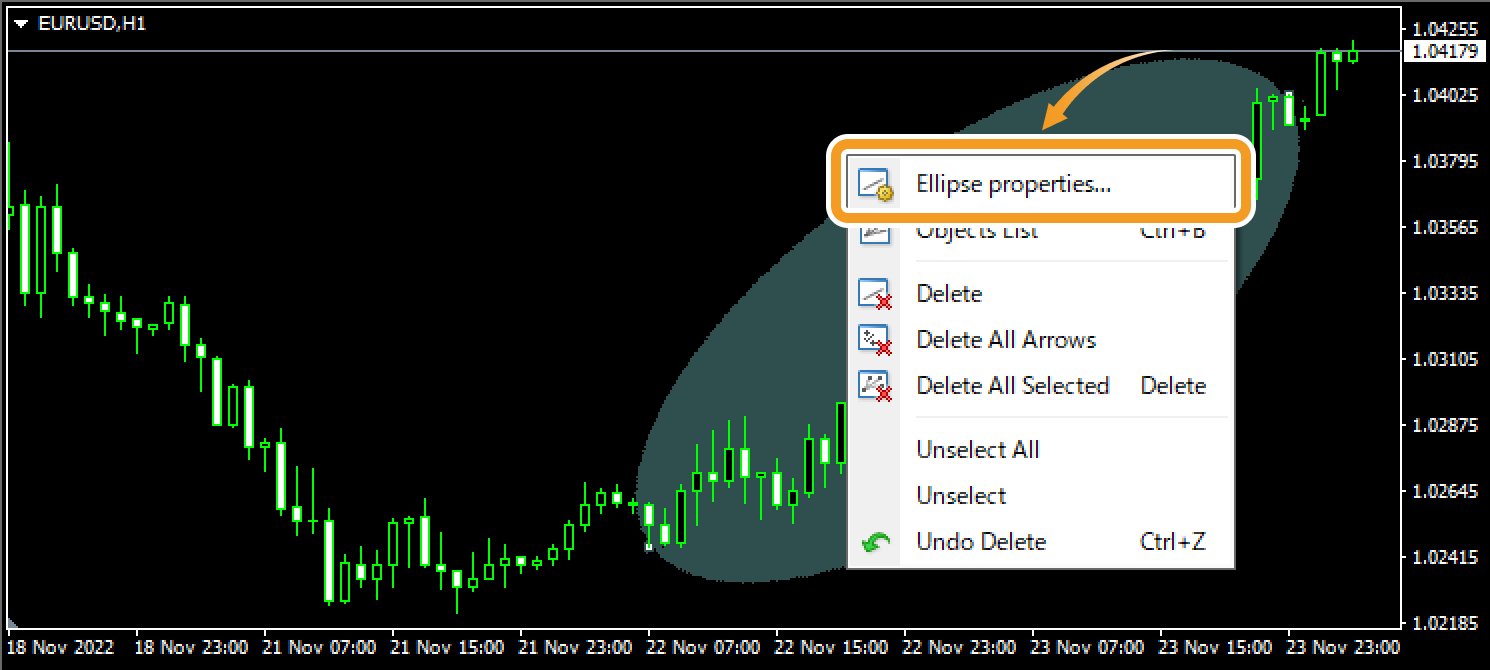
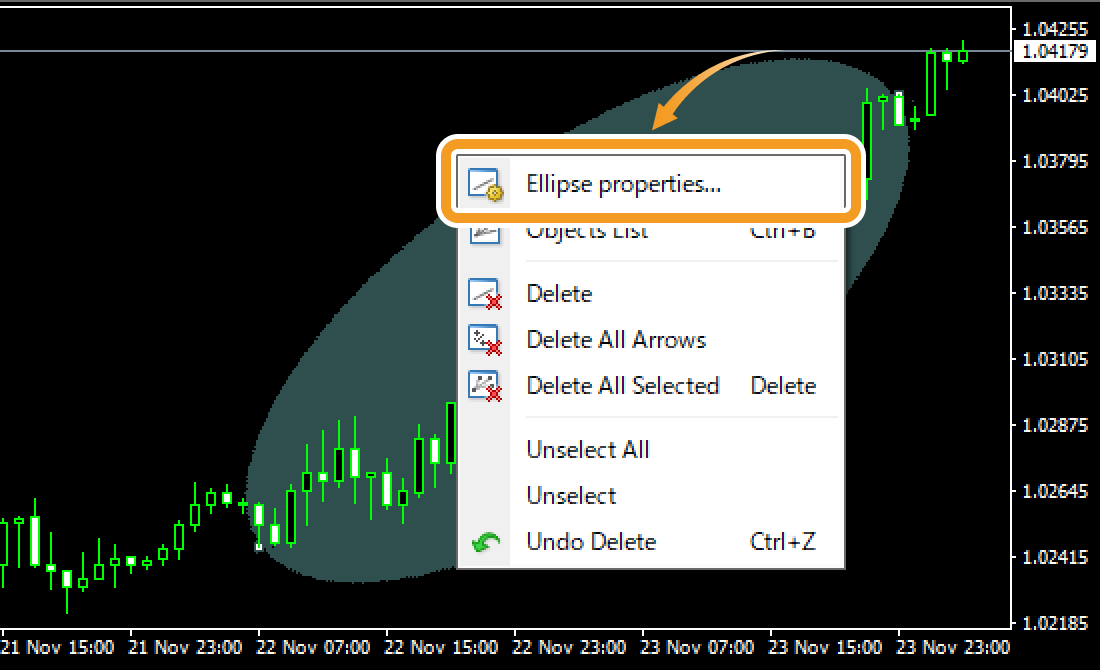
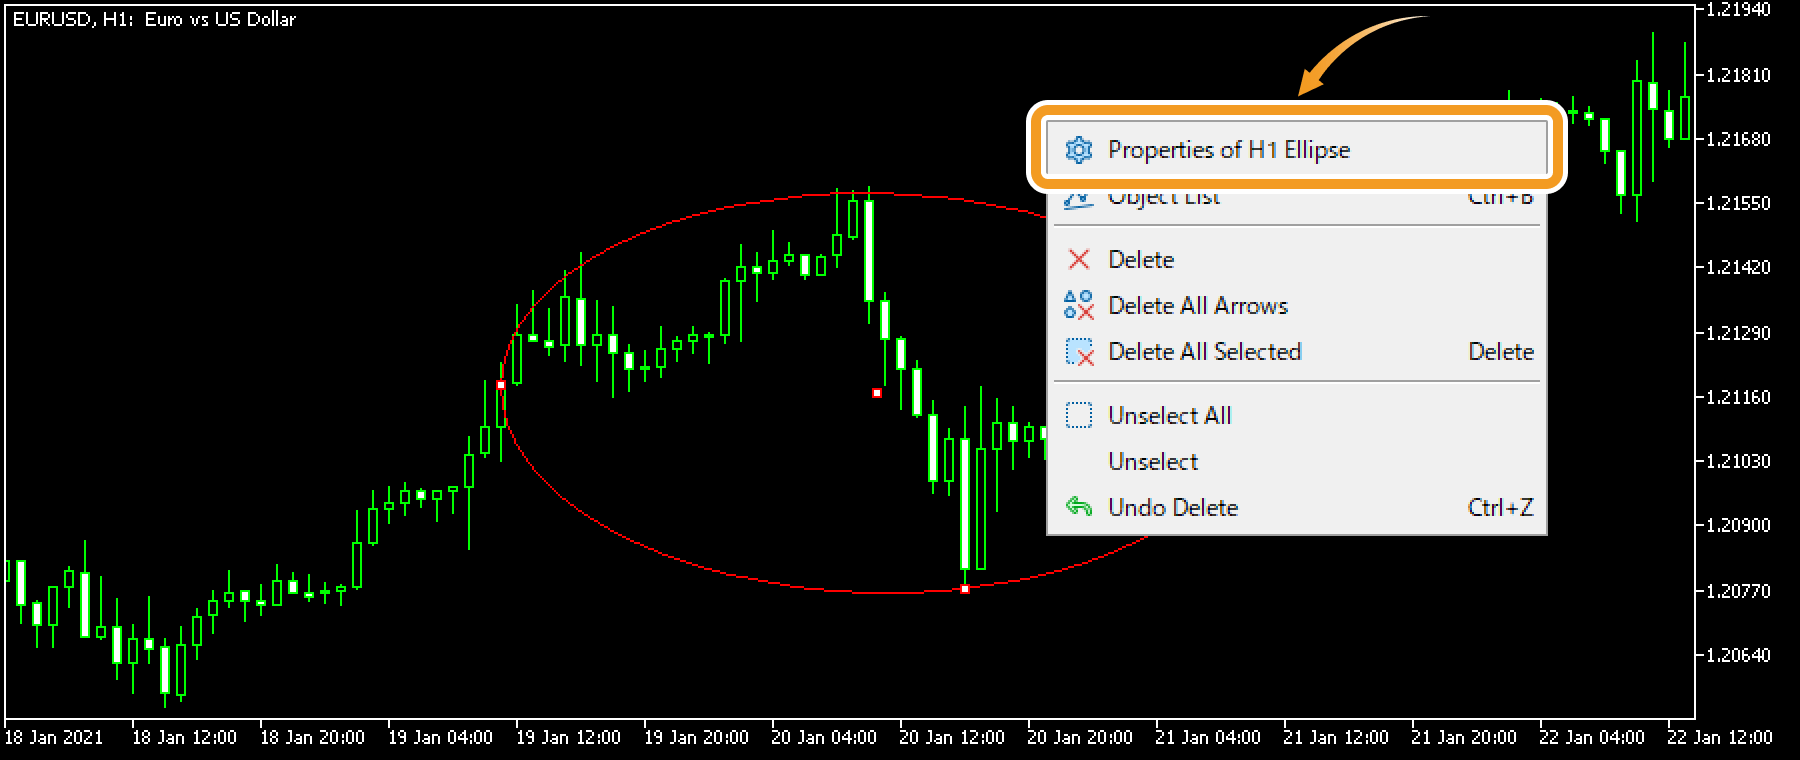
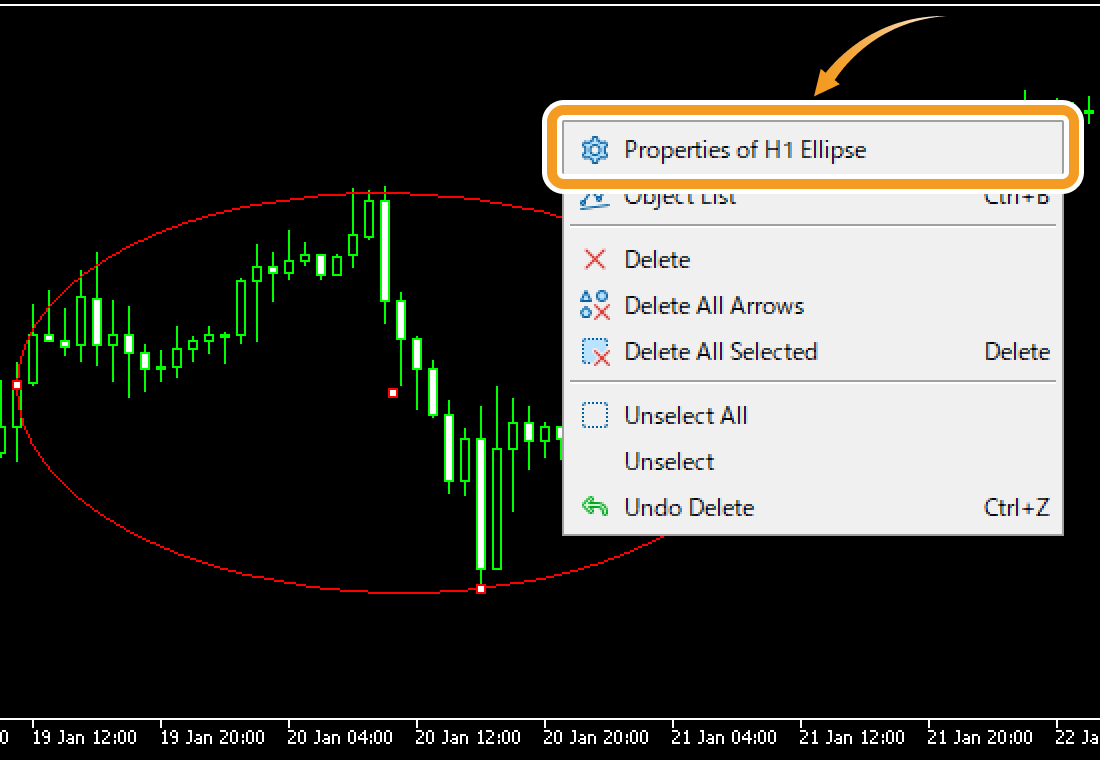
To modify the shape settings, right-click near the white point and select "(shape name) properties".
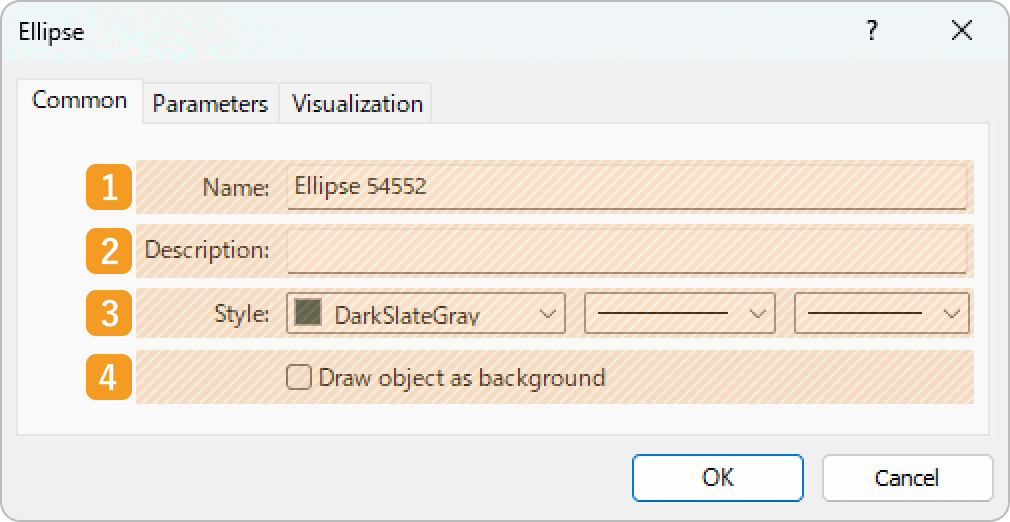
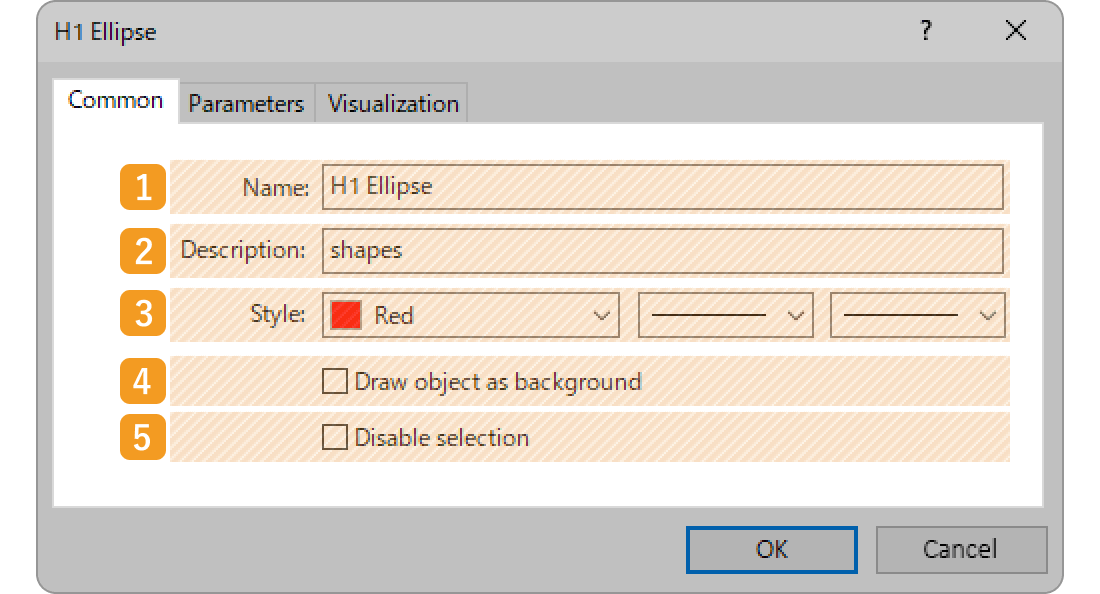
On the "Properties" window, edit the parameters in the "Common", "Parameters", and "Visualization" tabs and click "OK".
|
Number |
Item name |
Descriptions |
|---|---|---|
|
1 |
Name |
Name the shape. |
|
2 |
Description |
The description of the shape can be displayed on the chart. |
|
3 |
Style |
Set the color, line type, and line thickness for the shape. |
|
4 |
Draw object as background |
Check this box if you want to place the shape behind the chart. |
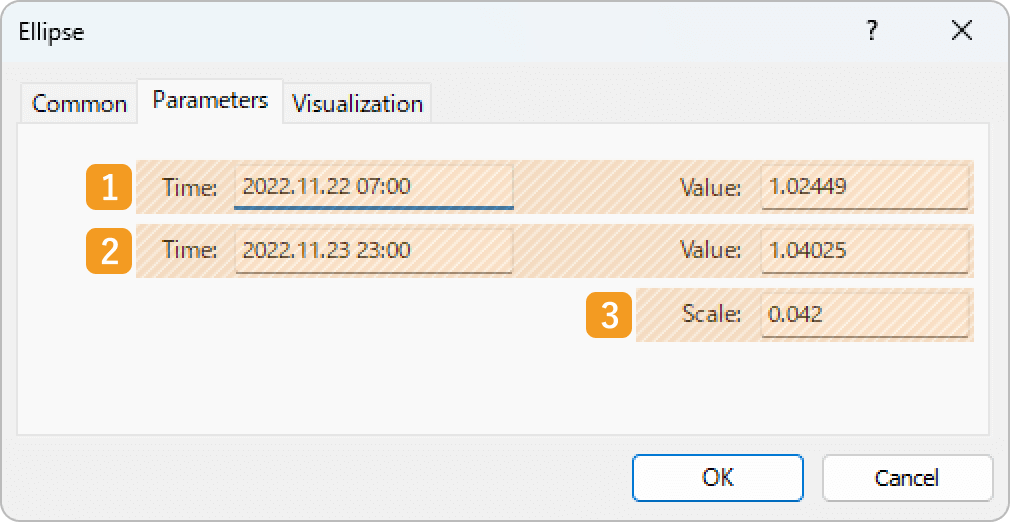
|
Number |
Item name |
Descriptions |
|---|---|---|
|
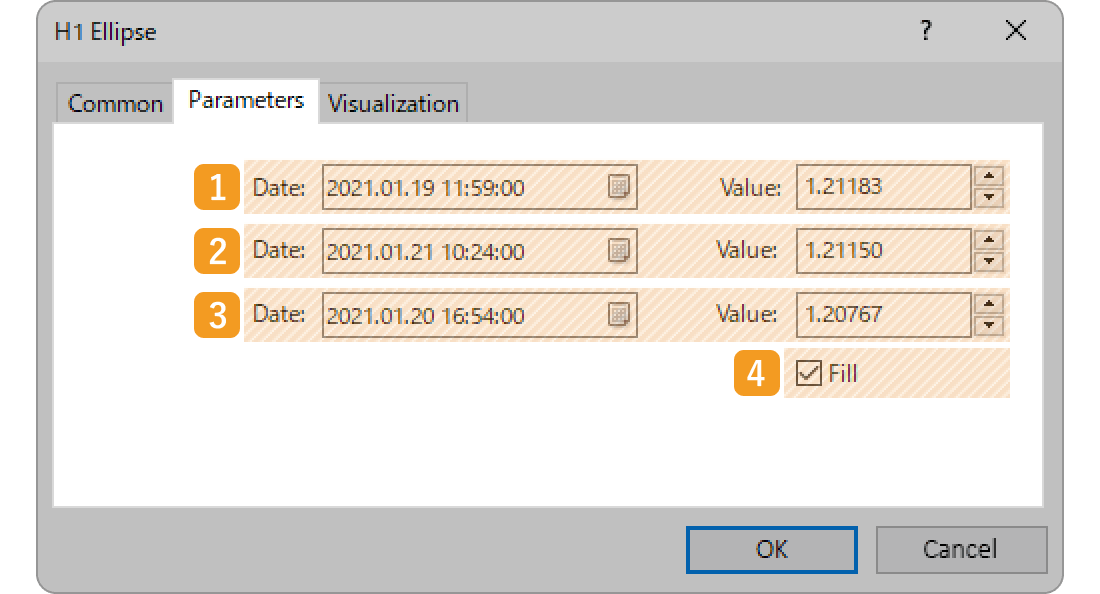
1 |
Starting point position |
Specify the starting point position by date, time, and price. |
|
2 |
End point position |
Specify the end point position by date, time, and price. For triangles, specify the midpoint position instead. |
|
3 |
Scale |
Change the length of the ellipse's minor axis. The smaller the value, the longer the minor axis. This parameter is not available for rectangles. For triangles, this parameter is to specify the end point position by date, time, and price. |
On MT5, you can choose whether to fill a shape with color or only show the border.
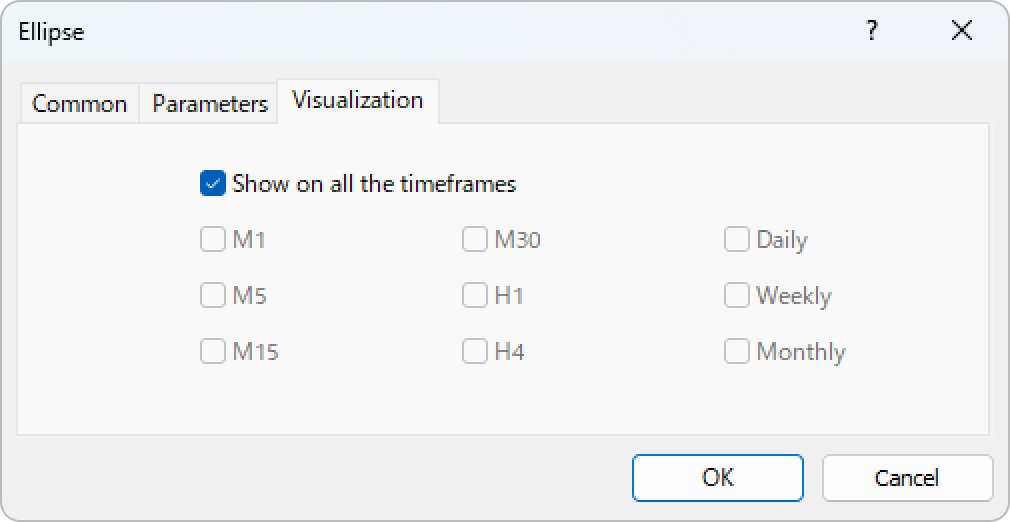
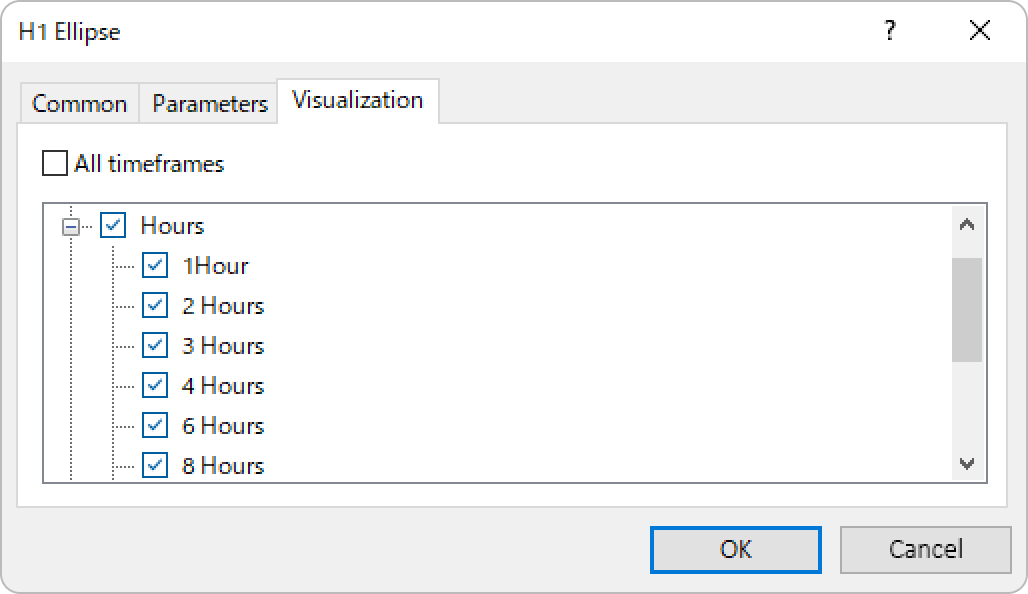
On the "Visualization" tab, you can specify the timeframes to use the shape with.
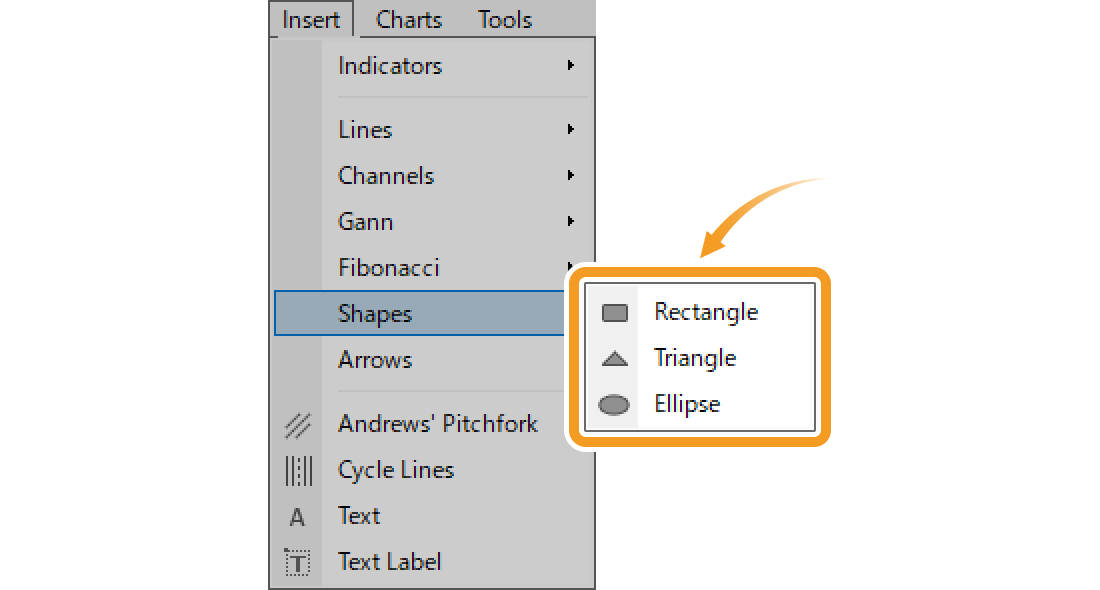
Click "Insert" in the menu. Hover the pointer over "Objects" > "Shapes" and select a shape.
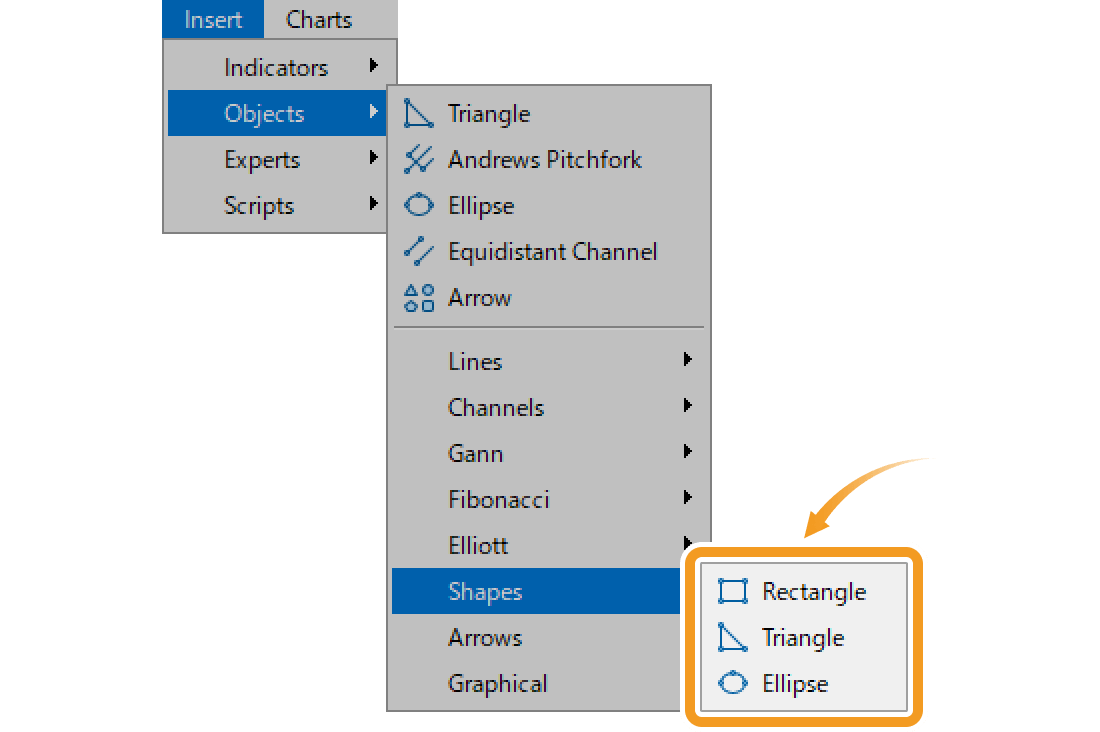
Rectangle

Highlight a specific part of the chart with a rectangle.
Triangle
Highlight a specific part of the chart with a triangle.
Ellipse

Highlight a specific part of the chart with an ellipse.
The methods for drawing vary by shape. Here, we'll cover how to draw a rectangle, triangle, and ellipse.
Click the starting point on the chart and drag it to the end point to create a rectangle.
Click the starting point of the triangle on the chart. Click again at the midpoint, then drag the pointer to the end point to draw the triangle.
Click the starting point of the ellipse on the chart and drag it to the end point to plot the major axis. Then drag the white midpoint in the direction of the minor axis to create an ellipse. If you can't find the white point on the major axis, double-click around the area with a number in the image below.
If you want to adjust the position of the shape, make sure the white dots are being displayed on the shape and move each dot as necessary. If you cannot see the white dots, double-click near the shape to display the white dots.
|
Number |
Descriptions |
|---|---|
|
1 |
Change the starting point of the shape. |
|
2 |
Change the position of the shape. |
|
3 |
Change the midpoint of the shape. |
|
4 |
Change the end point of the shape. |
To modify the shape settings, right-click near the white point and select "Properties of (shape name)".
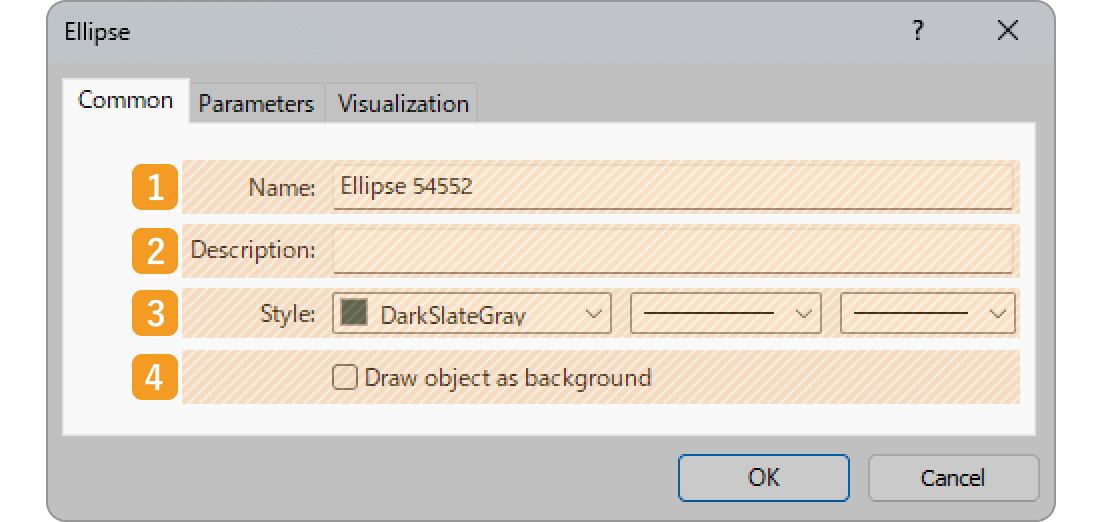
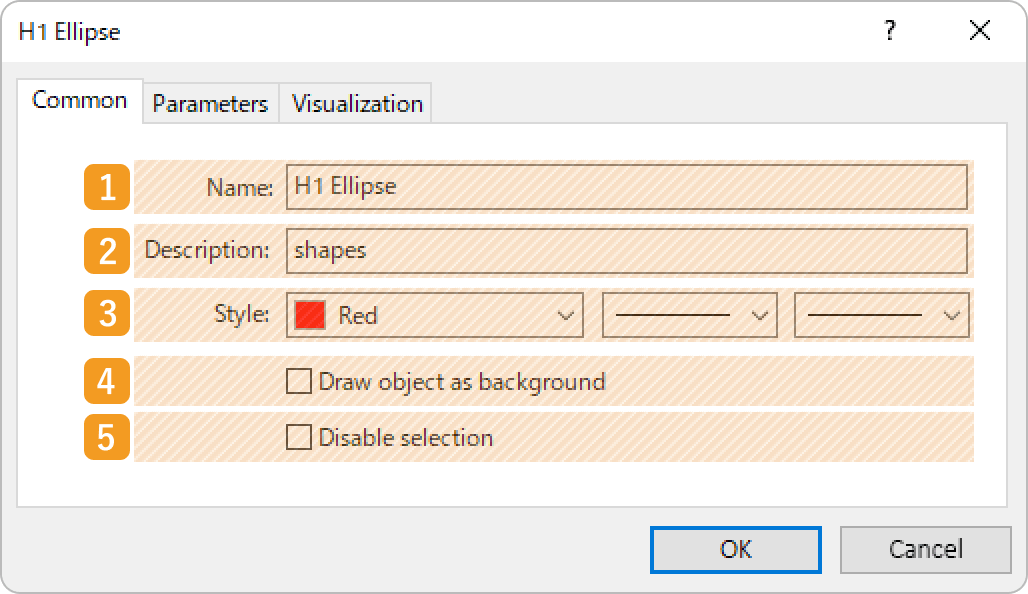
On the "Properties" window, edit the parameters in the "Common", "Parameters", and "Visualization" tabs and click "OK".
|
Number |
Item name |
Descriptions |
|---|---|---|
|
1 |
Name |
Name the shape. |
|
2 |
Description |
The description of the shape can be displayed on the chart.
|
|
3 |
Style |
Set the color, line type, and line thickness for the shape. |
|
4 |
Draw object as background |
Check this box if you want to place the shape behind the chart. |
|
5 |
Disable selection |
Check this box if you want to disable the editing of the shape. |
|
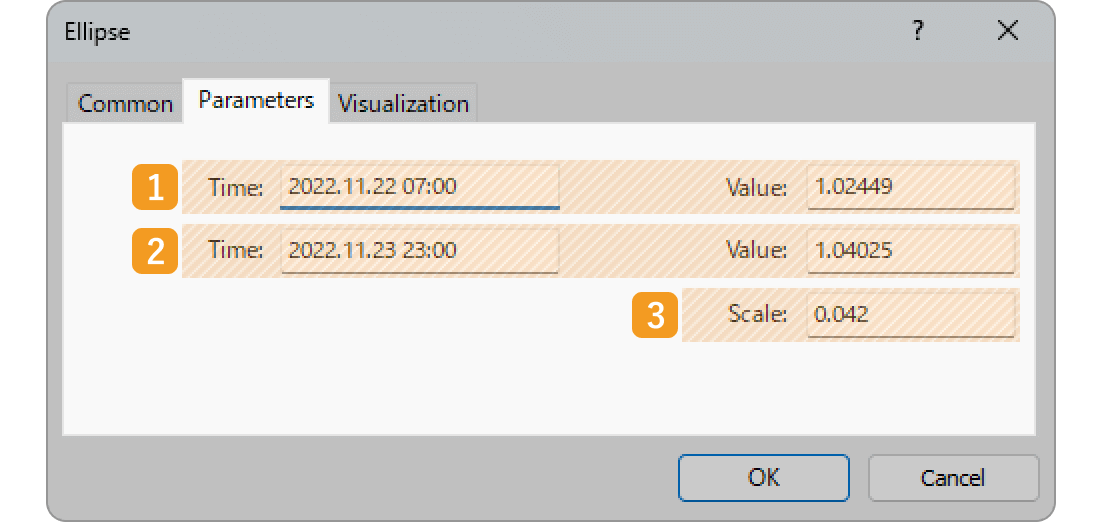
Number |
Item name |
Descriptions |
|---|---|---|
|
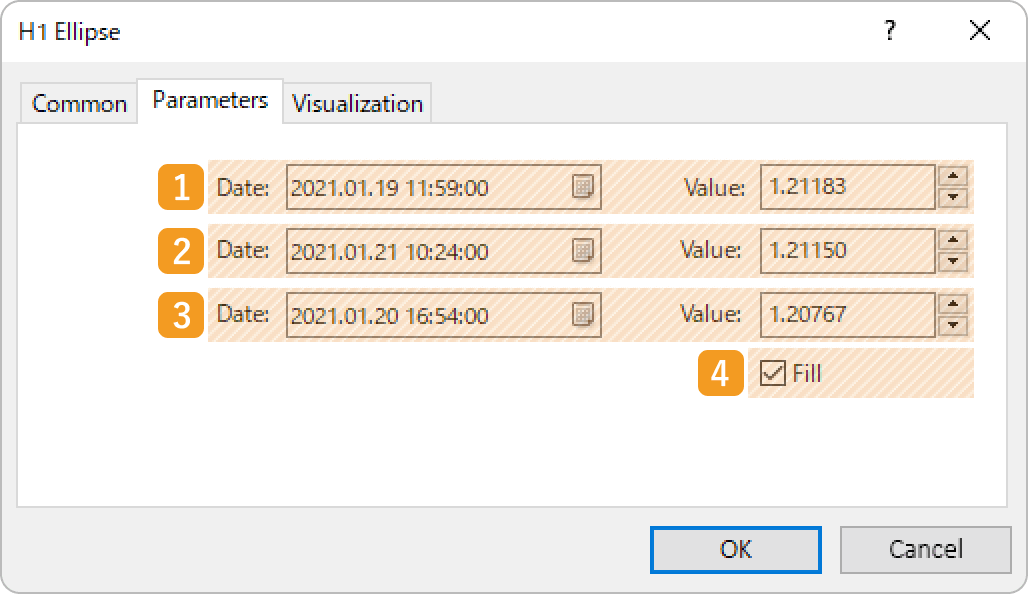
1 |
Starting point position |
Specify the starting point position by date, time, and price. |
|
2 |
Midpoint position |
Specify the midpoint position by date, time, and price. |
|
3 |
End point position |
Specify the end point position by date, time, and price. |
|
4 |
Fill |
Check this box to fill inside the shape. |
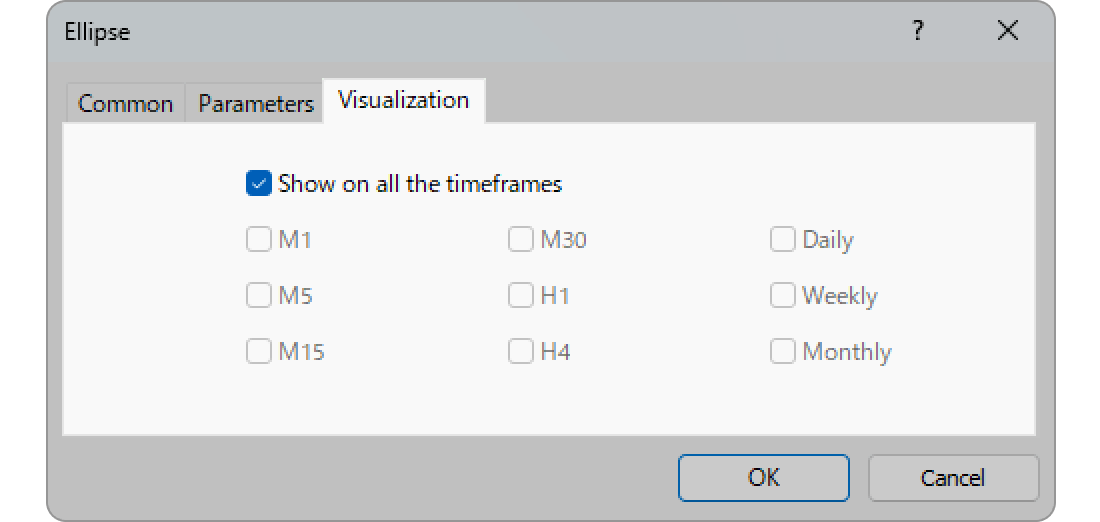
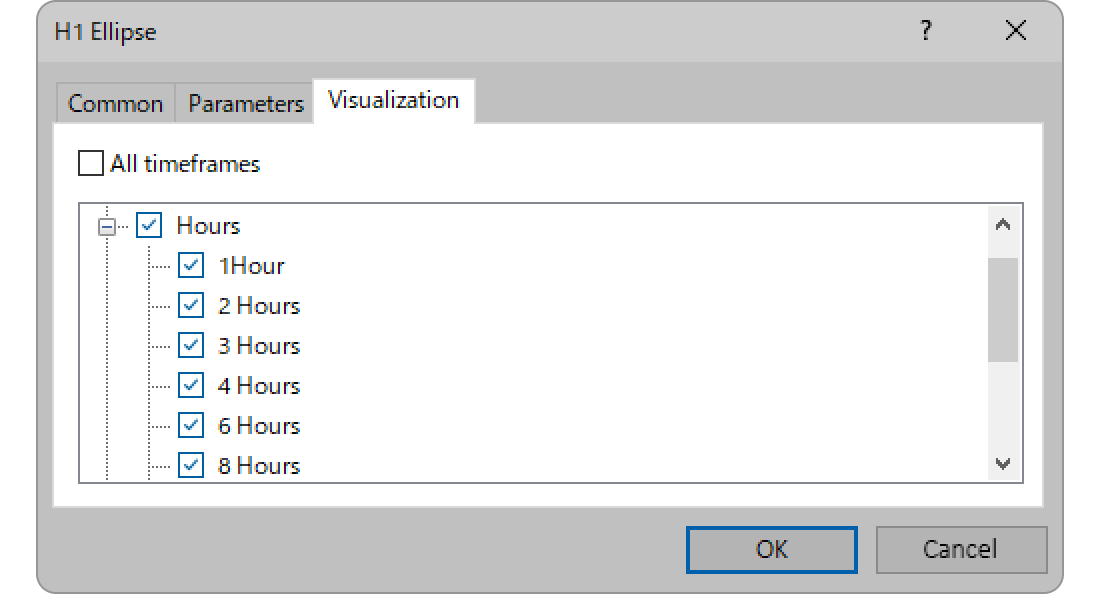
On the "Visualization" tab, you can specify the timeframes to use the shape with.
Was this article helpful?
0 out of 0 people found this article helpful.
Thank you for your feedback.