MT4/MT5: Use and customize tick chart
Windows (PC)
Windows (PC)

This article was :
published
updated
With MetaTrader4 (MT4) / MetaTrader5 (MT5), you can check the tick charts from the Market Watch or when placing a new order. A tick is the smallest unit of data that represents price. And a tick chart shows the price fluctuation in ticks. Tick charts detect price movement faster than any other chart, so it's often used for short-term trading such as scalping (a trading strategy in which traders profit off small price changes).
Here, we'll take a look at how to use and customize the tick charts in the Market Watch screen.
Switch between MT4/MT5 tabs to check the steps for each.
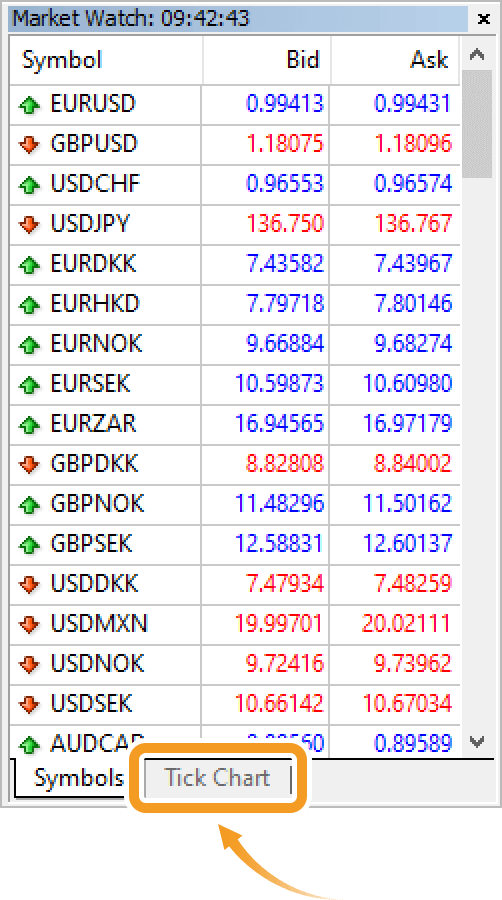
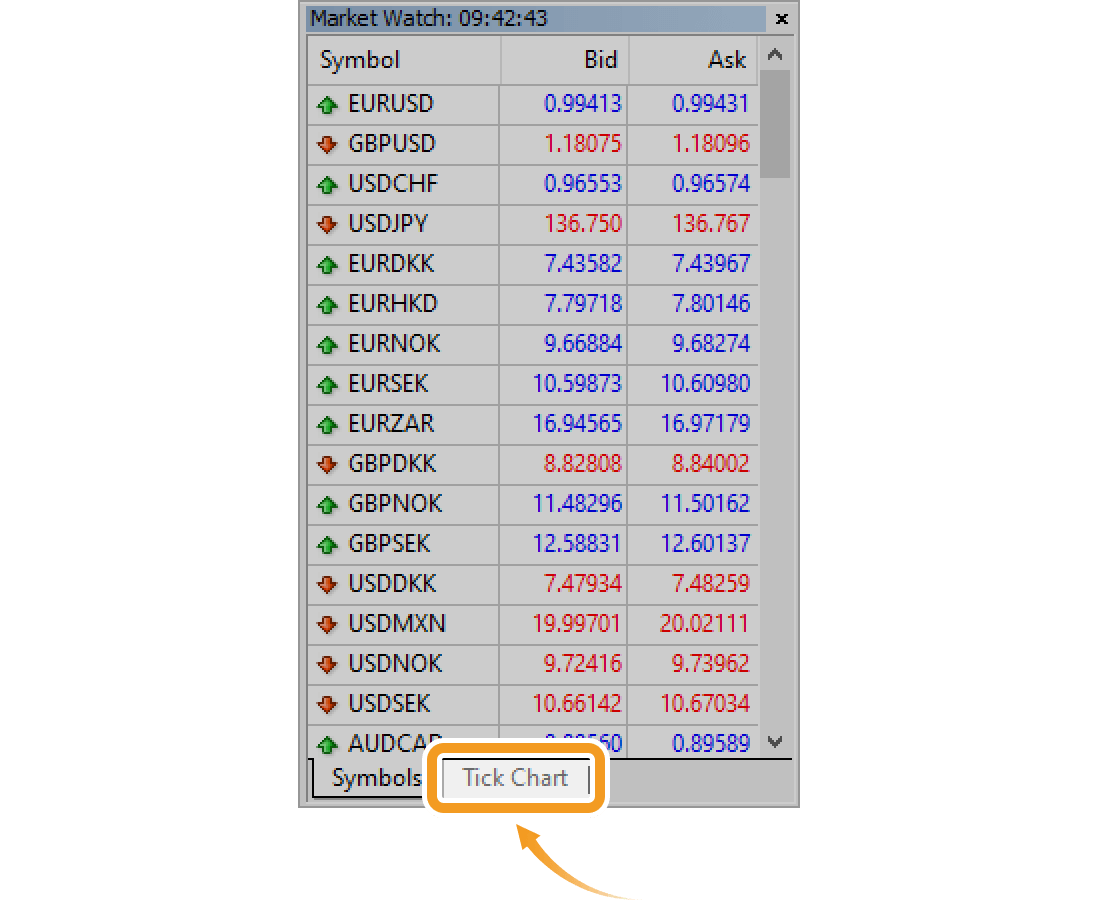
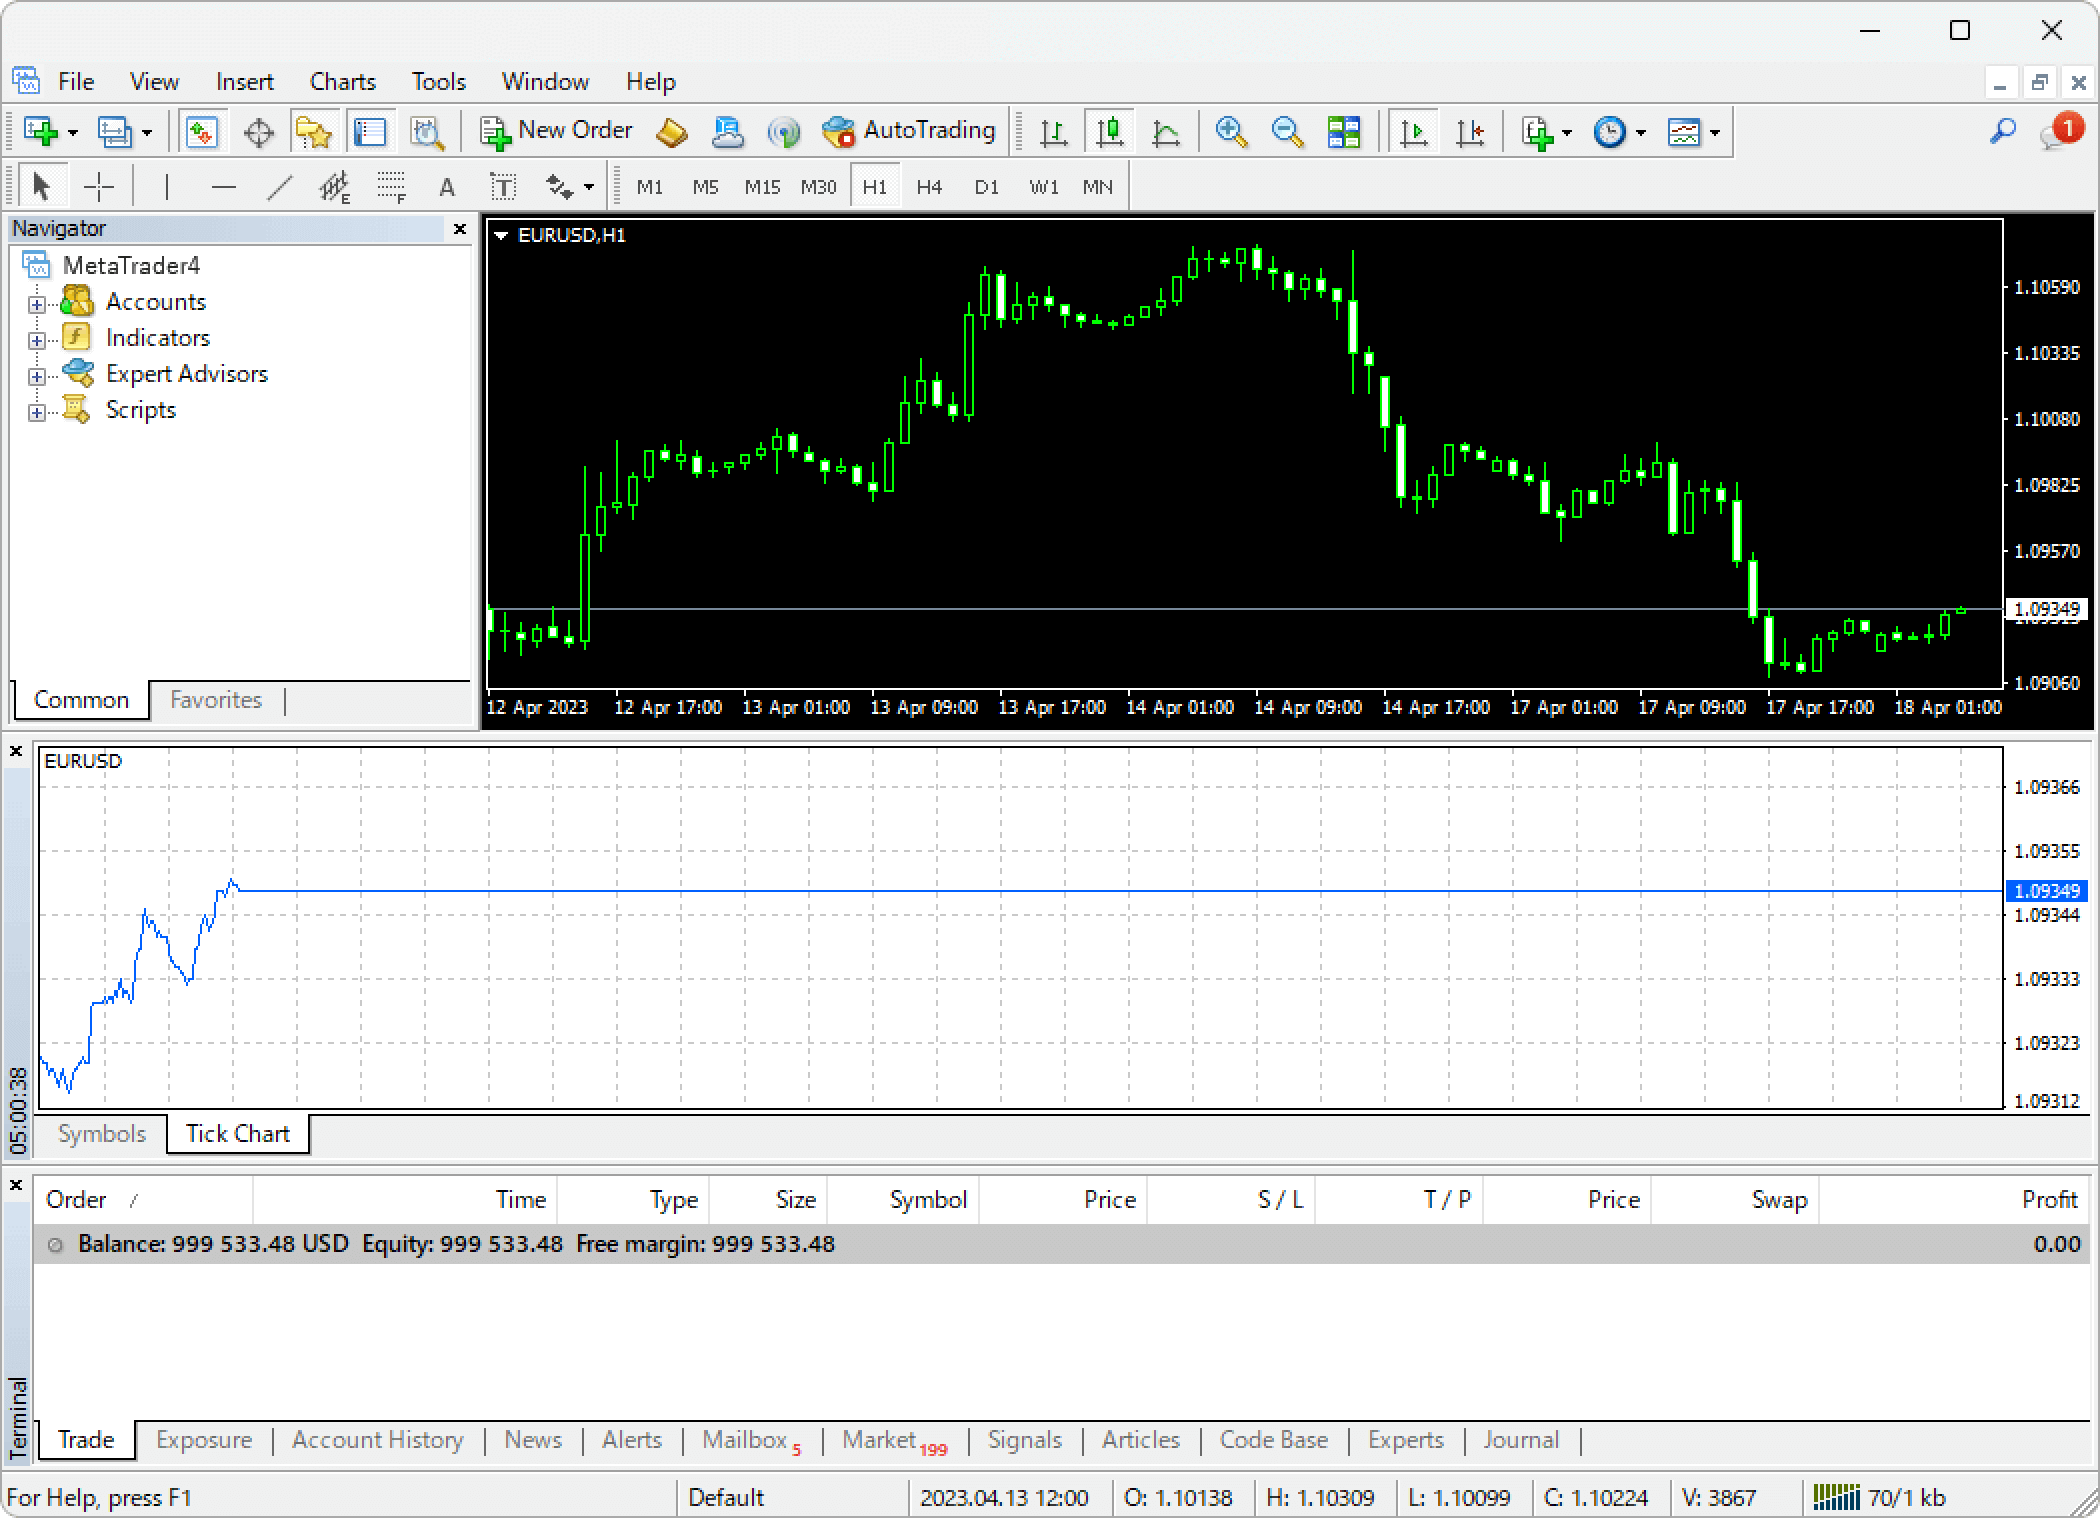
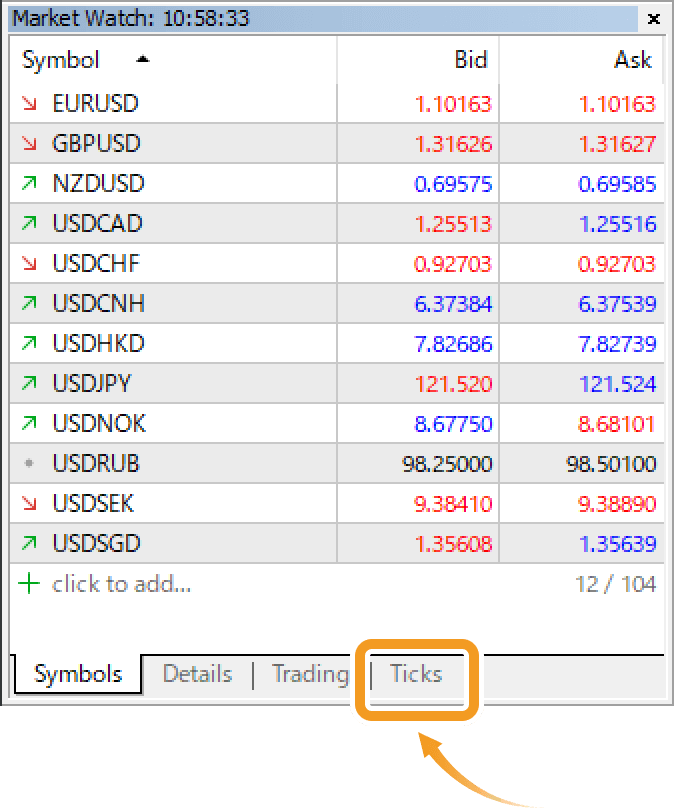
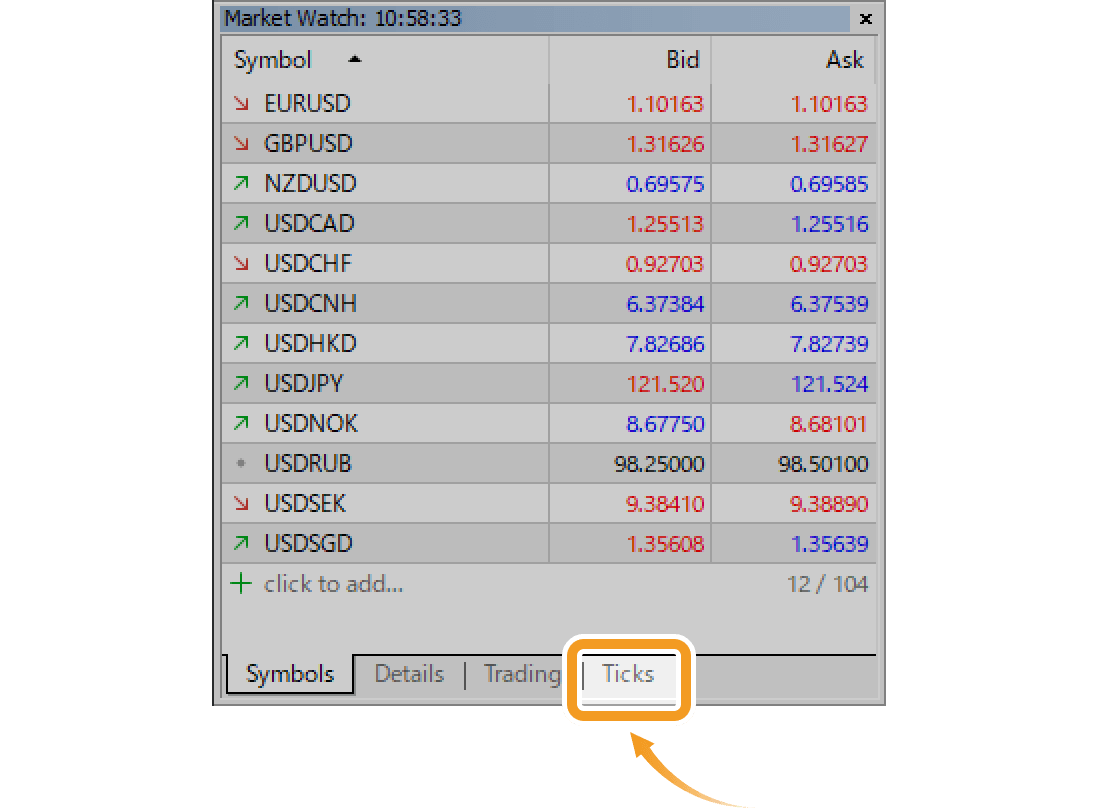
In the "Symbols" tab of the Markets Watch, click the symbol for which you wish to display a tick chart, and switch to the "Tick Chart" tab.
Related article: Manage symbols in Market Watch
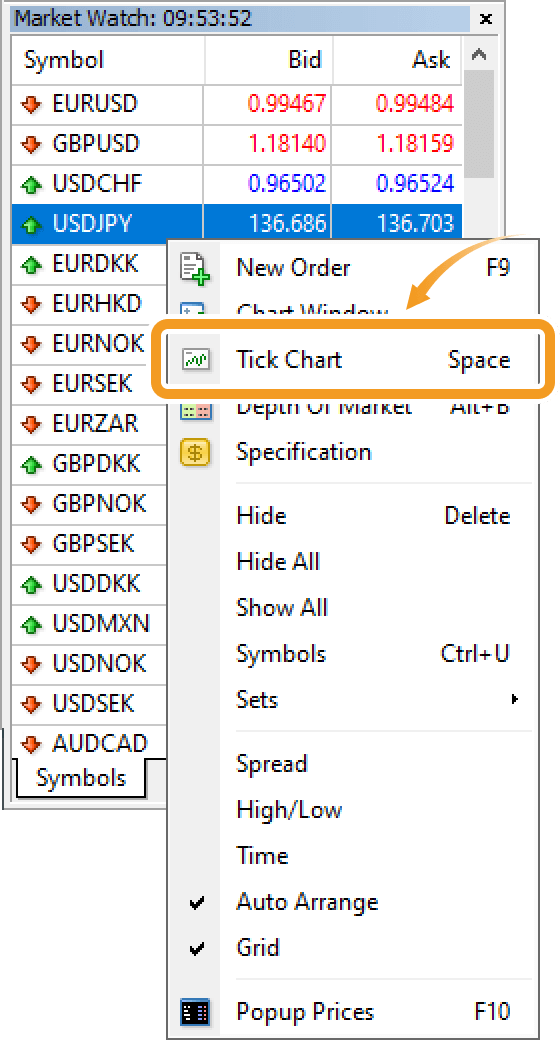
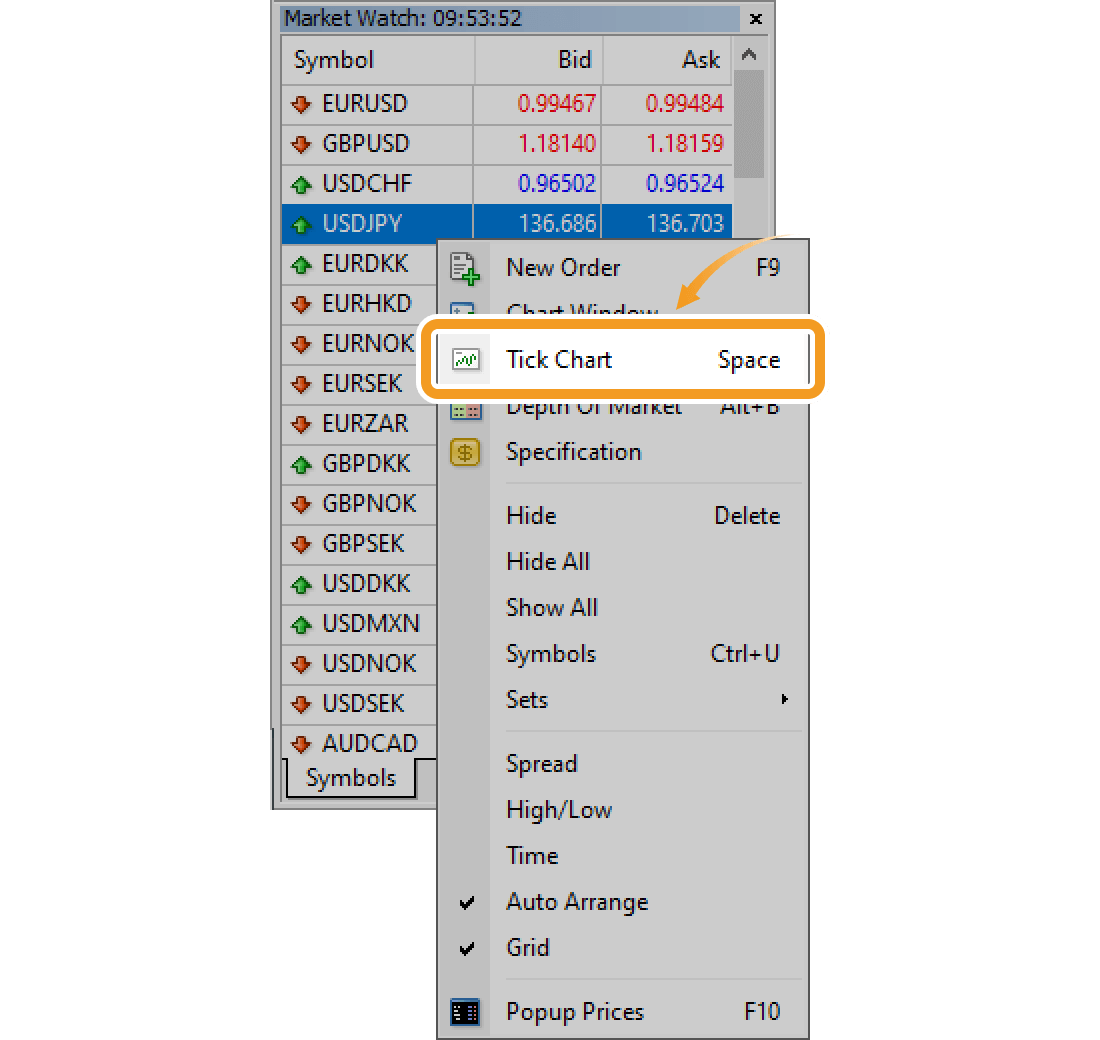
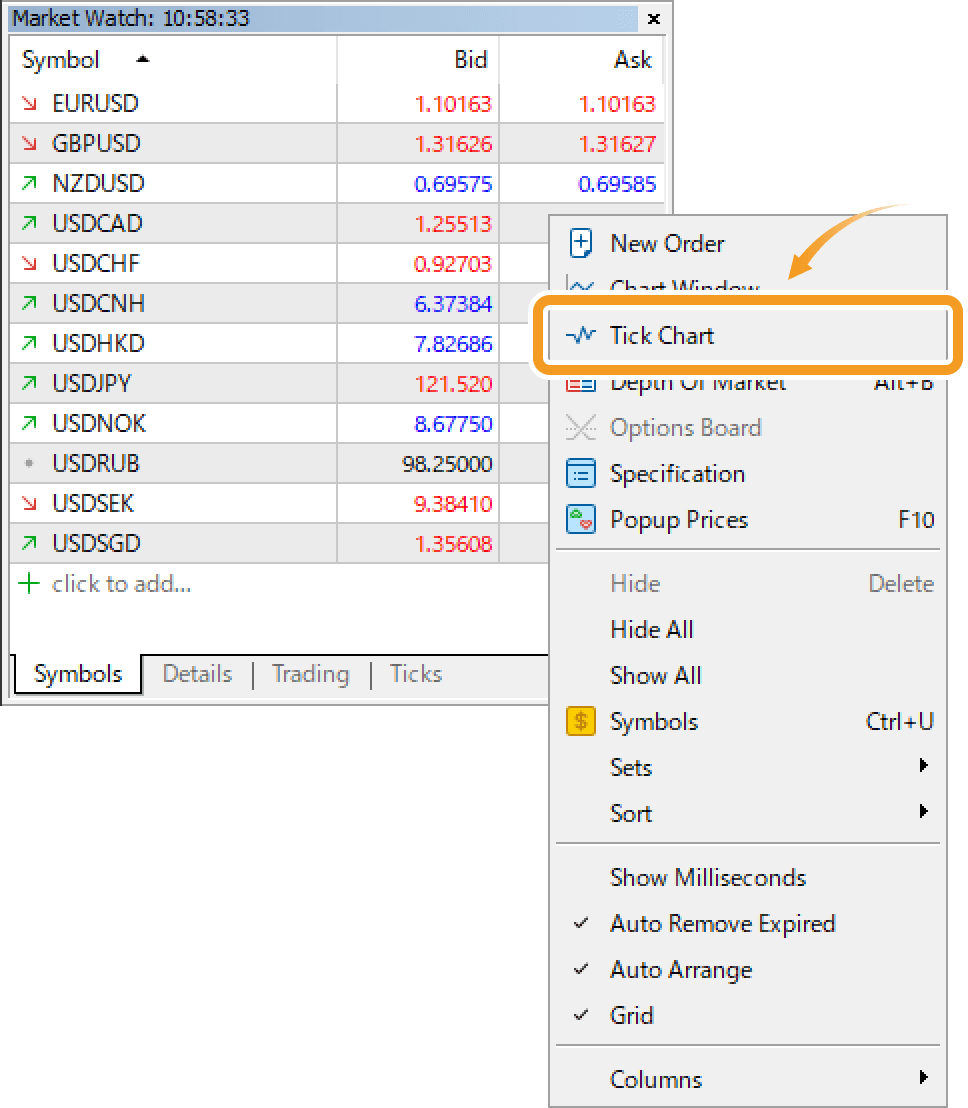
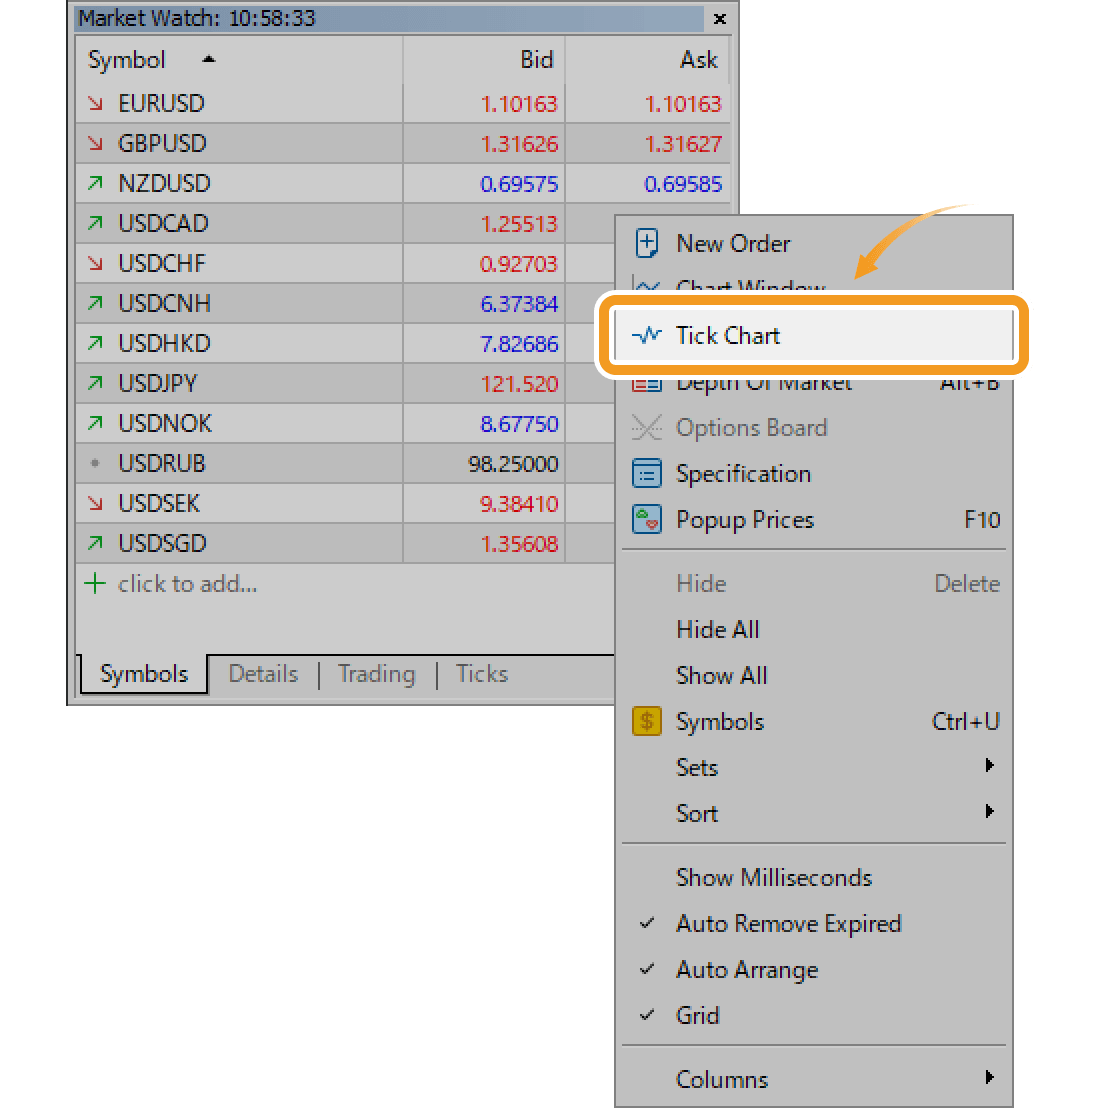
Or, in the "Symbols" tab of the Market Watch, right-click the symbol for which you wish to display the tick chart and select "Tick Chart".
For stocks and other instruments traded on exchanges, a high volume indicates that they are traded actively. Meanwhile, in the case of forex, the market is decentralized, which means that the trading volume cannot be measured. Therefore, tick volume, the number of price movements, is used as a substitute for trading volume assuming that the higher the tick volume, the more active the market is.
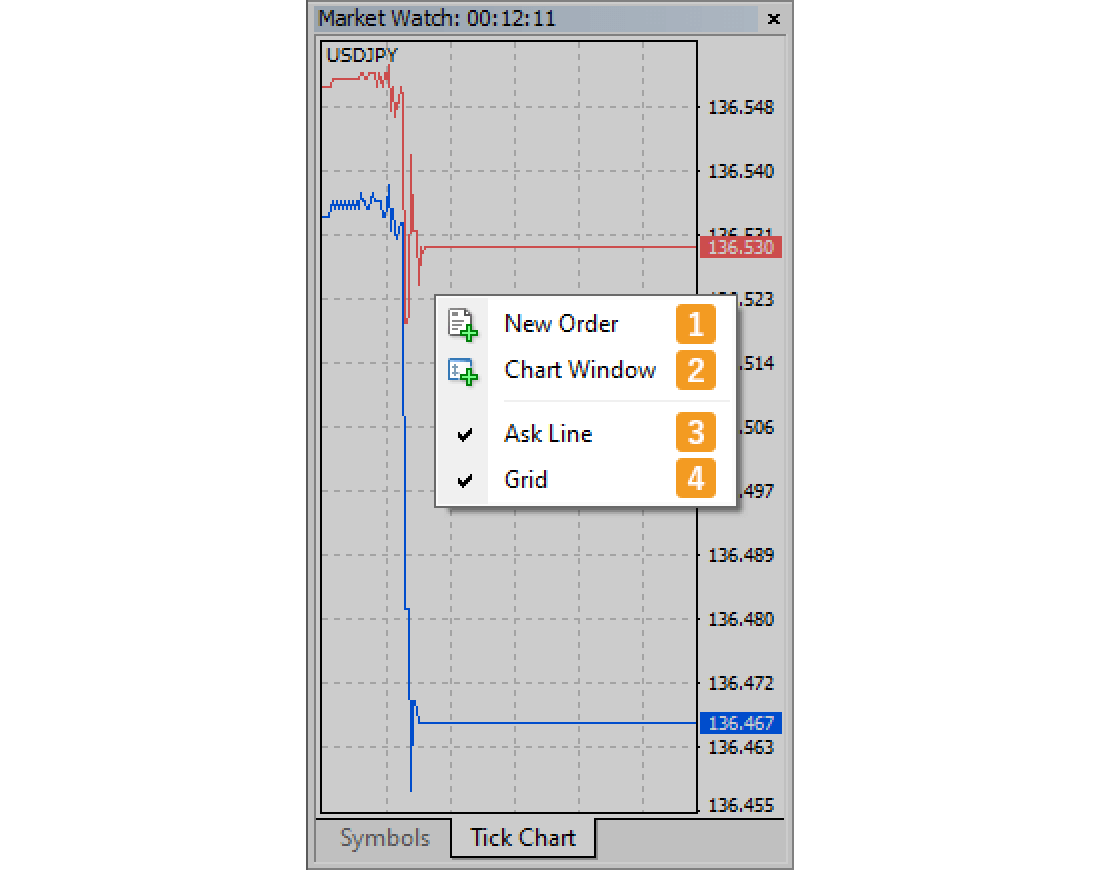
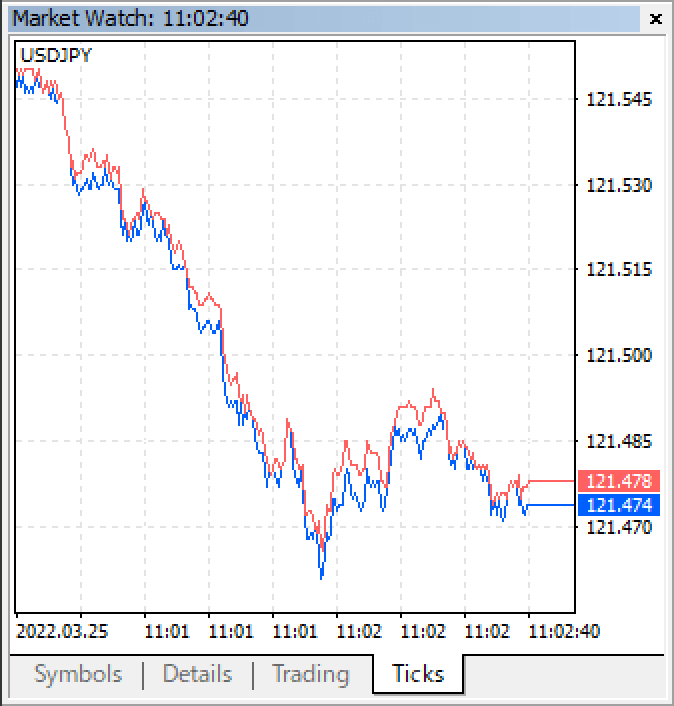
The tick chart for the symbol of your choice will be displayed in the Market Watch.
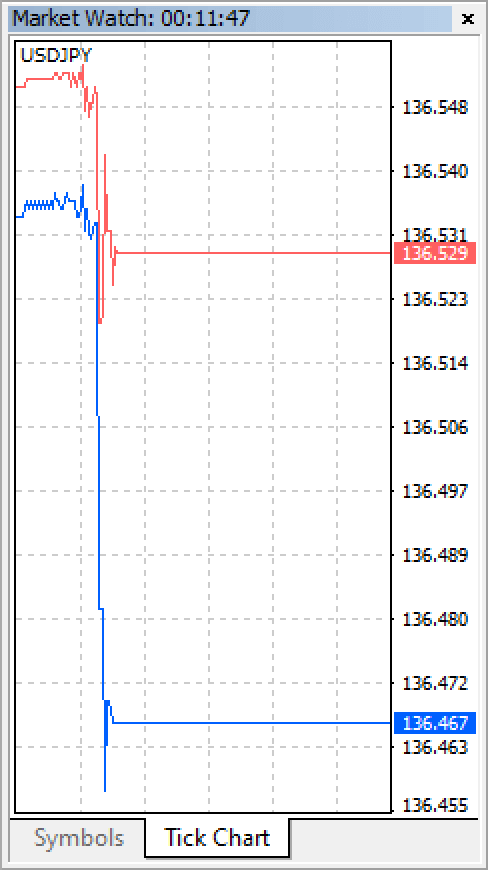
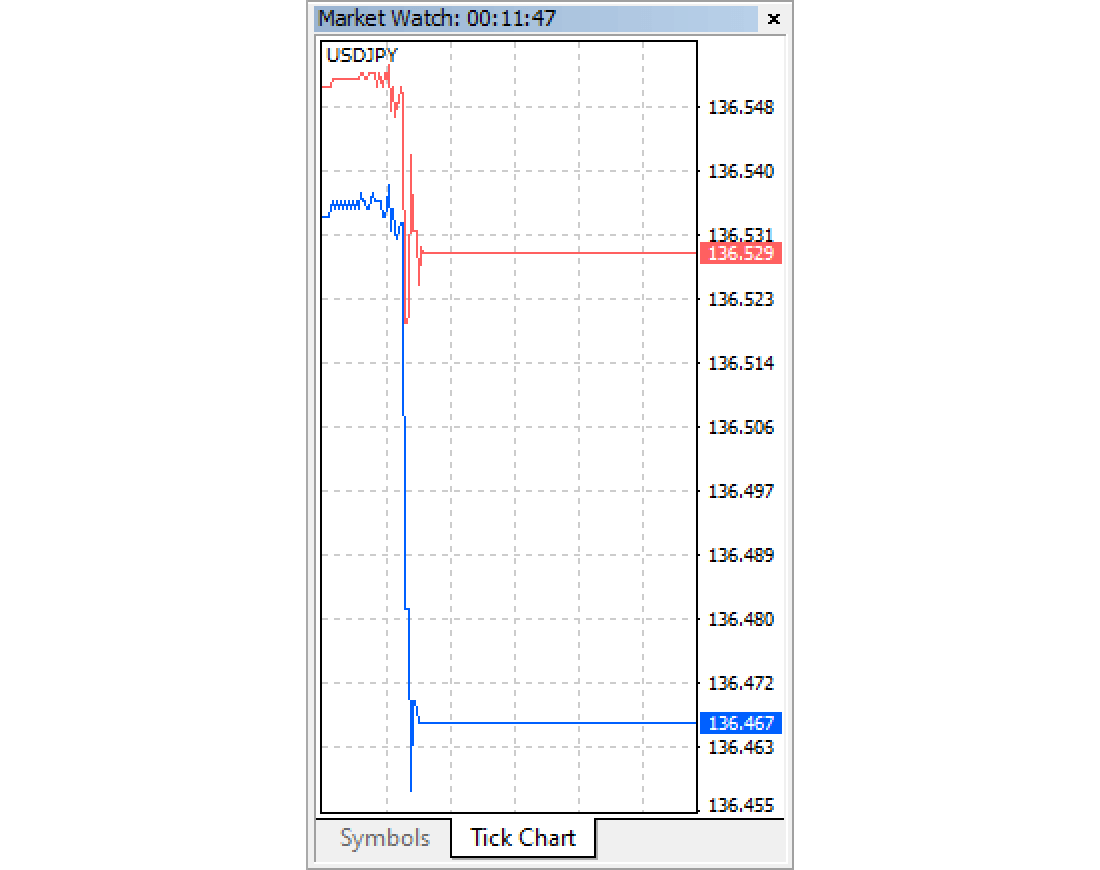
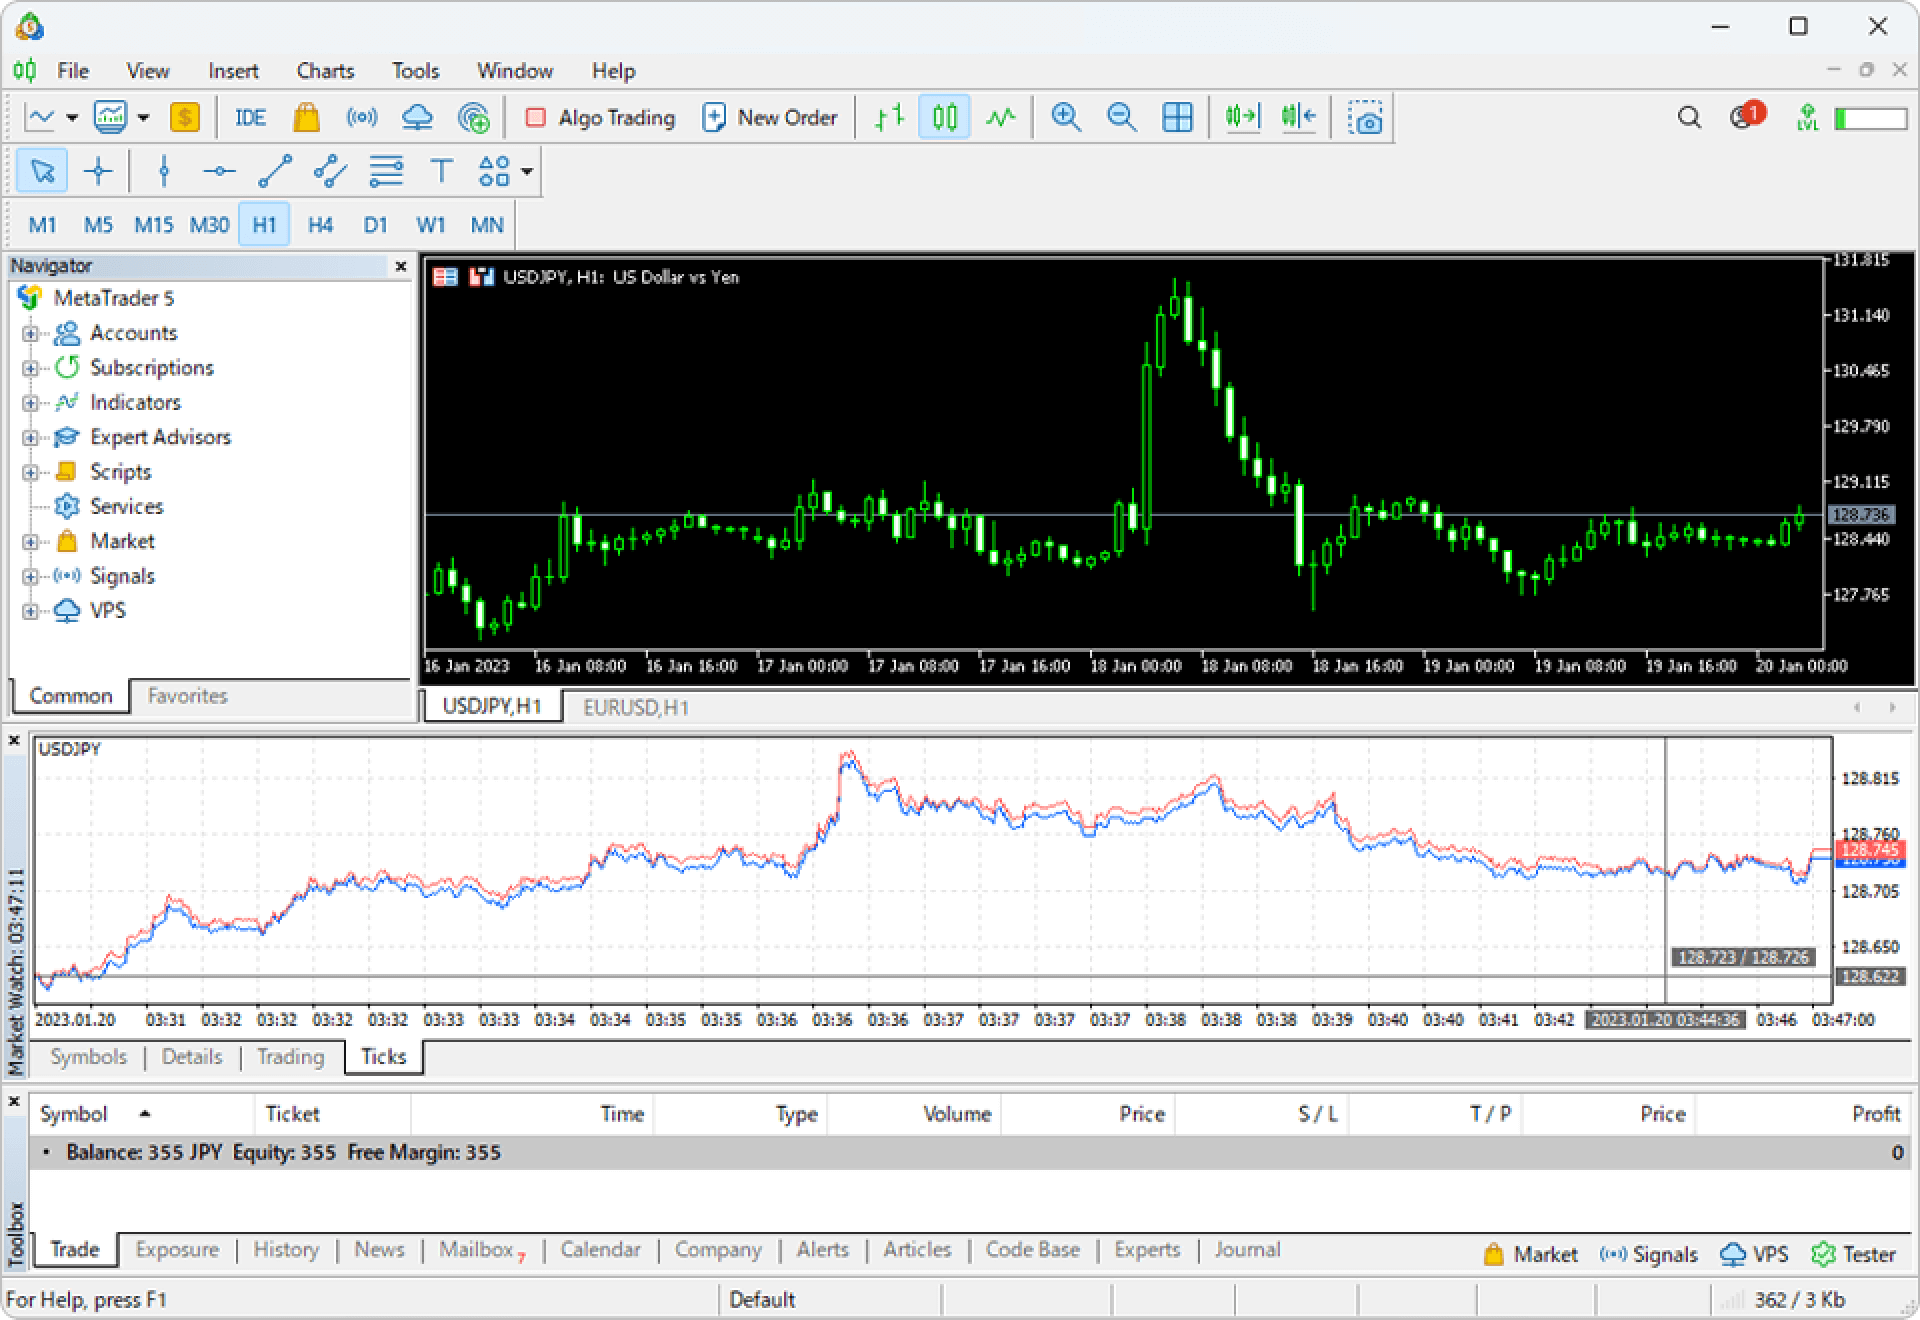
You can change the shape and position of the Market Watch window as you prefer. Placing the tick chart right below the main chart facilitates finding entry points.

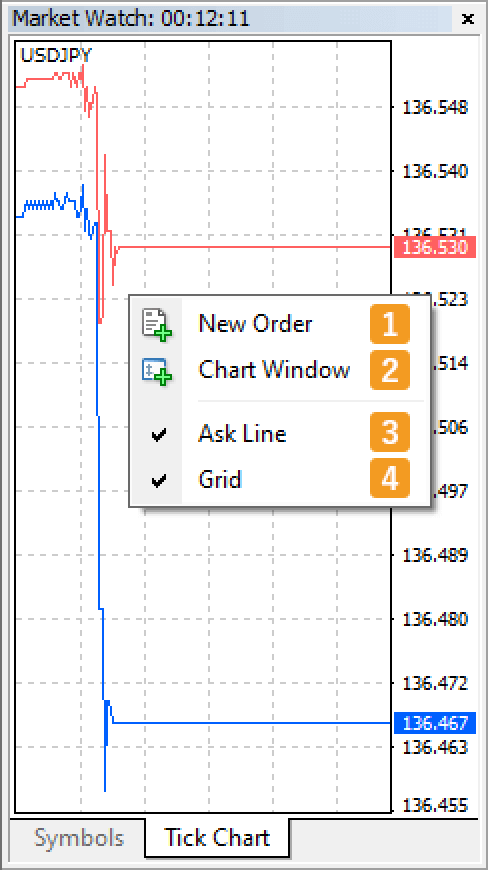
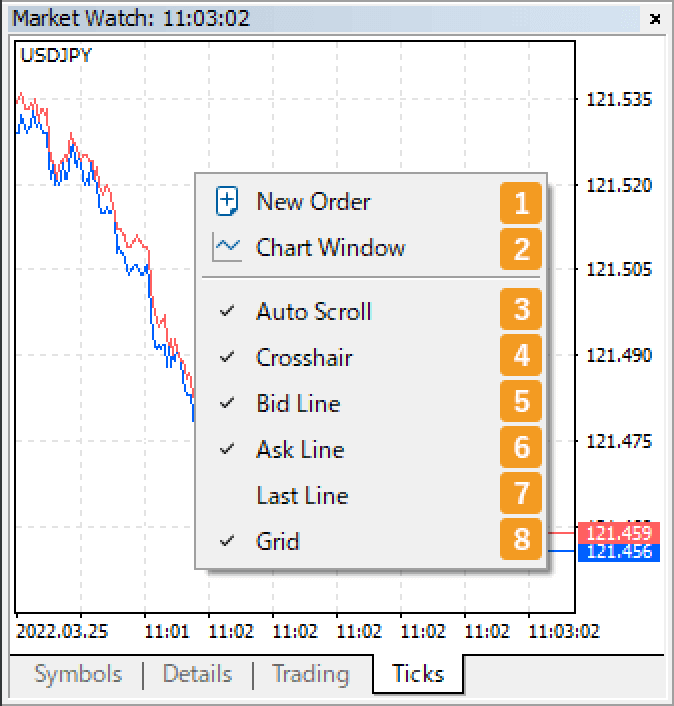
To set up the tick chart, right-click on it and select the item you want to configure from the context menu.
|
Number |
Item name |
Description |
|---|---|---|
|
1 |
New Order |
Display the new order window. |
|
2 |
Chart Window |
Display the chart for the symbol. |
|
3 |
Ask Line |
Show/hide the Ask price line (red) on the tick chart. |
|
4 |
Grid |
Show/hide gridlines on the tick chart. |
In the "Symbols" tab of the Markets Watch, click the symbol for which you wish to display a tick chart, and switch to the "Ticks" tab.
Related article: Manage symbols in Market Watch
Or, right-click the symbol for which you wish to display the tick chart and select "Tick Chart".
For stocks and other instruments traded on exchanges, a high volume indicates that they are traded actively. Meanwhile, in the case of forex, the market is decentralized, which means that the trading volume cannot be measured. Therefore, tick volume, the number of price movements, is used as a substitute for trading volume assuming that the higher the tick volume, the more active the market is.
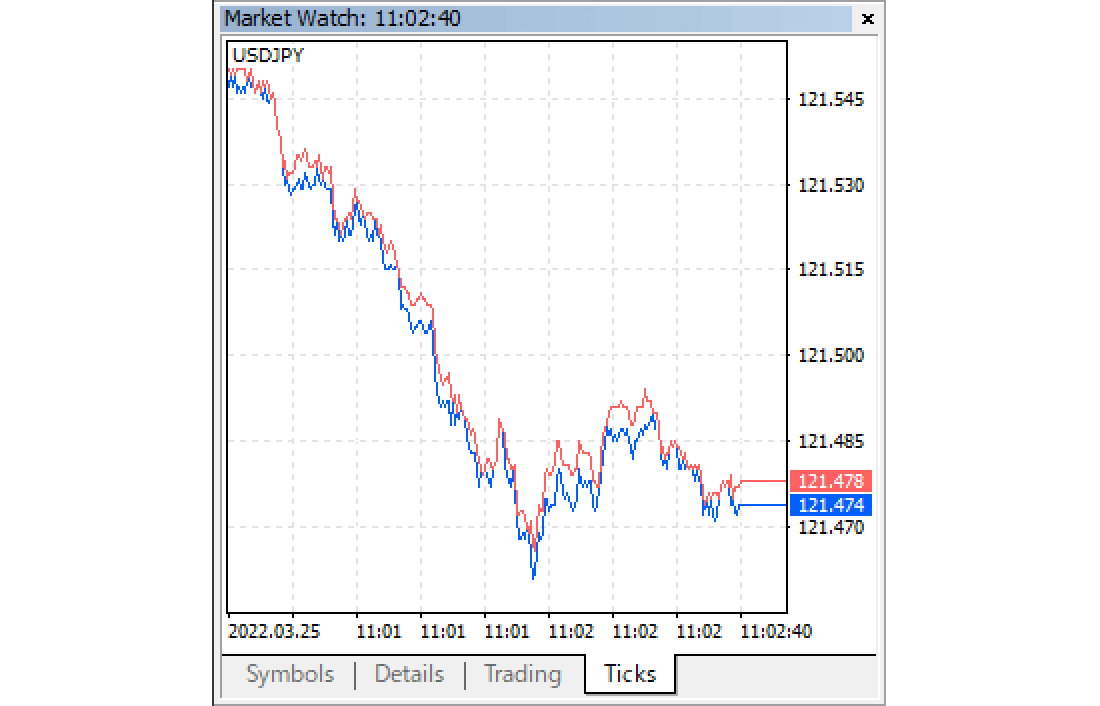
The tick chart for the symbol of your choice will be displayed in the Market Watch.
You can change the shape and position of the Market Watch window as you prefer. Placing the tick chart right below the main chart facilitates finding entry points.

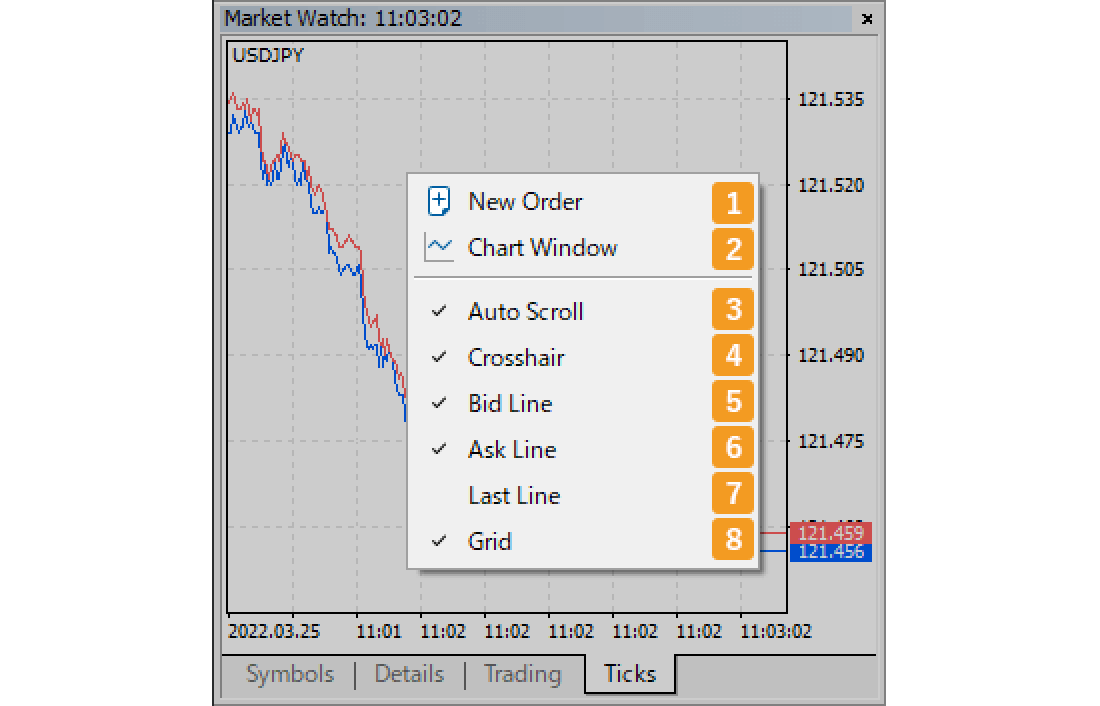
To set up the tick chart, right-click on it and select the item you want to configure from the context menu.
|
Number |
Item name |
Description |
|---|---|---|
|
1 |
New Order |
Display a new order window. |
|
2 |
Chart Window |
Display the chart for the symbol. |
|
3 |
Auto Scroll |
Enable/disable the auto scroll for the tick chart. |
|
4 |
Crosshair |
Show/hide the crosshair on the tick chart. You can check the Bid/Ask prices at a specific time by moving it on the chart. |
|
5 |
Bid Line |
Show/hide the Bid price (blue) on the tick chart. |
|
6 |
Ask Line |
Show/hide the Ask price (red) on the tick chart. |
|
7 |
Last Line |
Show/hide the last traded price (light green). If the broker doesn't provide the last price, it won't be displayed regardless of this setting. |
|
8 |
Grid |
Show/hide gridlines on the tick chart. |
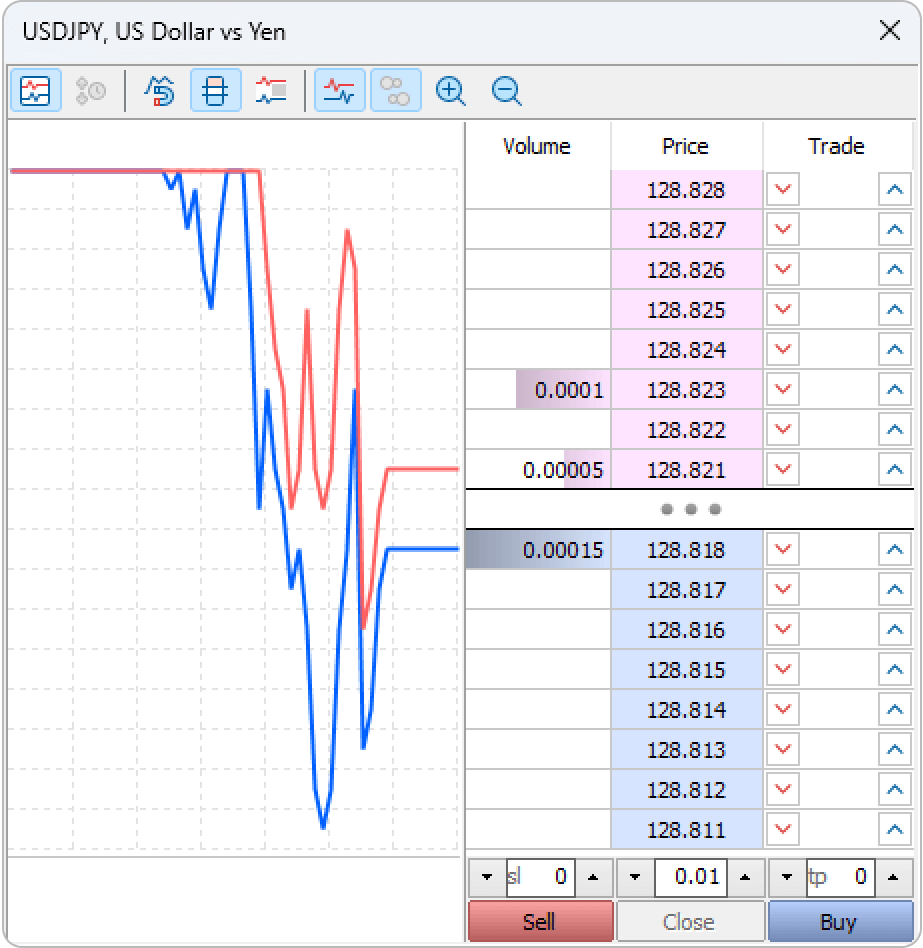
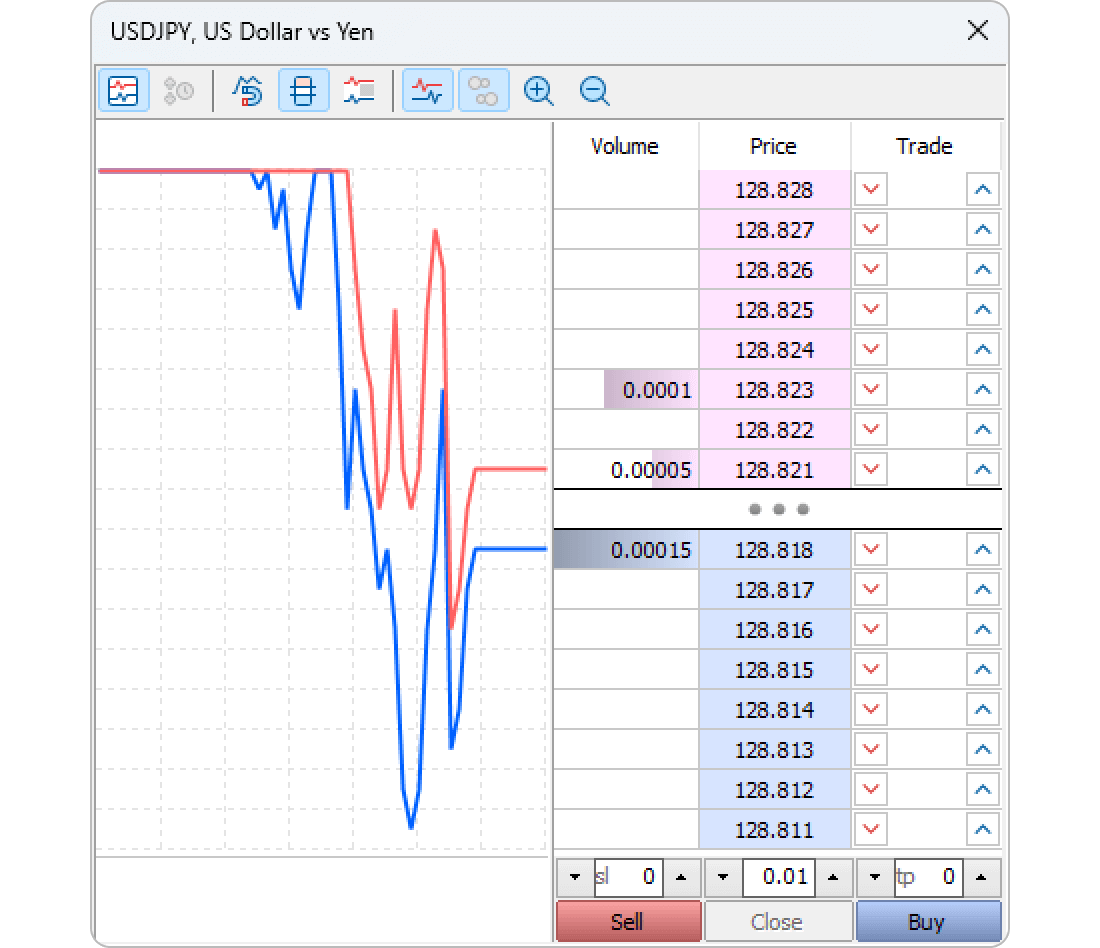
On MT5, the Depth of Market window also shows the tick chart. Although the number of brokers providing the depth of mark data is limited, the Depth of Market window is also useful as a scalping tool.
Was this article helpful?
0 out of 0 people found this article helpful.
Thank you for your feedback.