- Features
-
Services/ProductsServices/ProductsServices/Products

Learn more about the retail trading conditions, platforms, and products available for trading that FXON offers as a currency broker.
You can't start without it.
Trading Platforms Trading Platforms Trading Platforms
Features and functionality comparison of MetaTrader 4/5, and correspondence table of each function by OS
Two account types to choose
Trading Account Types Trading Account Types Trading Account Types
Introducing FXON's Standard and Elite accounts.
close close

-
SupportSupportSupport

Support information for customers, including how to open an account, how to use the trading tools, and a collection of QAs from the help desk.
Recommended for beginner!
Account Opening Account Opening Account Opening
Detailed explanation of everything from how to open a real account to the deposit process.
MetaTrader4/5 User Guide MetaTrader4/5 User Guide MetaTrader4/5 User Guide
The most detailed explanation of how to install and operate MetaTrader anywhere.
FAQ FAQ FAQ
Do you have a question? All the answers are here.
Coming Soon
Glossary Glossary GlossaryGlossary of terms related to trading and investing in general, including FX, virtual currencies and CFDs.
News News News
Company and License Company and License Company and License
Sitemap Sitemap Sitemap
Contact Us Contact Us Contact Us
General, personal information and privacy inquiries.
close close

- Promotion
- Trader's Market
- Partner
-
close close
Learn more about the retail trading conditions, platforms, and products available for trading that FXON offers as a currency broker.
You can't start without it.
Features and functionality comparison of MetaTrader 4/5, and correspondence table of each function by OS
Two account types to choose
Introducing FXON's Standard and Elite accounts.
Support information for customers, including how to open an account, how to use the trading tools, and a collection of QAs from the help desk.
Recommended for beginner!
Detailed explanation of everything from how to open a real account to the deposit process.
The most detailed explanation of how to install and operate MetaTrader anywhere.
Do you have a question? All the answers are here.
Coming Soon
Glossary of terms related to trading and investing in general, including FX, virtual currencies and CFDs.
General, personal information and privacy inquiries.
Useful information for trading and market information is posted here. You can also view trader-to-trader trading performance portfolios.
Find a trading buddy!
Share trading results among traders. Share operational results and trading methods.
- Legal Documents TOP
- Client Agreement
- Risk Disclosure and Warning Notice
- Order and Execution Policy
- Complaints Procedure Policy
- AML/CFT and KYC Policy
- Privacy Policy
- eKYC Usage Policy
- Cookies Policy
- Website Access and Usage Policy
- Introducer Agreement
- Business Partner Agreement
- VPS Service Terms and Condition


This article was :
published
updated
In MetaTrader5 (MT5), the object called the Elliott Wave is available. It is an analysis method heavily influenced by the Dow Theory, based on the idea that markets have a cycle. In MT5, the 5 upward trends are shown as the "motive wave" and the 3 downward waves are referred to as the "corrective wave".(*1)
Here, we'll take a look at how to display and adjust the Elliott Wave.
(*1)Elliott Wave is not available on MetaTrader4 (MT4).
Step 1
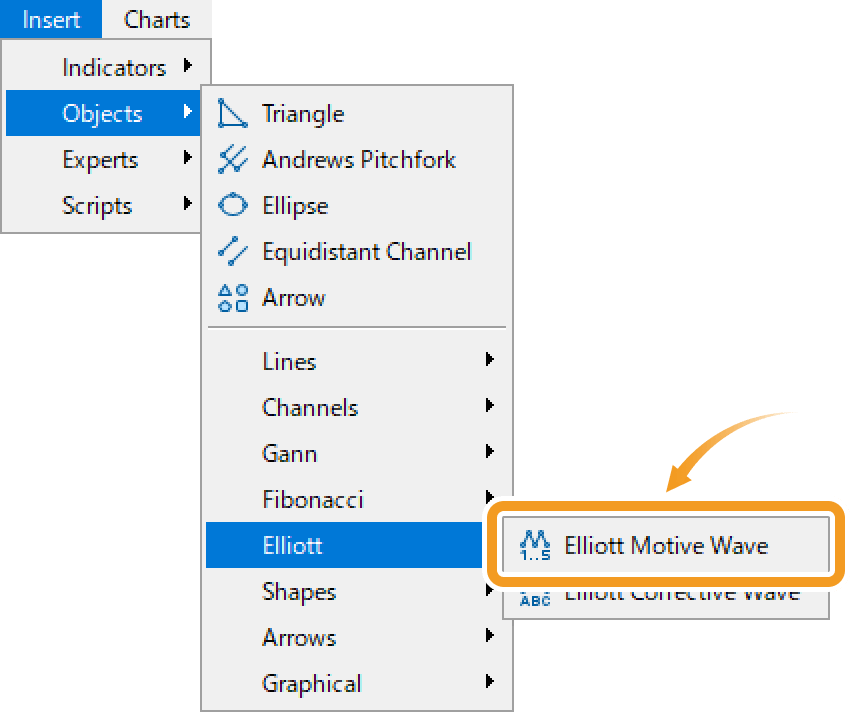
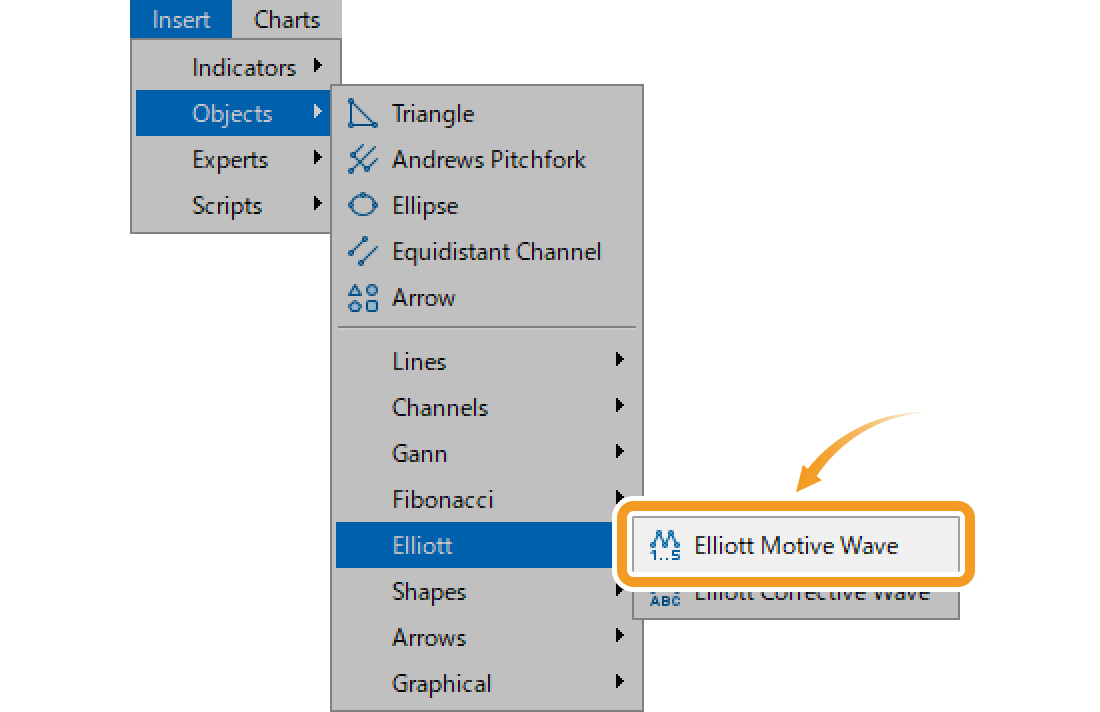
Click "Insert" in the menu. Hover the pointer over "Objects" > "Elliott" and select "Elliott Motive Wave".
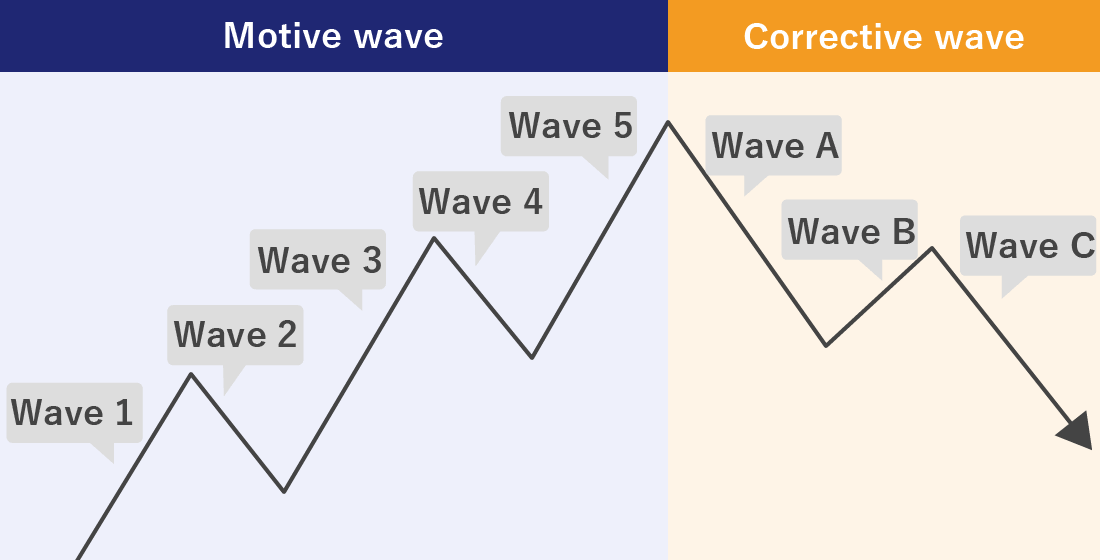
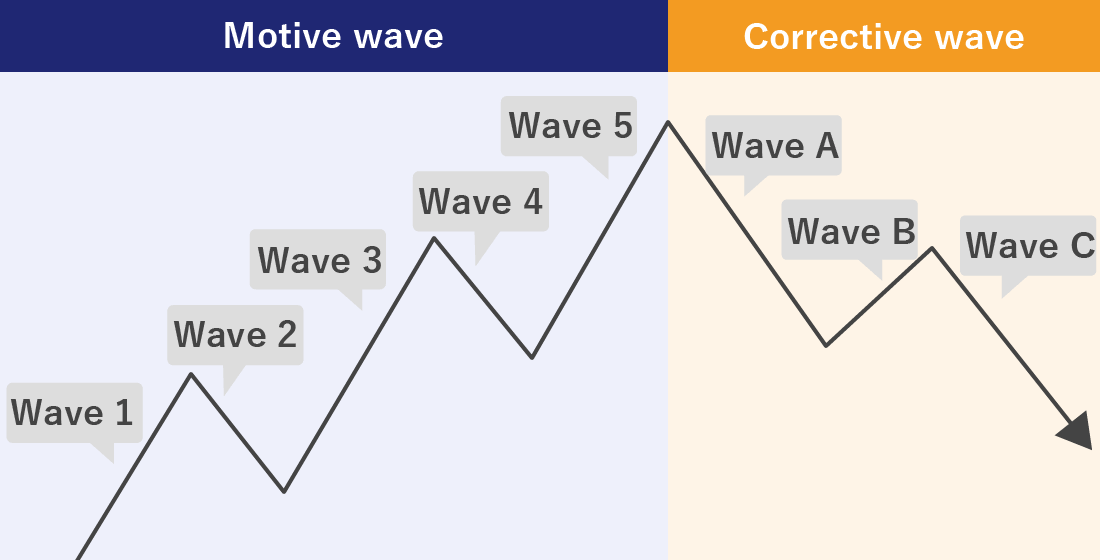
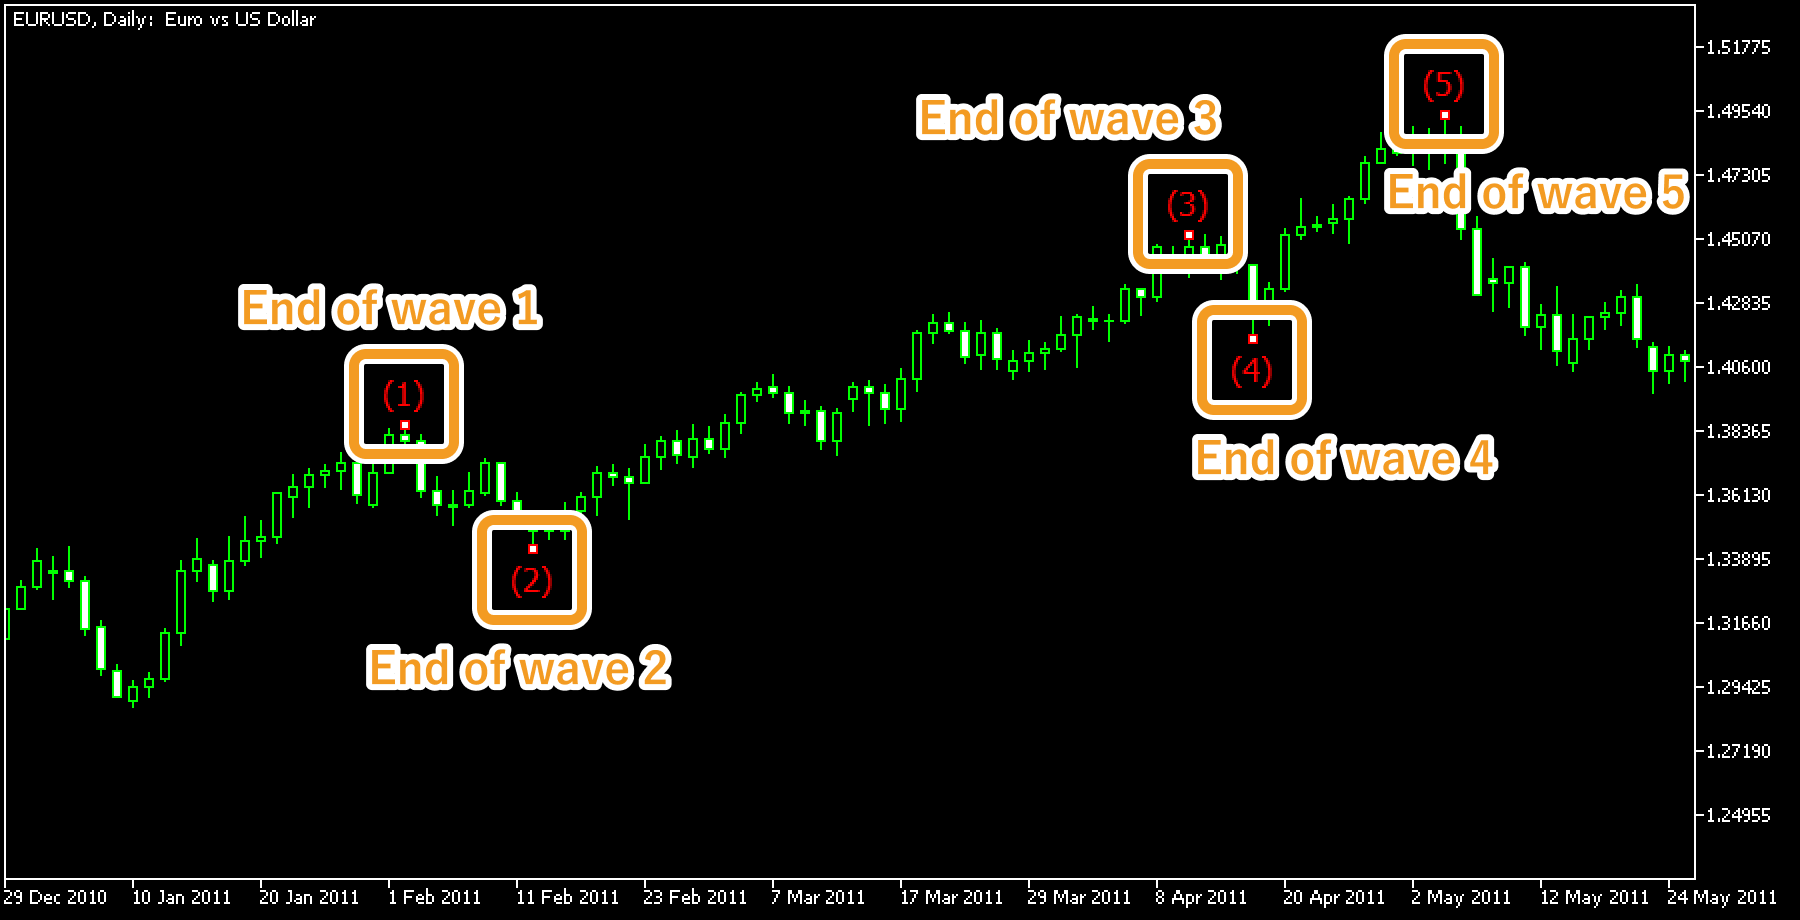
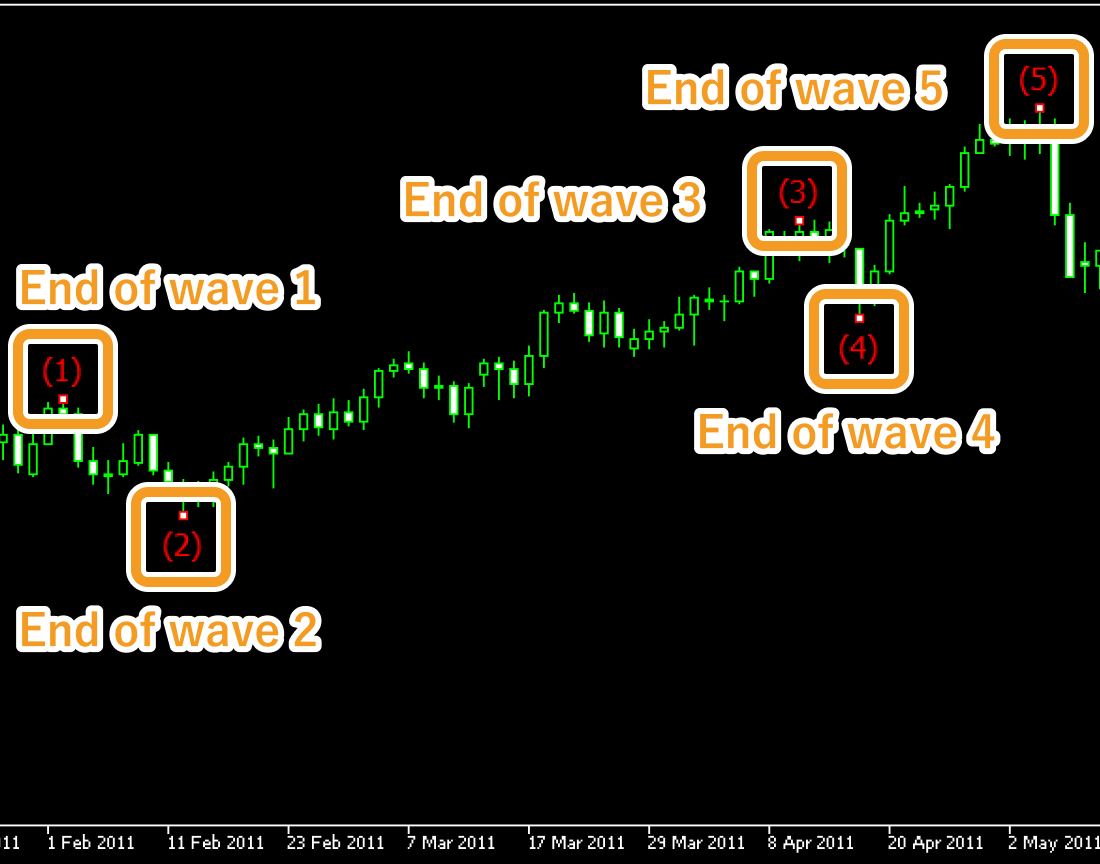
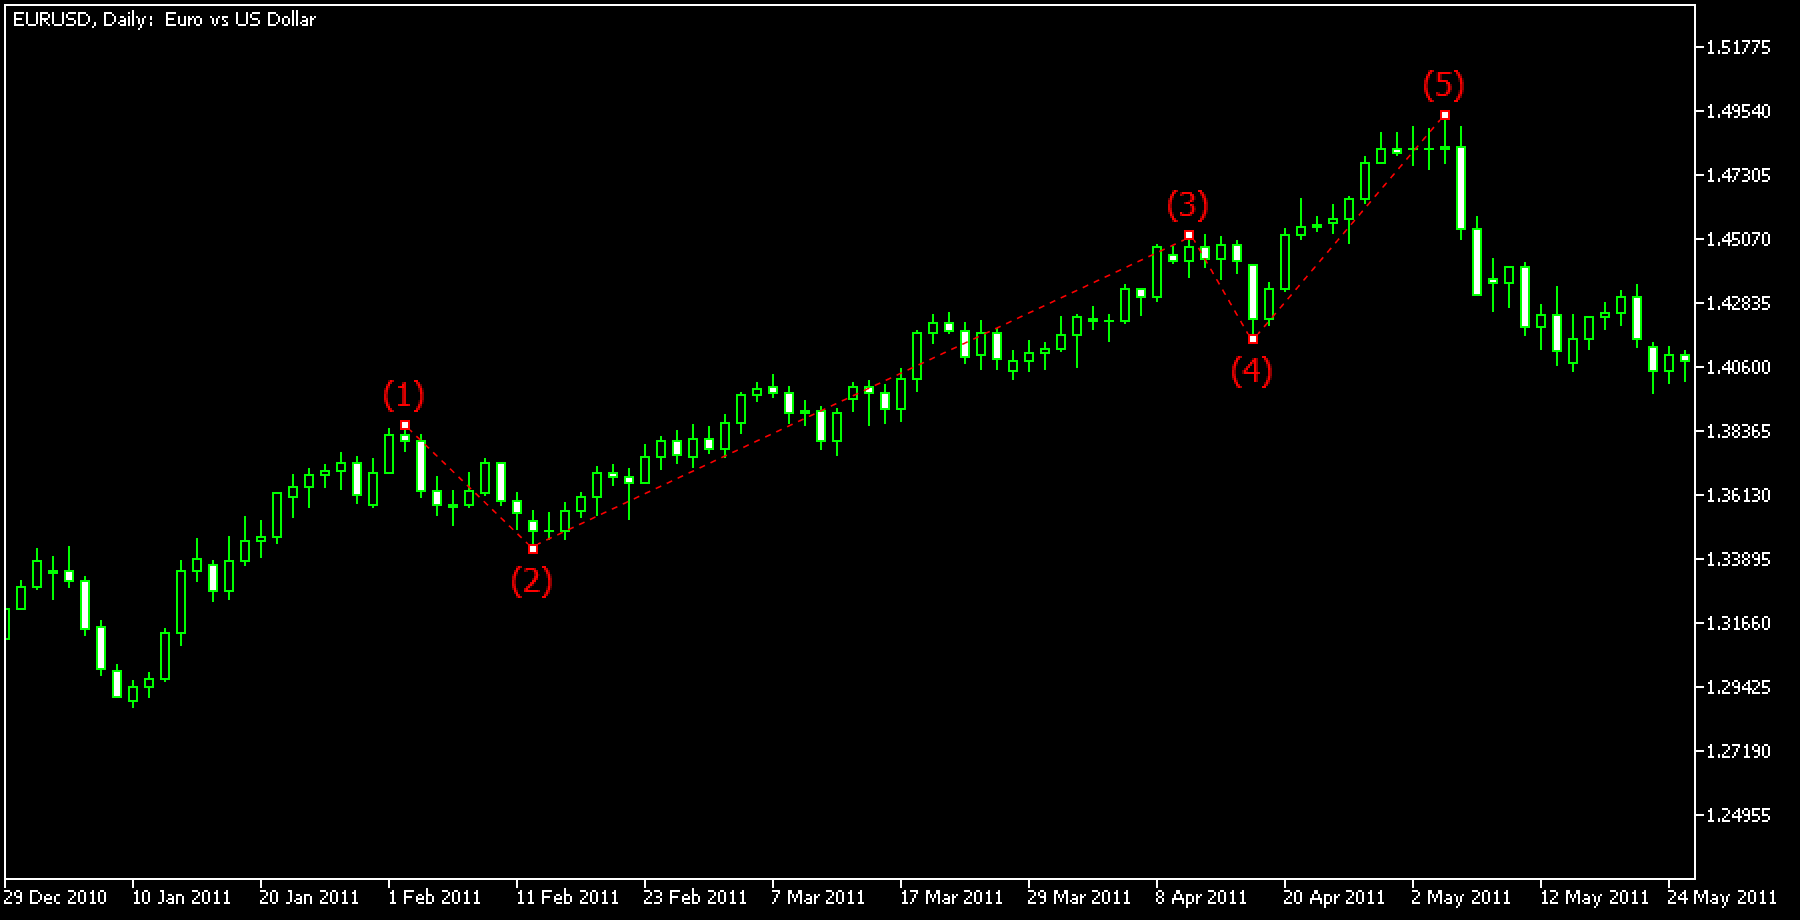
The Elliott Wave is made up of 8 waves. Waves 1~5 drive the trend and are called the "Elliott motive wave". Waves A~C which adjust the trend is called the "Elliott corrective wave". The motive waves are made up of waves that drive the trend (wave 1, 3, 5) and those that go against it (wave 2, 4). The theory states that the 3rd wave will never be the shortest. The correction waves are made up of waves that correct the trend (wave A, C) and those that go against it (wave B). The rule states that wave C will always have the biggest price gap in the Elliott Wave.
Step 2
Click on the end point of wave 1 of the Elliott motive waves, followed by the end point of wave 2, 3, 4, and 5. If you want to adjust the position of the Elliott motive waves, make sure the white dots are being displayed on the end points and move each dot as necessary.
If you cannot see the white dots, double-click near the Elliott motive waves to display the white dots.
Step 3
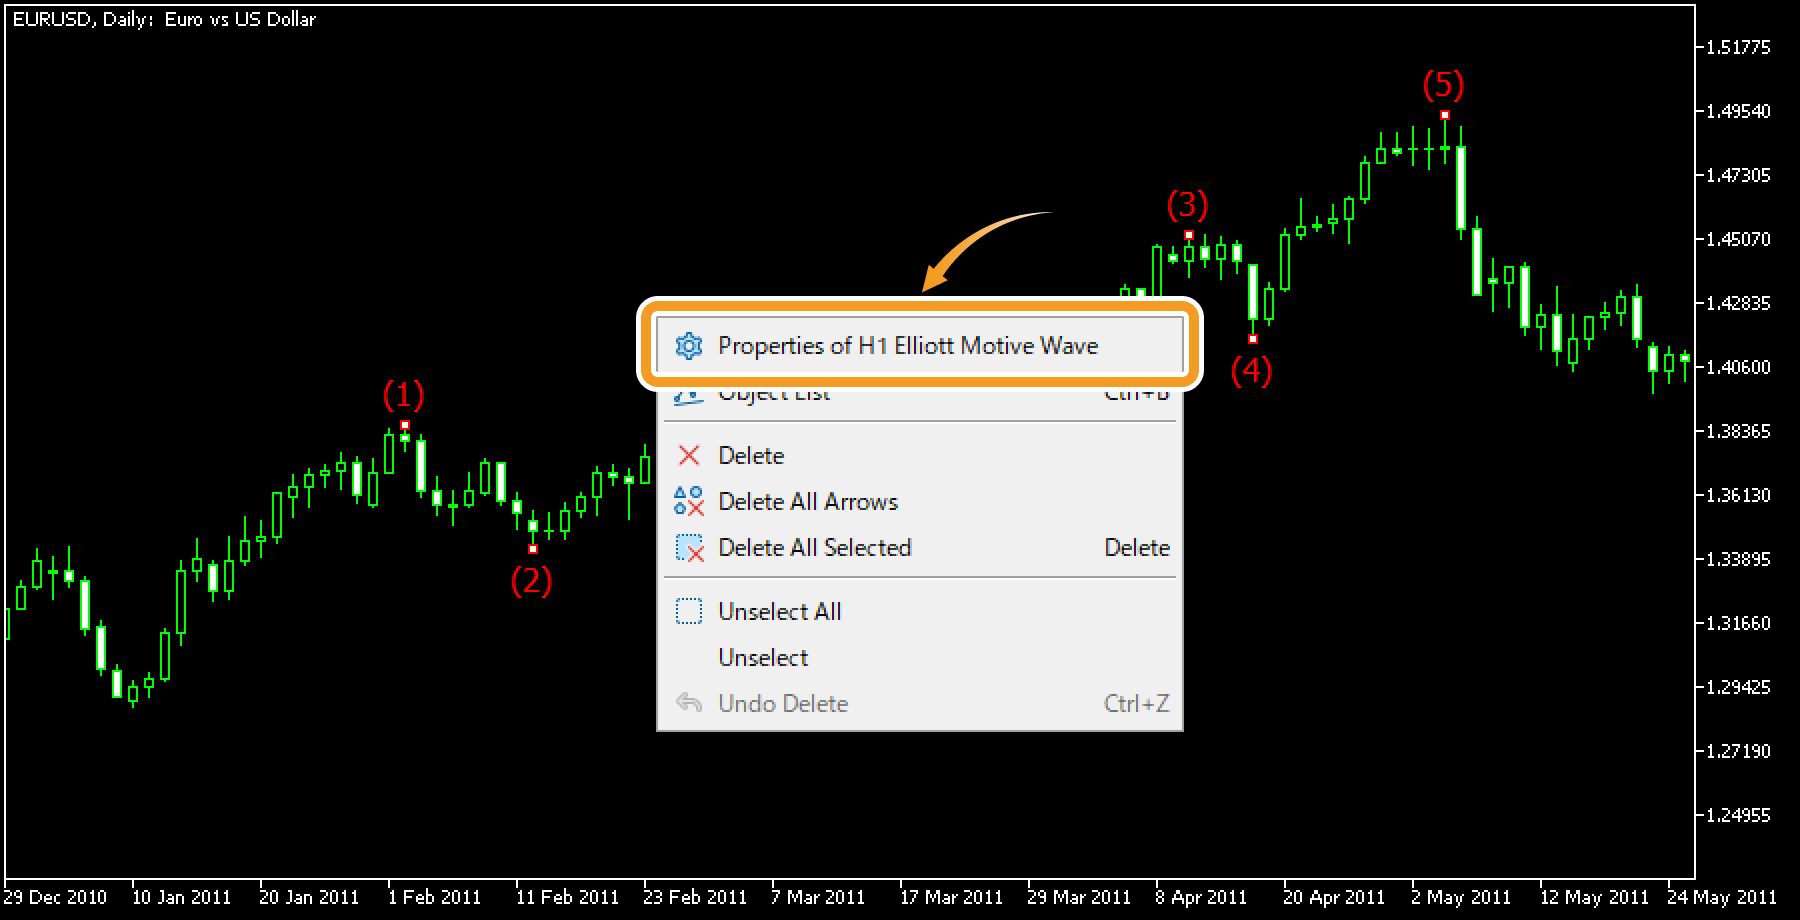
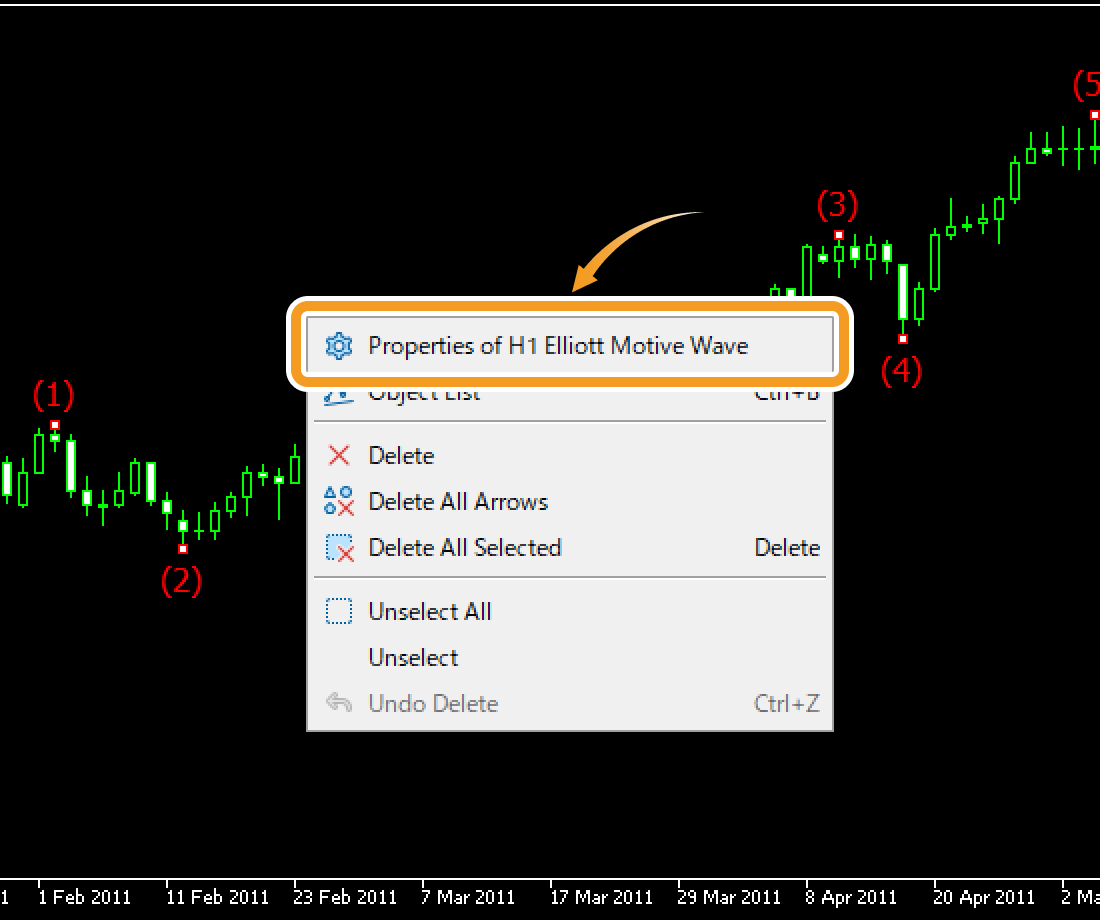
To modify the Elliott motive wave settings, right-click near the Elliott motive waves and select "Properties of (Elliott Wave name)".
Step 4
On the "Properties" window, edit the parameters in the "Common", "Parameters", and "Visualization" tabs and click "OK".
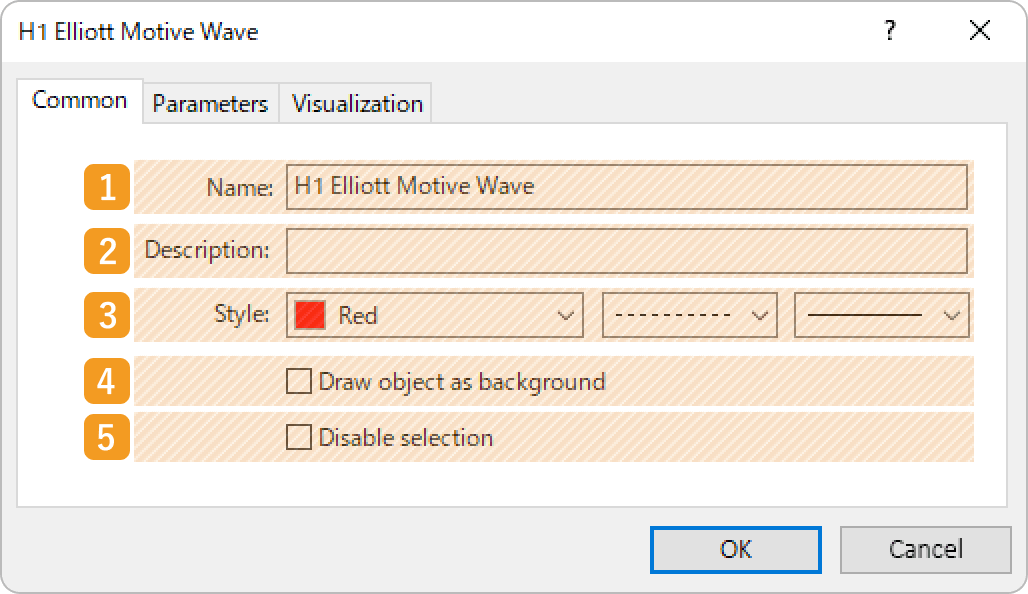
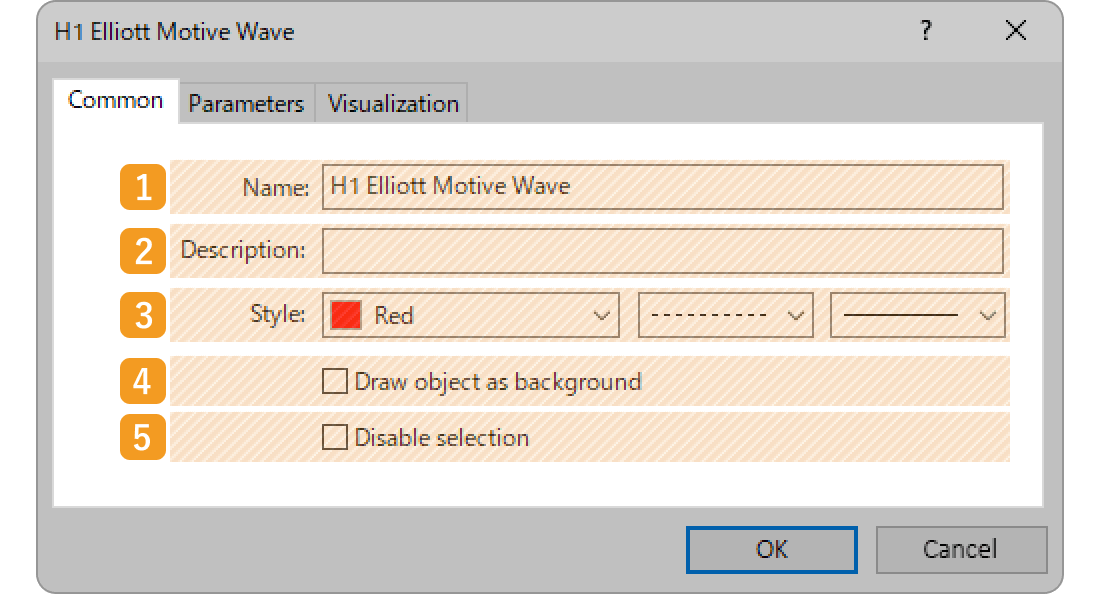
"Common" tab
|
Number |
Item name |
Descriptions |
|---|---|---|
|
1 |
Name |
Name the Elliott Wave. |
|
2 |
Description |
The description of the Elliott Wave can be displayed on the chart. Related article: Show or hide items on chart |
|
3 |
Style |
Set the color, line type, and line thickness for the Elliott Wave. |
|
4 |
Draw object |
Check this box if you want to place the Elliott Wave behind the chart. |
|
5 |
Disable selection |
Check this box if you want to disable the editing of the Elliott Wave. |
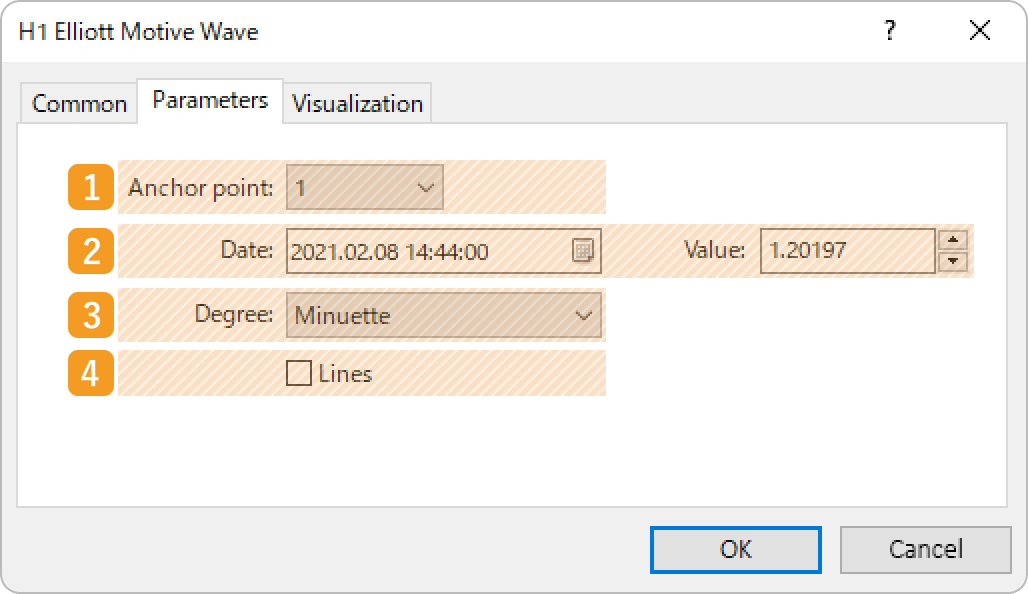
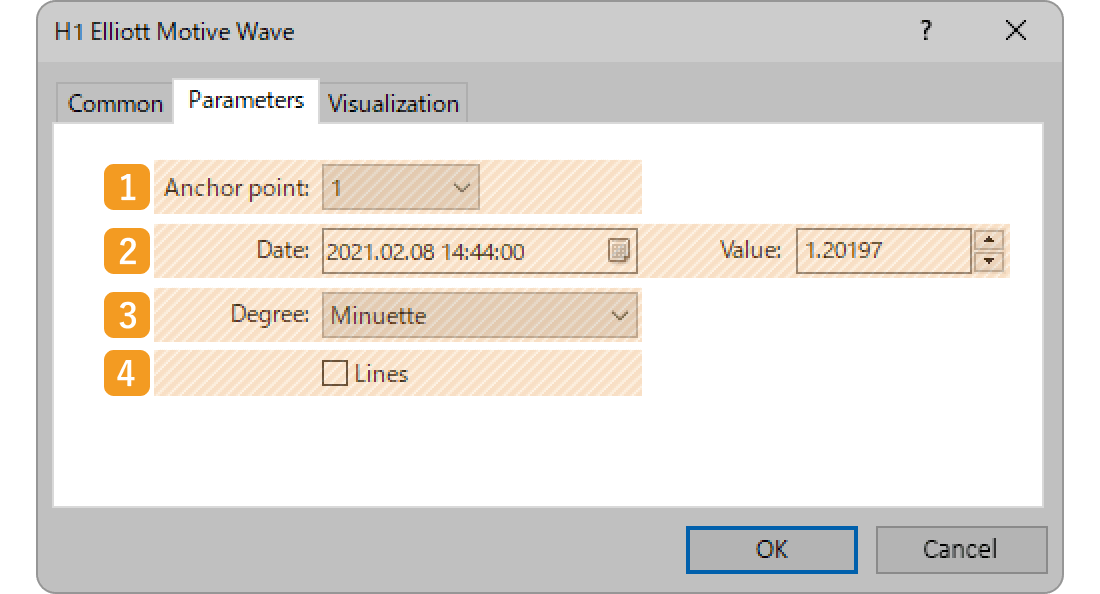
"Parameters" tab
|
Number |
Item name |
Descriptions |
|---|---|---|
|
1 |
Anchor point |
Specify the end point of the wave to move. |
|
2 |
End point position |
Specify the end point position by date and price. |
|
3 |
Degree |
Specify the cycle for the Elliott Wave. |
|
4 |
Lines |
Check this box when you want to connect the end points of the Elliott Wave with lines. |
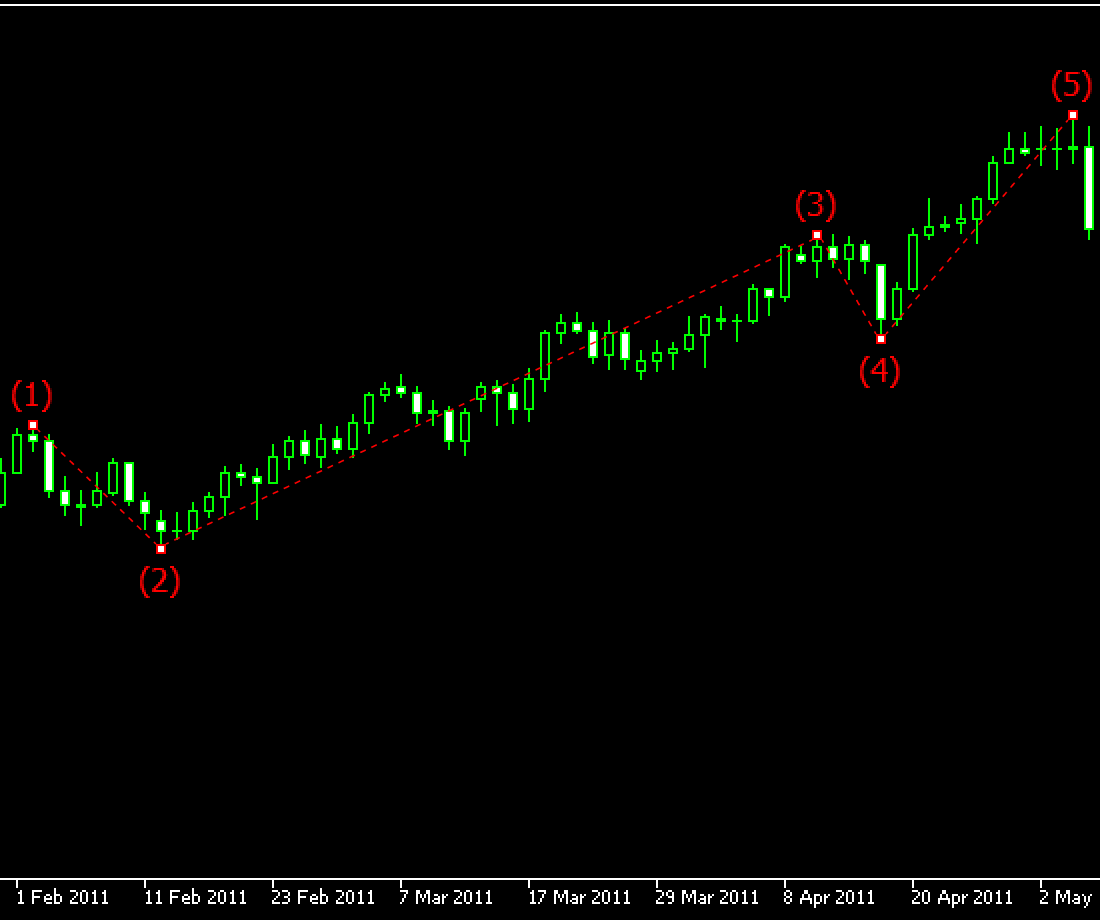
If the lines are displayed
"Visualization" tab
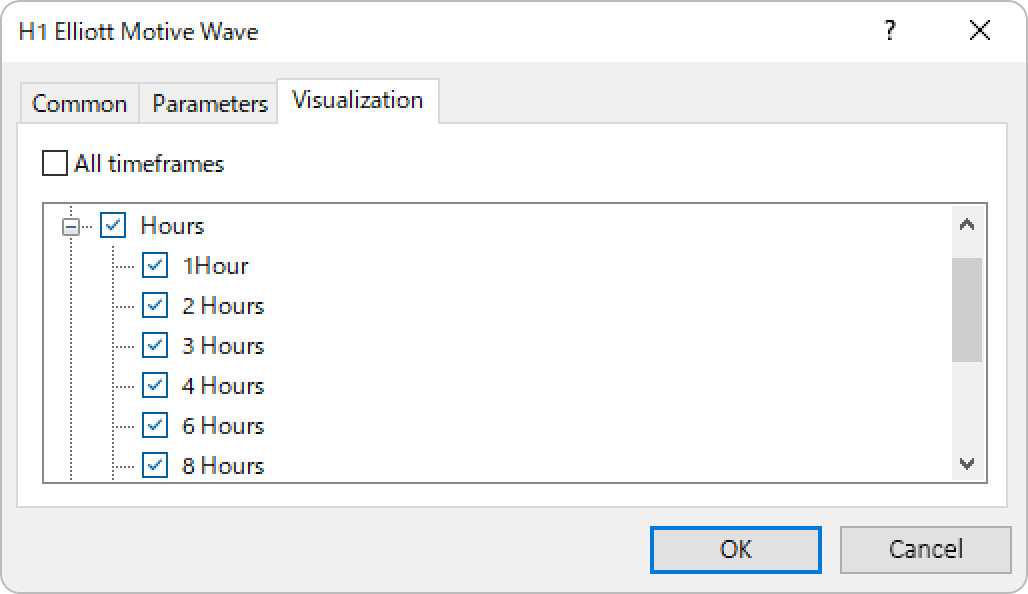
On the "Visualization" tab, you can specify the timeframes to use the Elliott Wave with.
Elliott states in one of his books that "The wave principle, inspired by the Dow Theory, is an indispensable tool for market analysis". In other words, the Elliott Wave is a more sophisticated version of the Dow Theory. Interestingly enough, they both use "waves" as an analogy to describe the market. Elliott often used phrases such as "low tide" and "flow" to explain market behavior, hence the name, "Wave Theory".
Was this article helpful?
0 out of 0 people found this article helpful.
Thank you for your feedback.
FXON uses cookies to enhance the functionality of the website and your experience on it. This website may also use cookies from third parties (advertisers, log analyzers, etc.) for the purpose of tracking your activities. Cookie Policy
