MT4/MT5: Show or hide items on chart
Charts (PC)
Charts (PC)

This article was :
published
updated
On MetaTrader4 (MT4) / MetaTrader5 (MT5), you can choose the items to display on charts from the chart properties. The items on the properties window are as follows.
Here we will look at how to show or hide items on charts in MT4/MT5.
Switch between MT4/MT5 tabs to check the steps for each.
(*1)Only available for MT5.
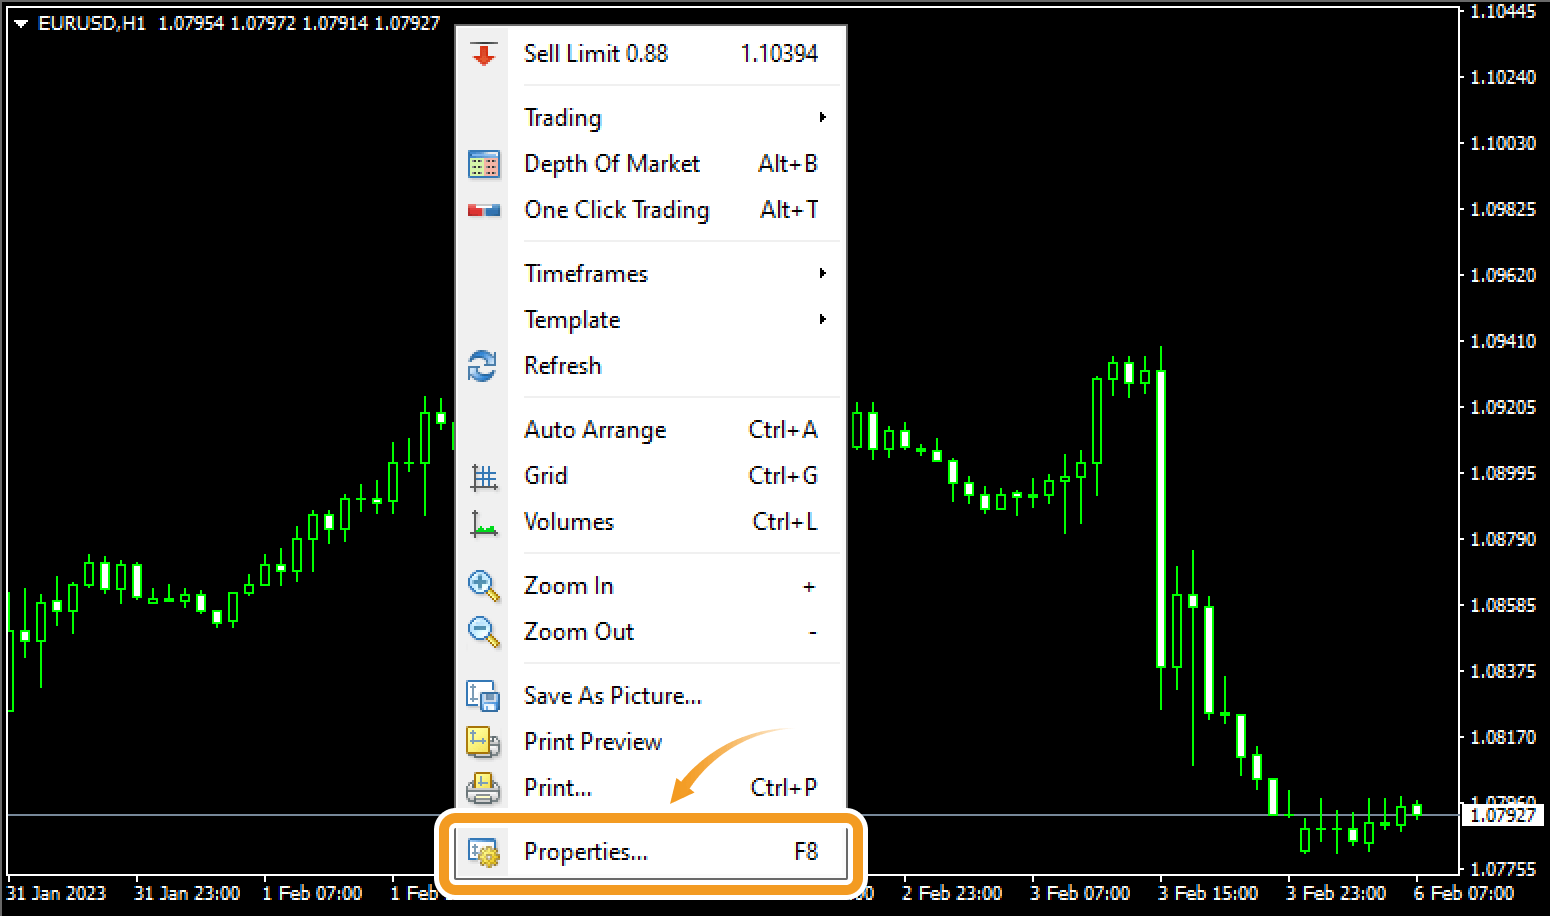
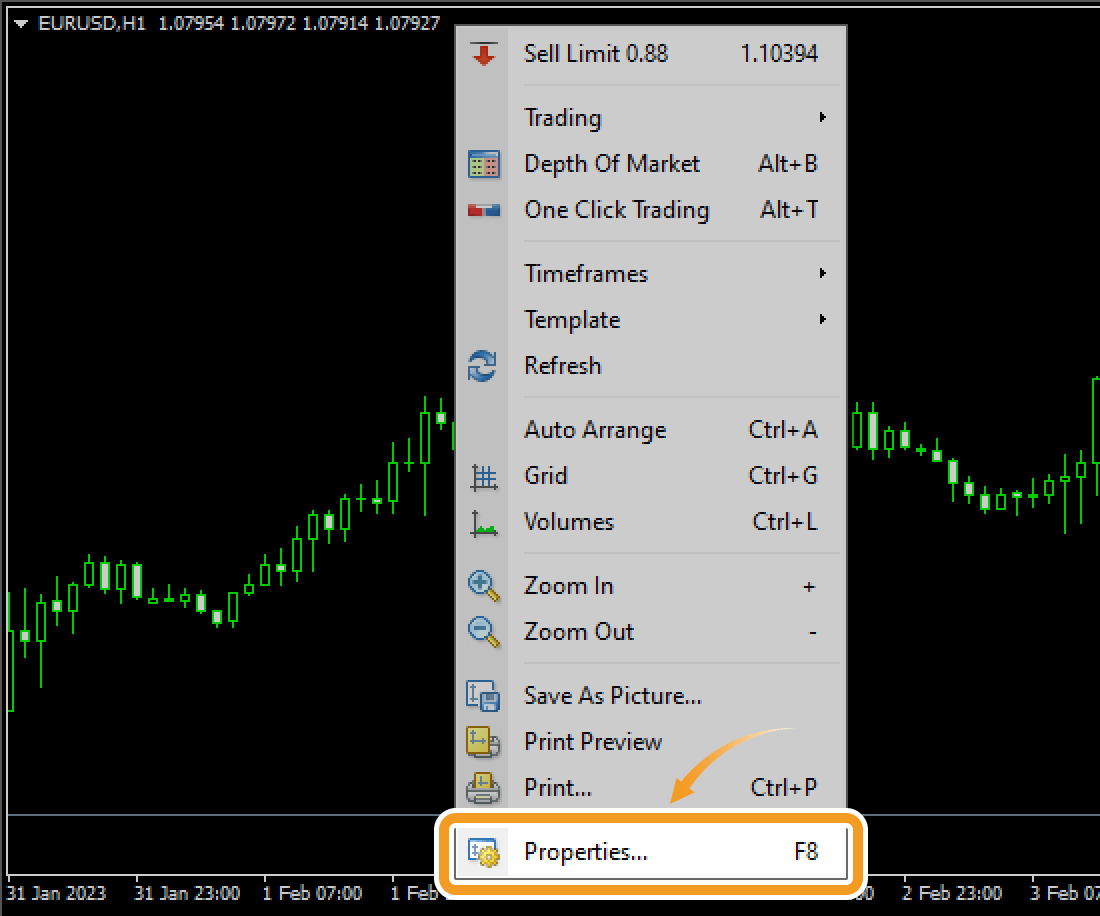
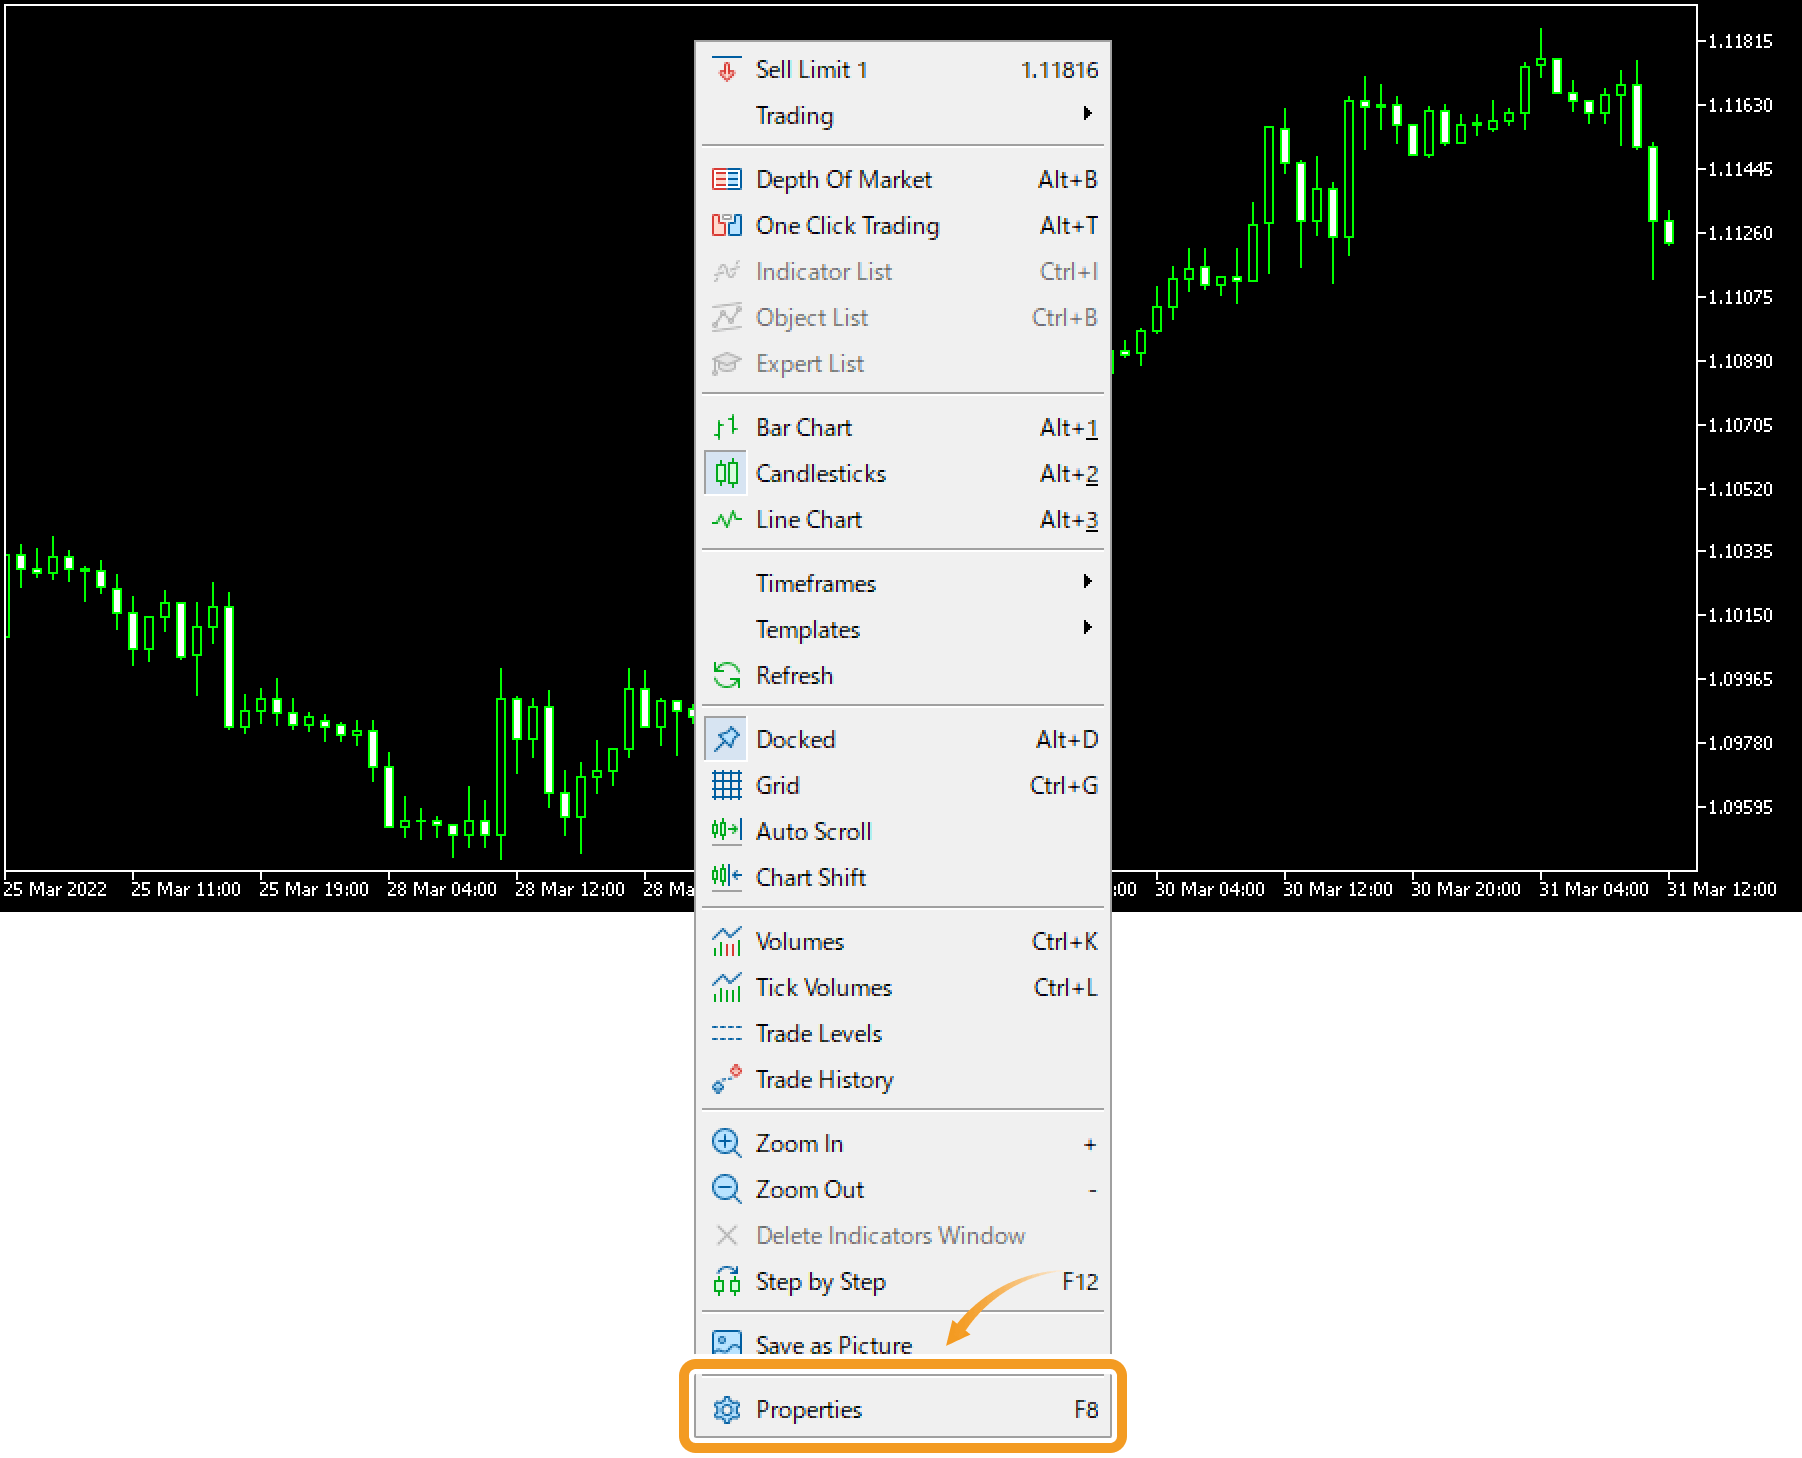
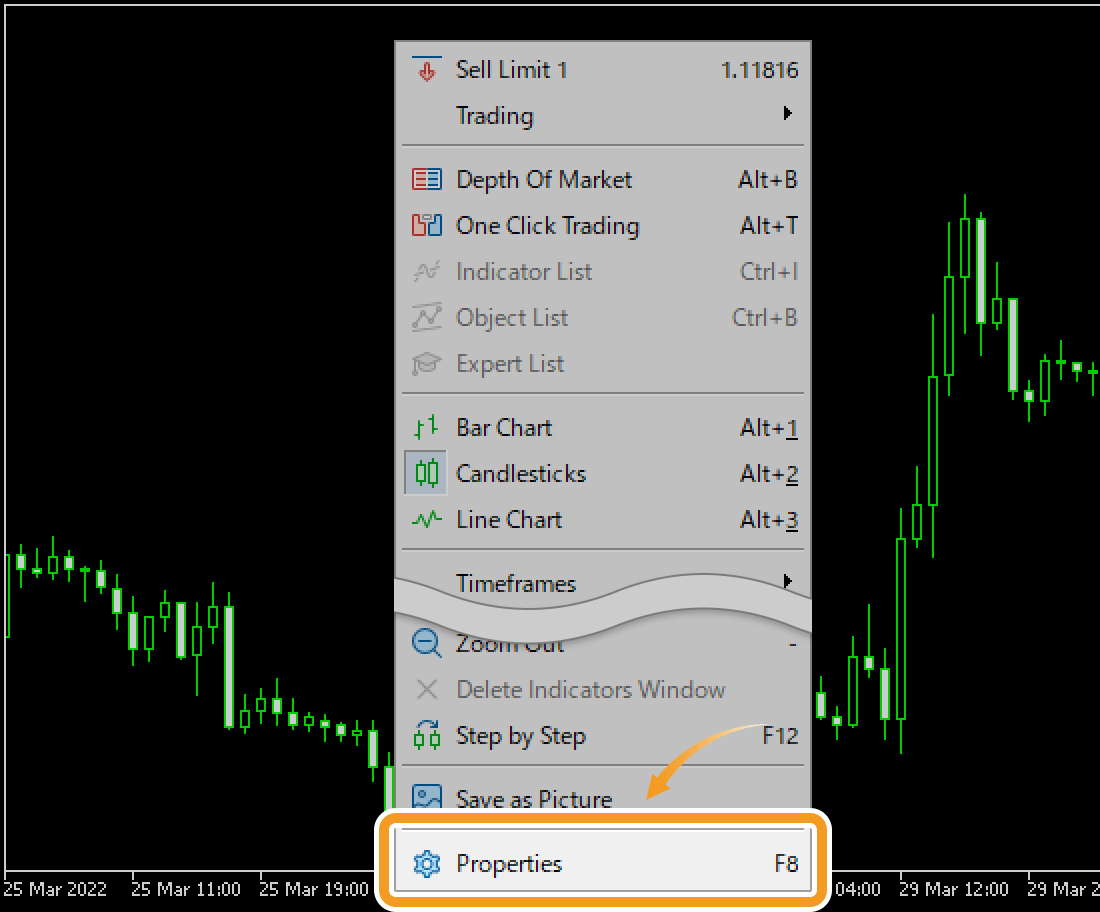
Right-click on the chart and select "Properties".
In the "Common" tab, check the items to display on the chart, and uncheck the ones to hide.
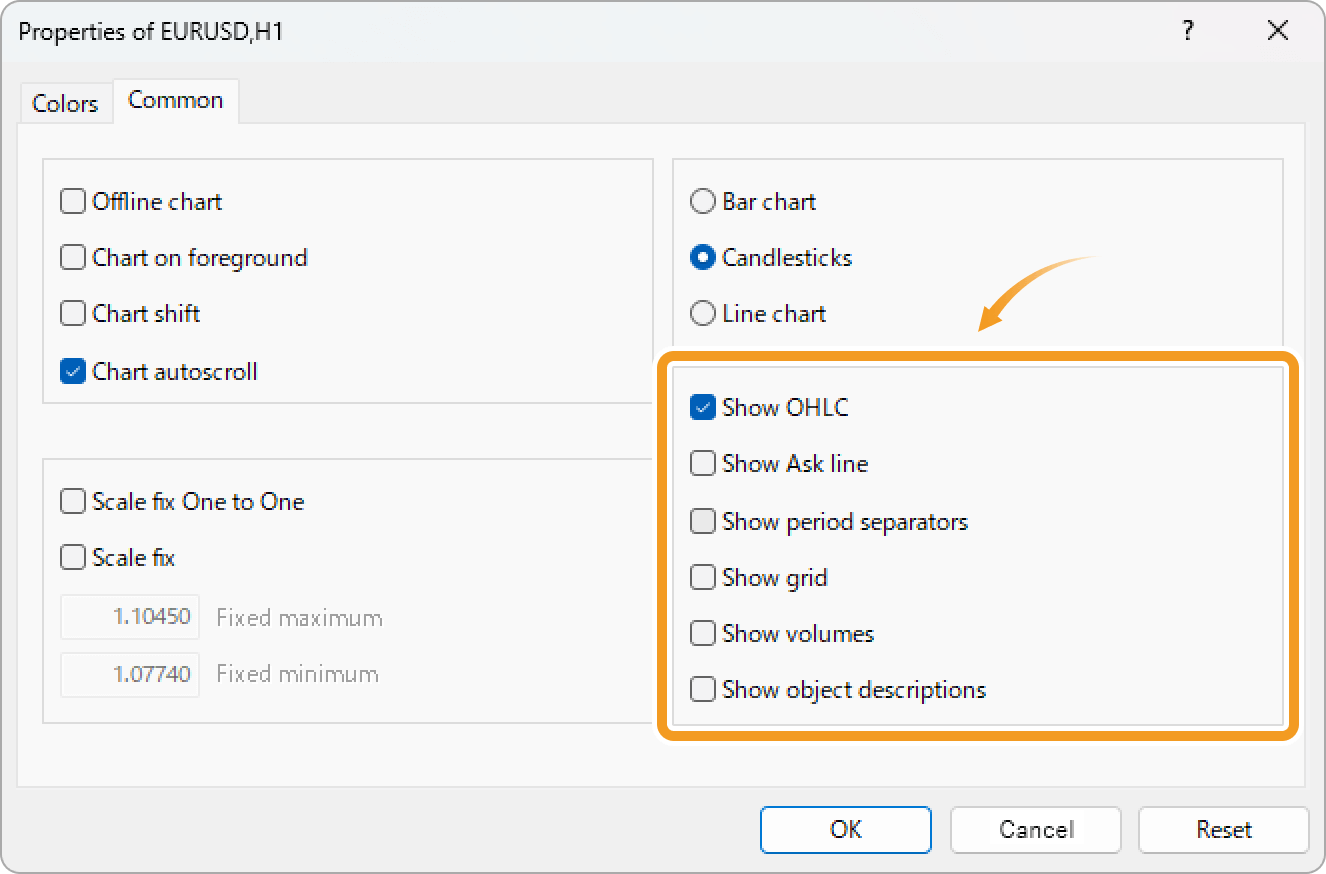
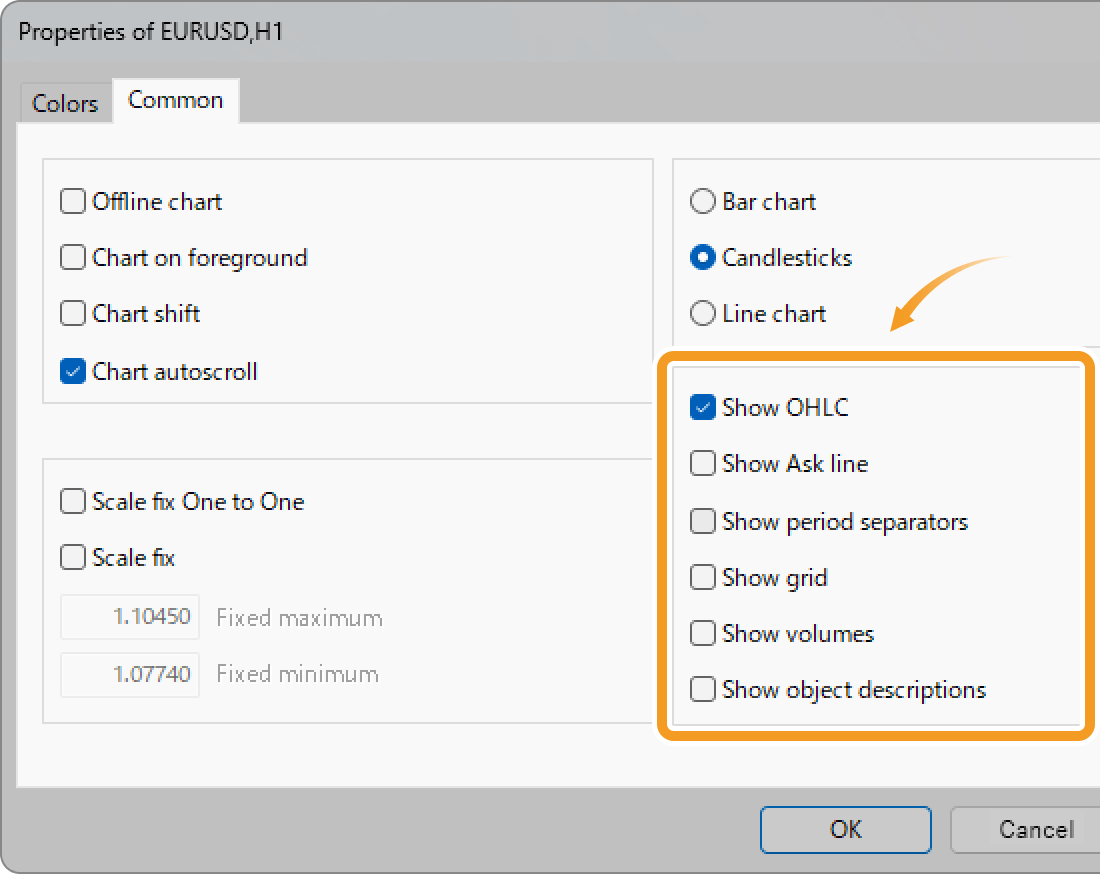
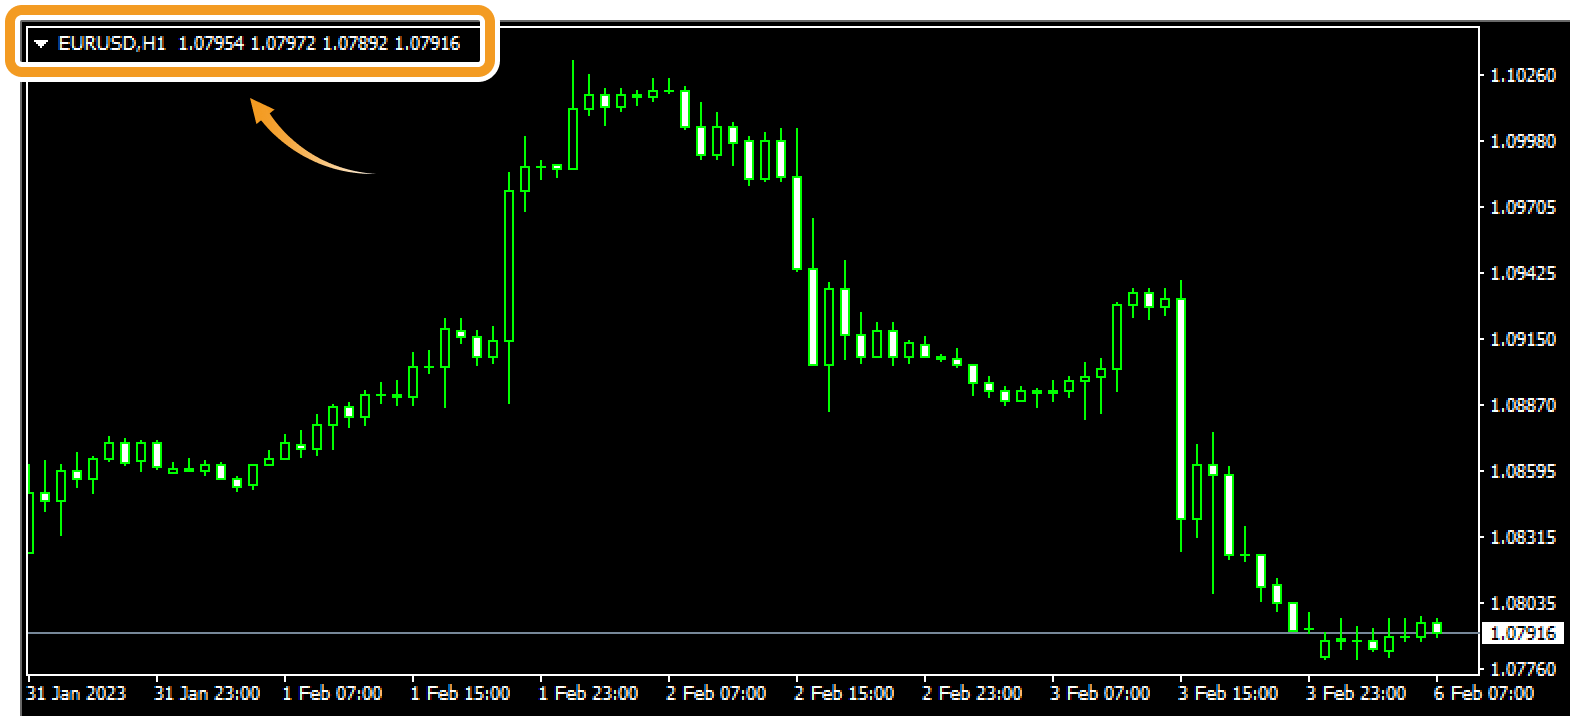
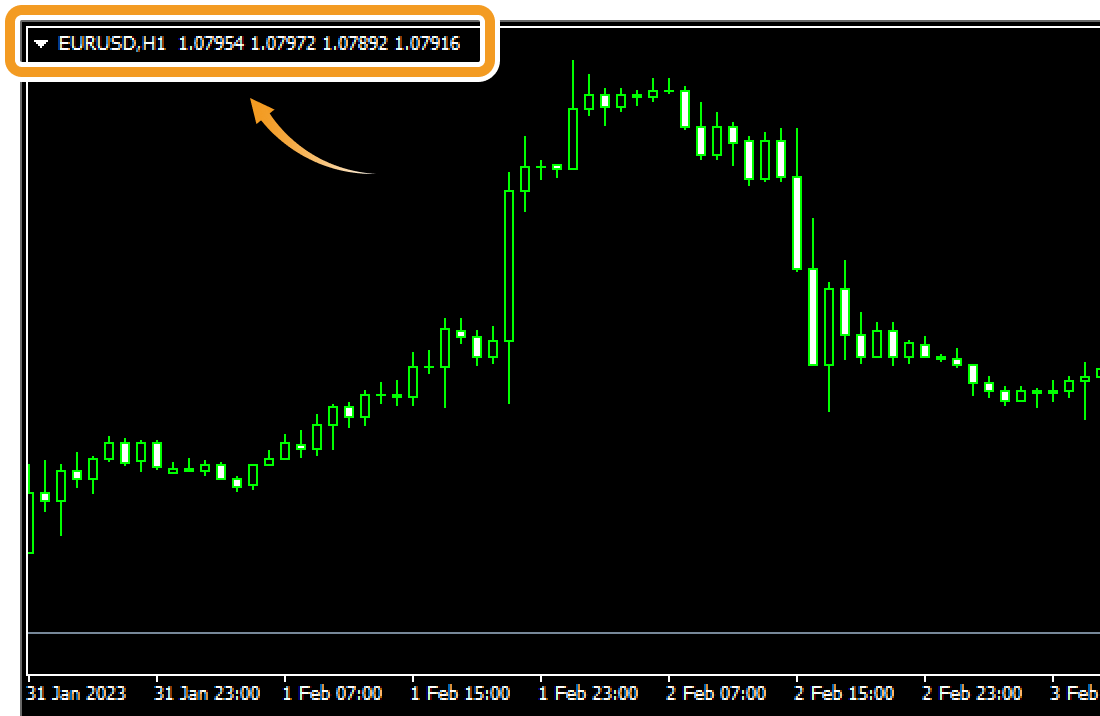
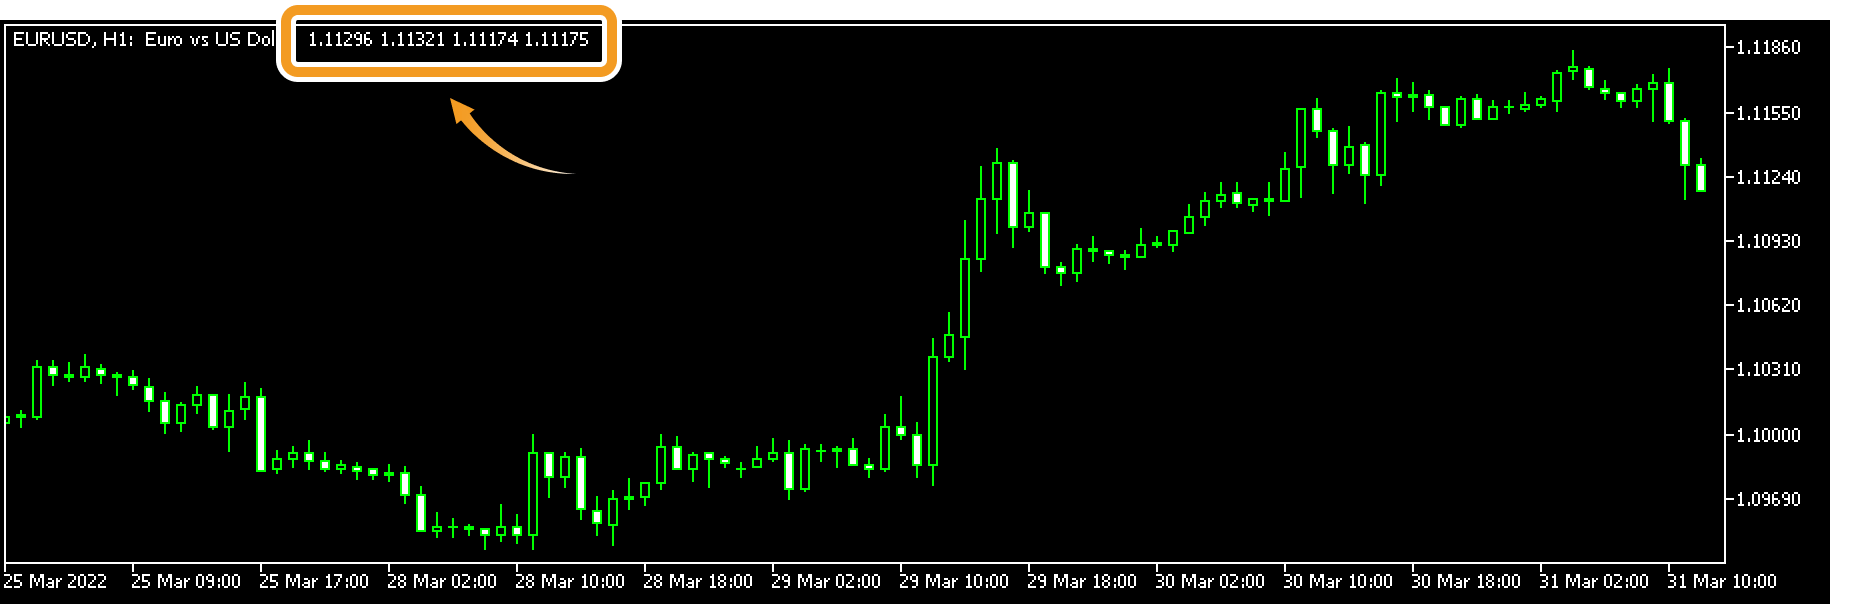
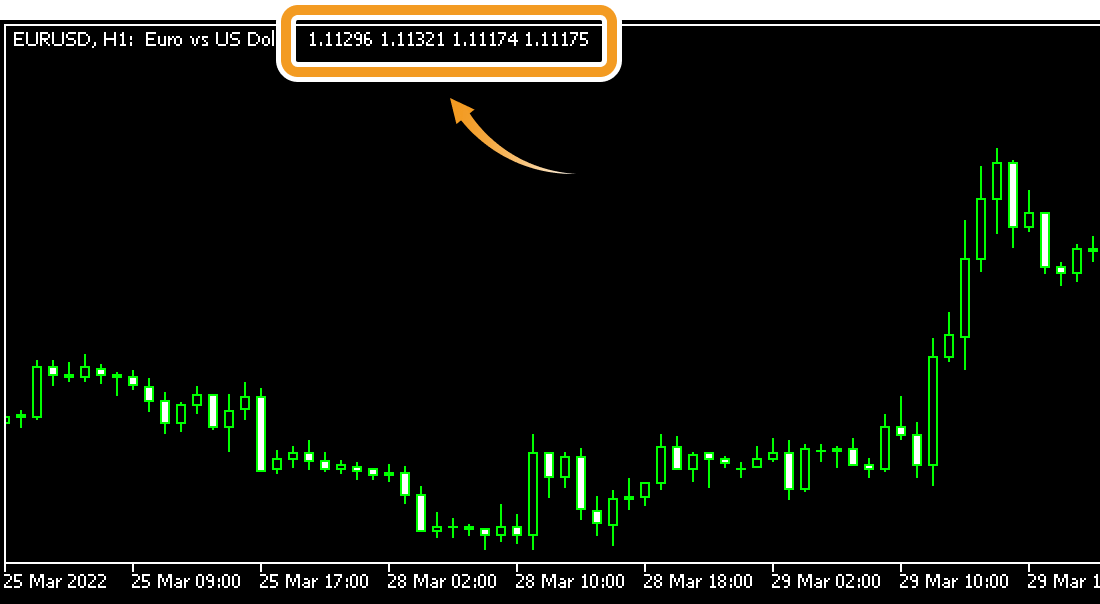
Show/hide OHLC. OHLC is short for Open price, High price, Low price, and Close price. When it is checked, OHLC prices will be displayed on the top-left corner of the chart in the same order.
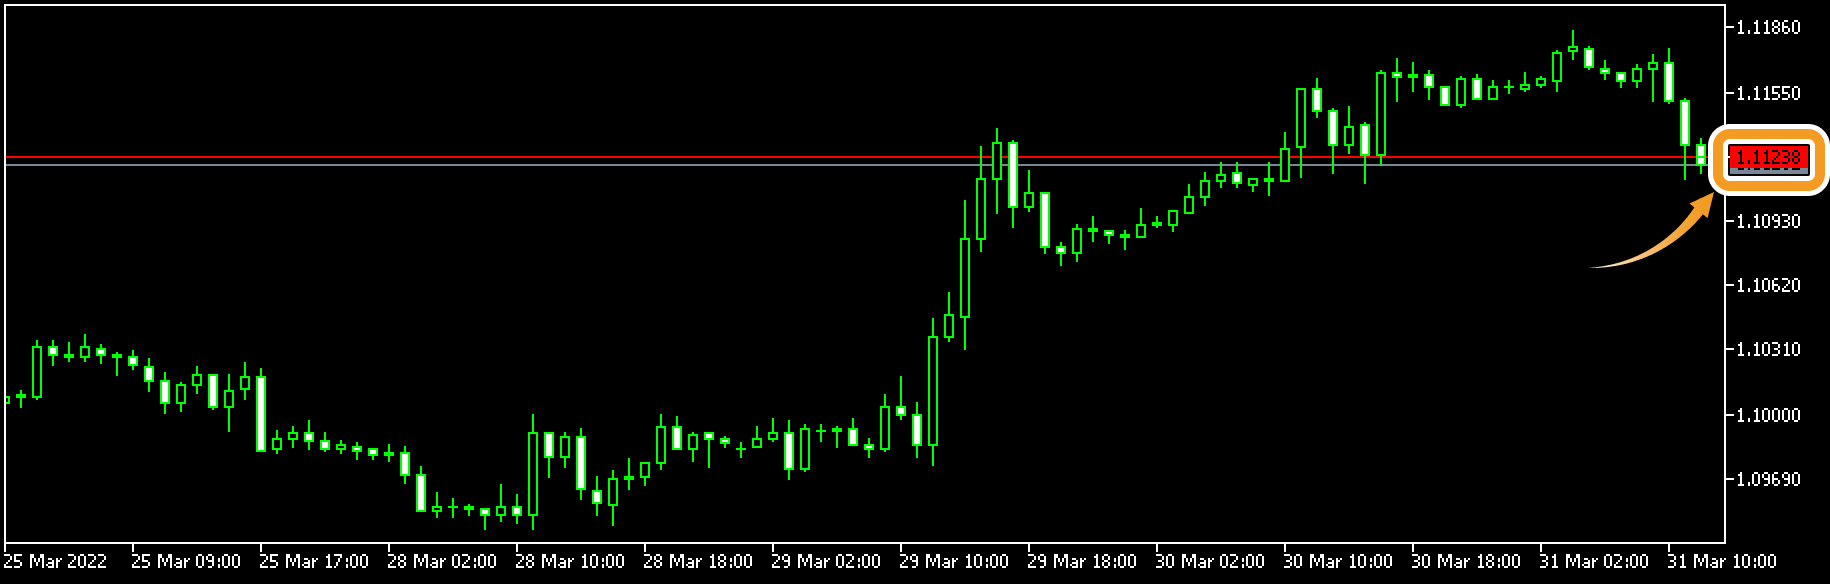
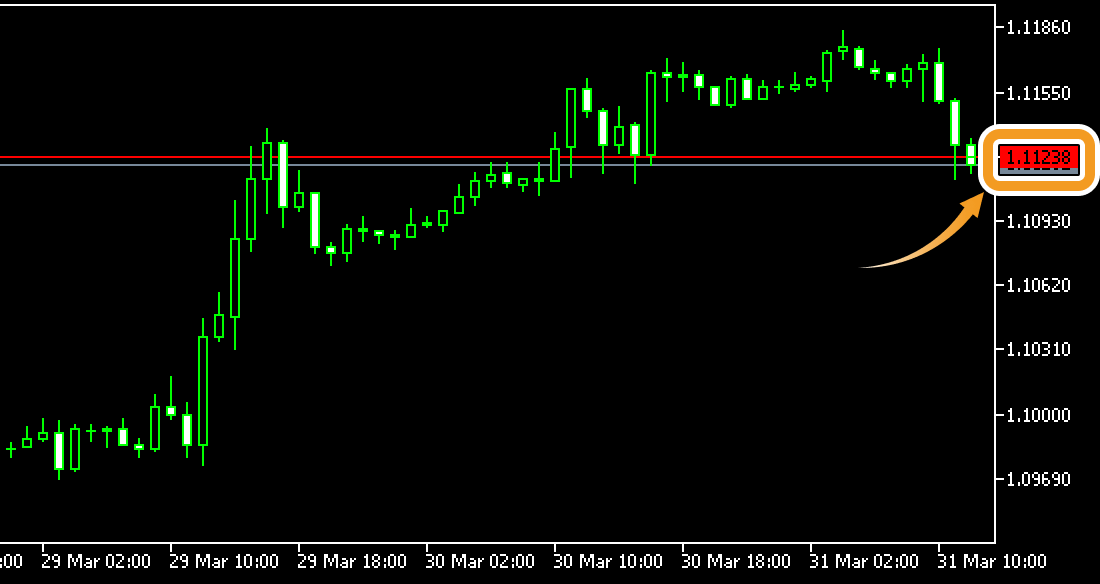
Show/hide the Ask price line. When "Show Ask line" is checked, the Ask price will be displayed on the chart.
The charts on MT4/MT5 are created using Bid value. By default, the Bid values are shown on the chart. You cannot create a chart based on Ask in MT4/MT5.
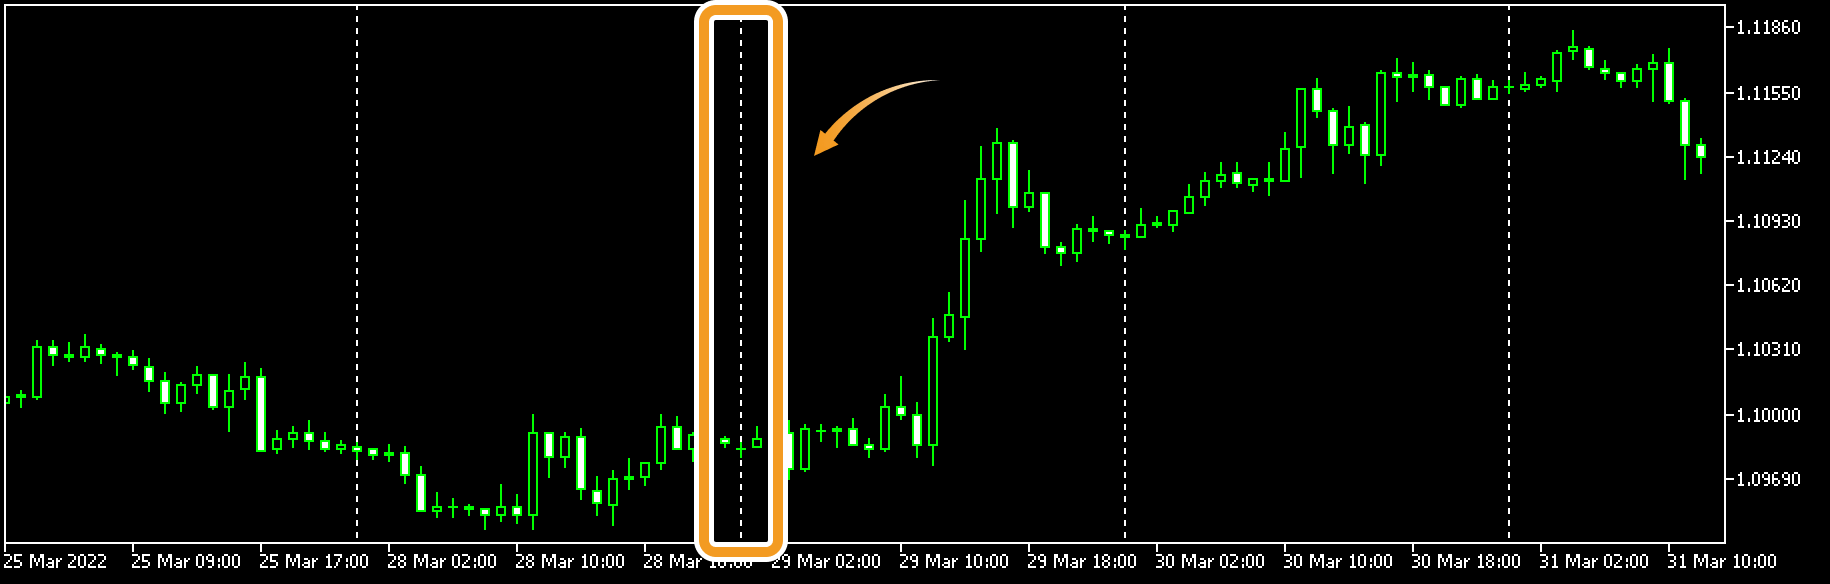
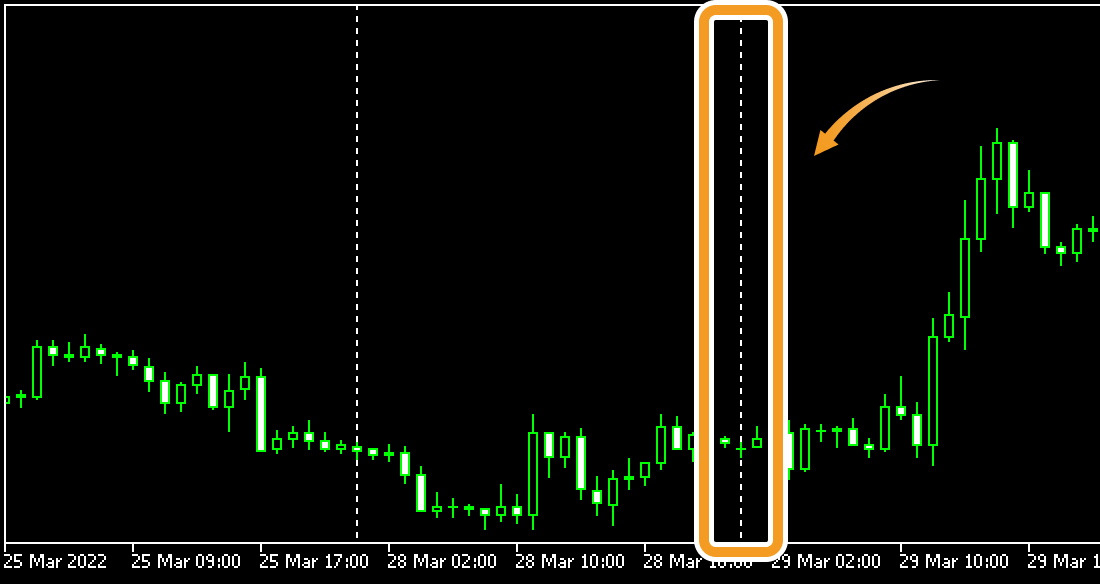
Show/hide period separators. The interval varies depending on the timeframe. When it is checked, period separators will be displayed on the chart.
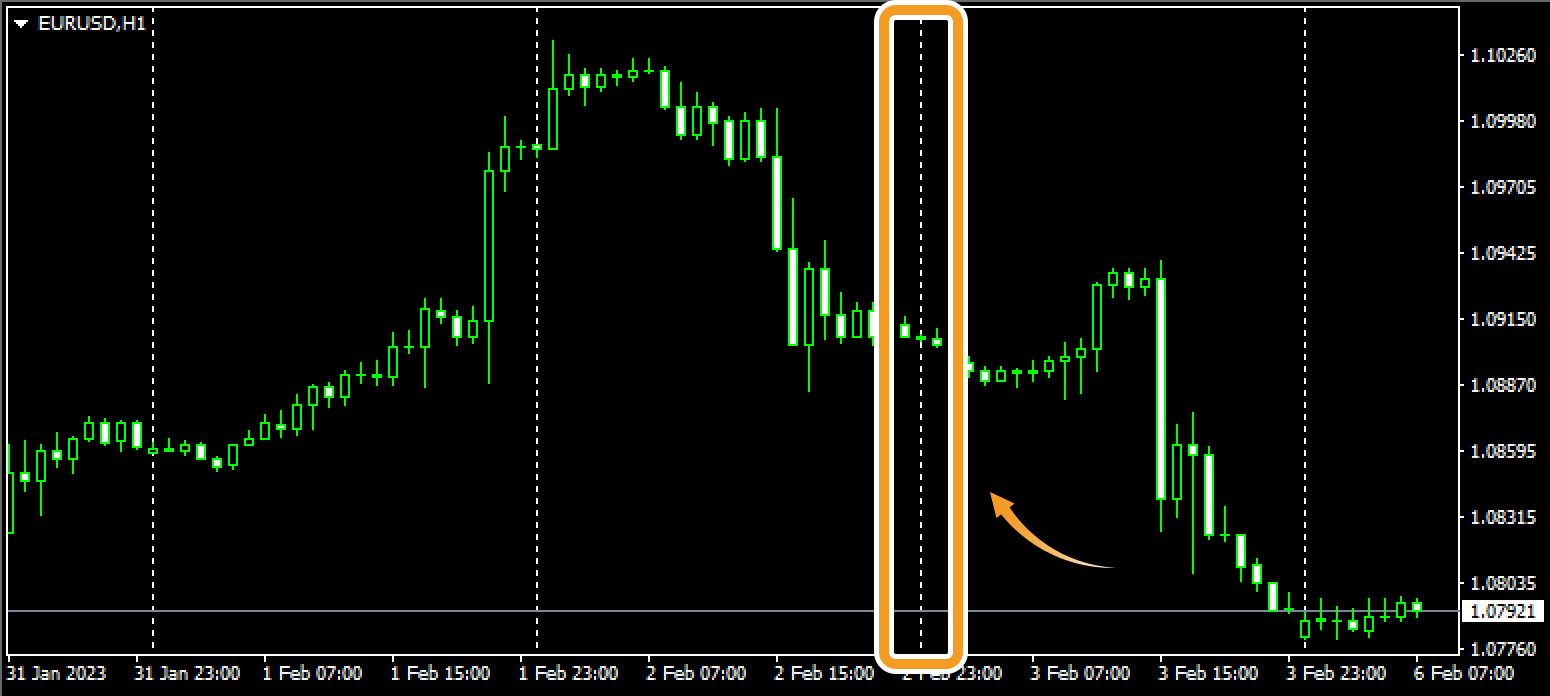
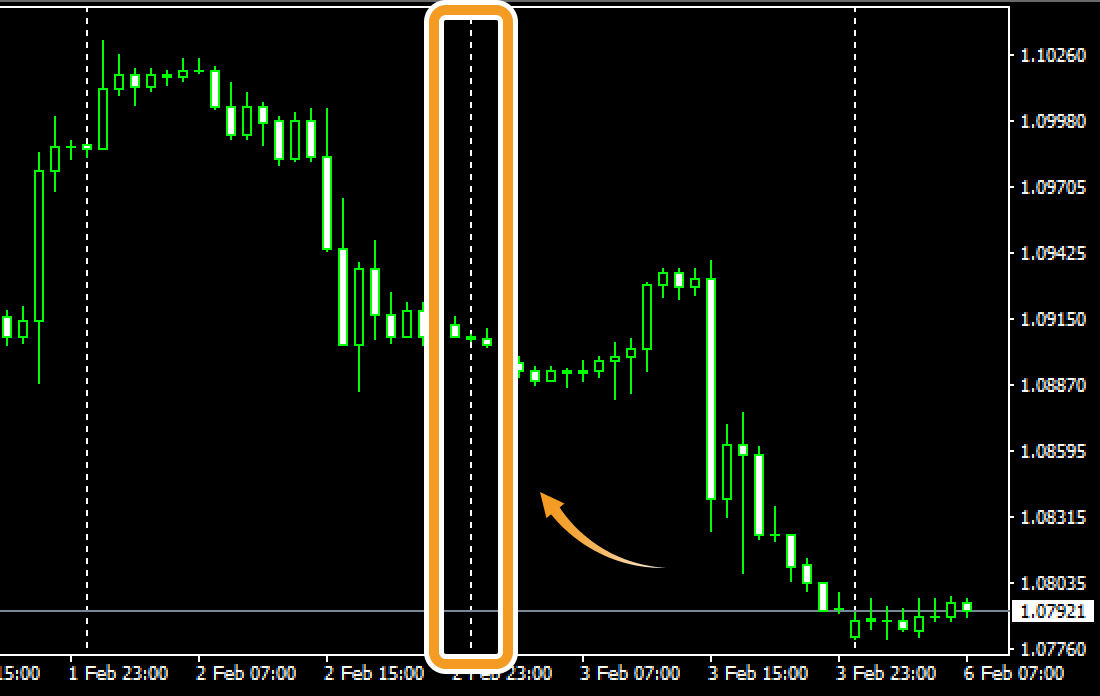
| Separator interval | Timeframe |
|---|---|
| Daily | M1, M5, M15, M30, H1 |
| Weekly | H4 |
| Monthly | D1 |
| Yearly | MN |
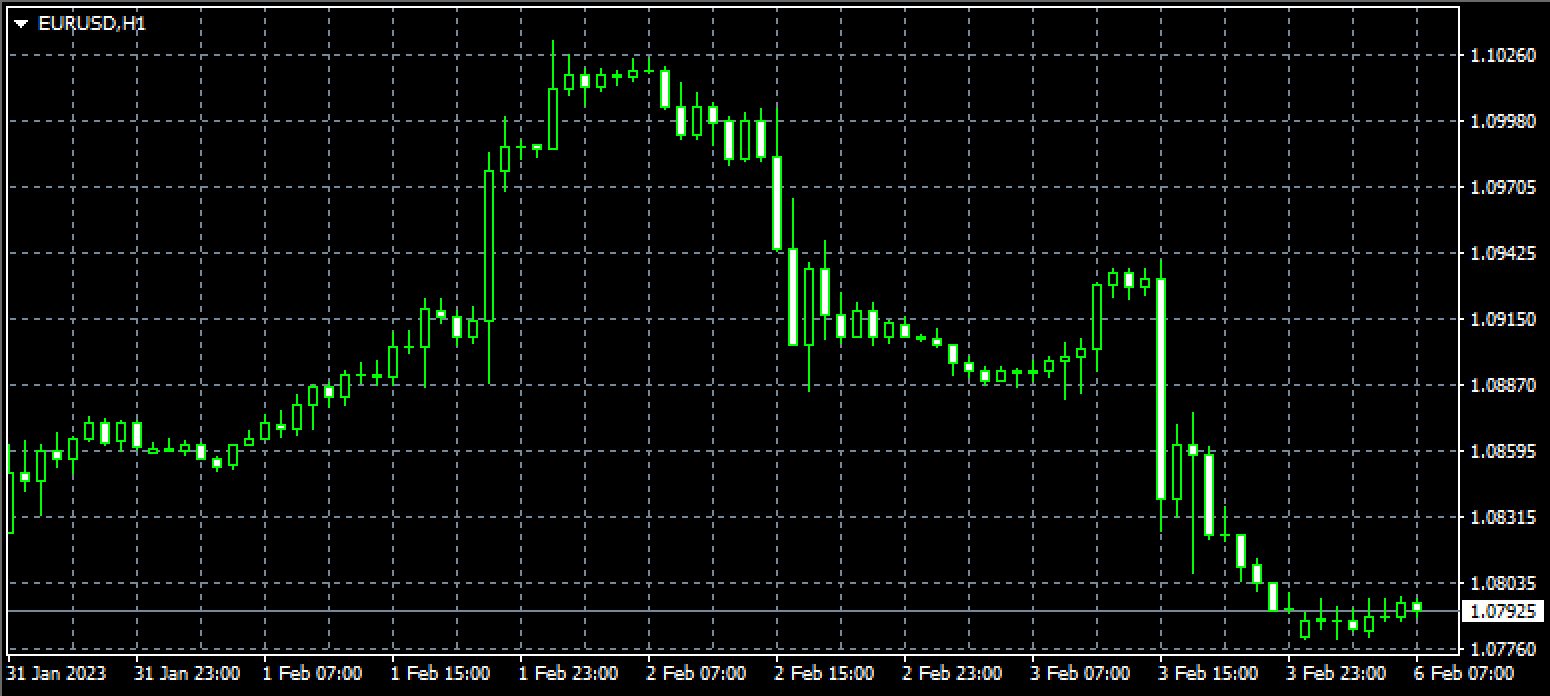
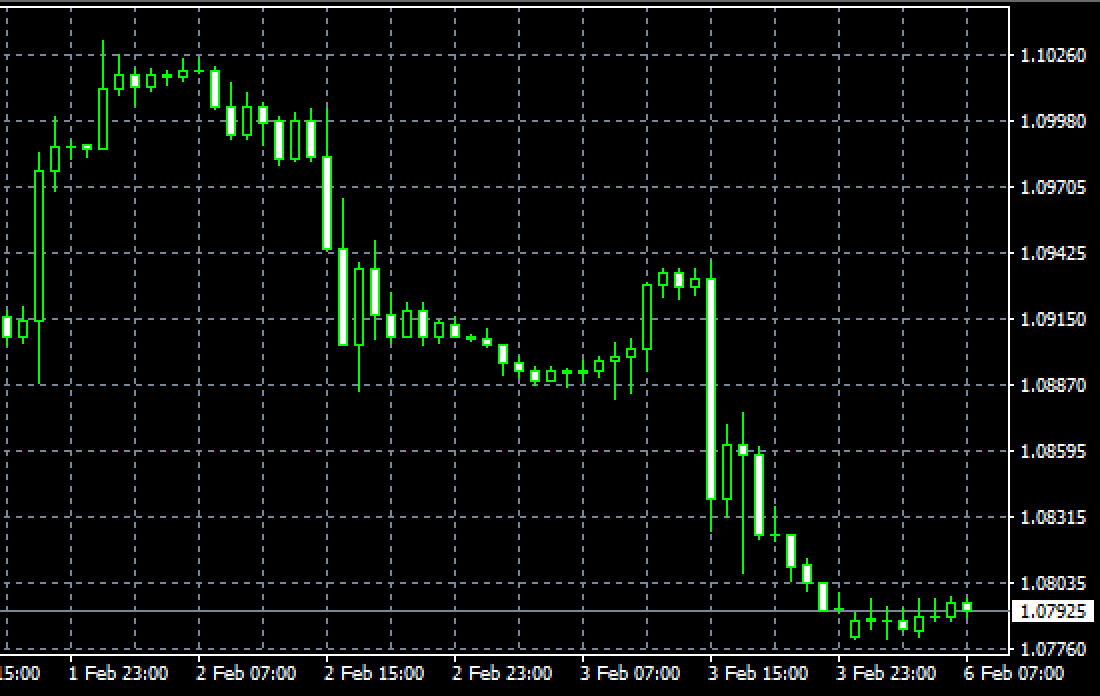
Show/hide gridlines on the chart. When it is checked, gridlines will be displayed on the chart.
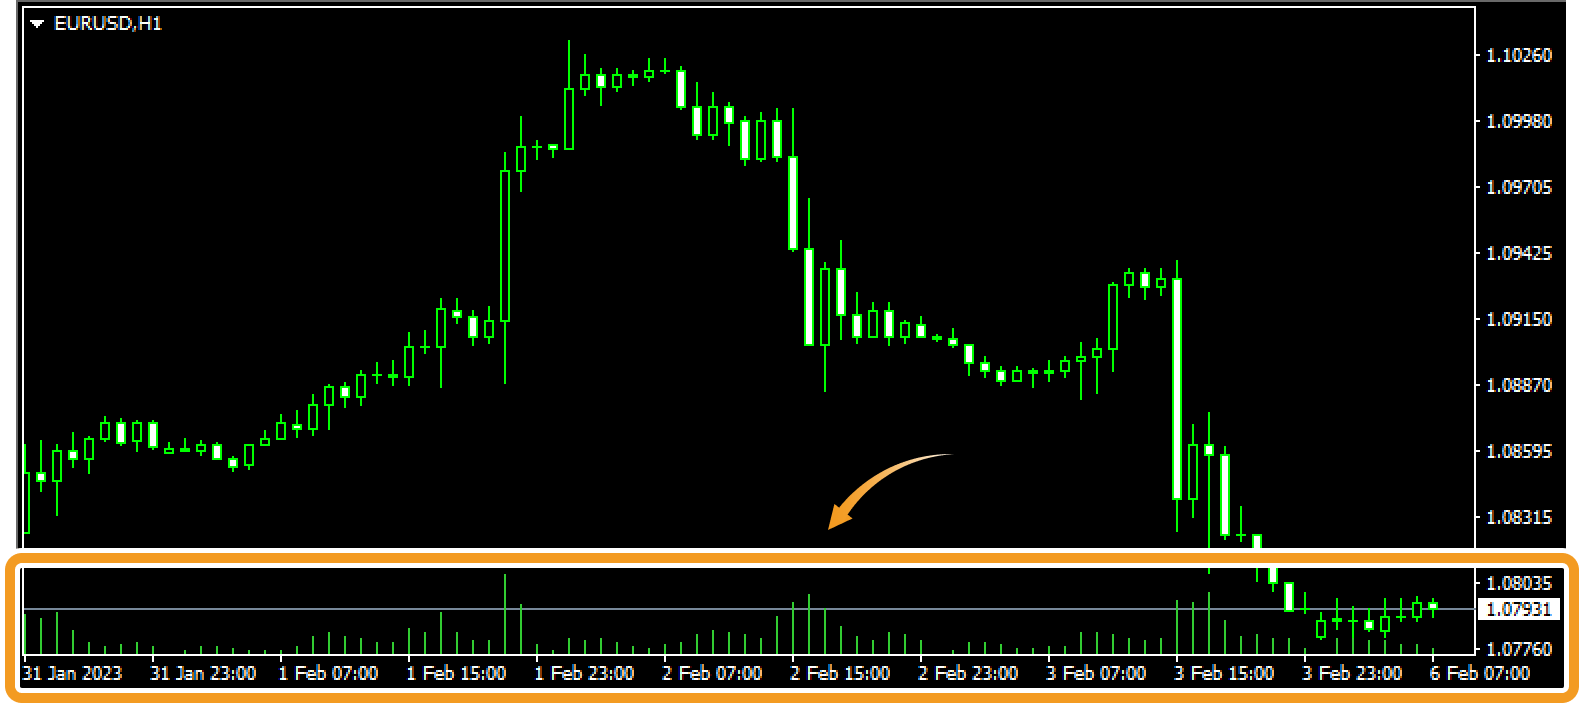
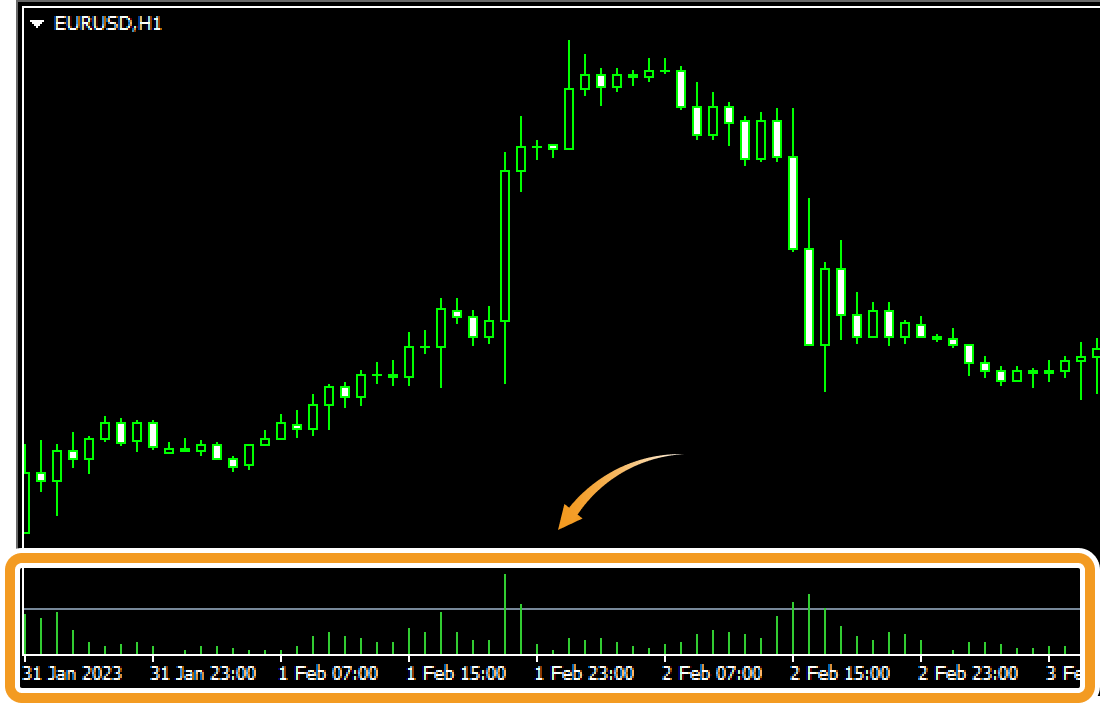
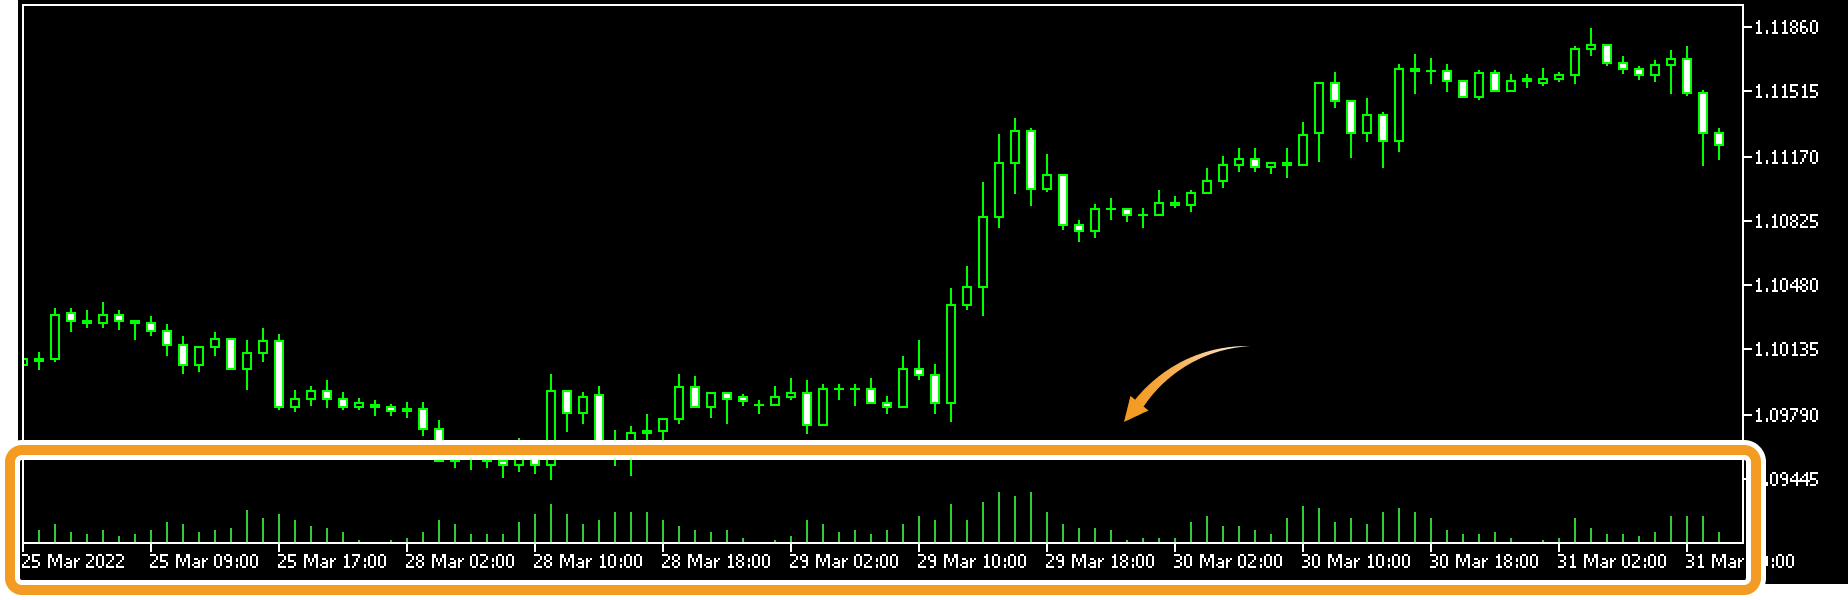
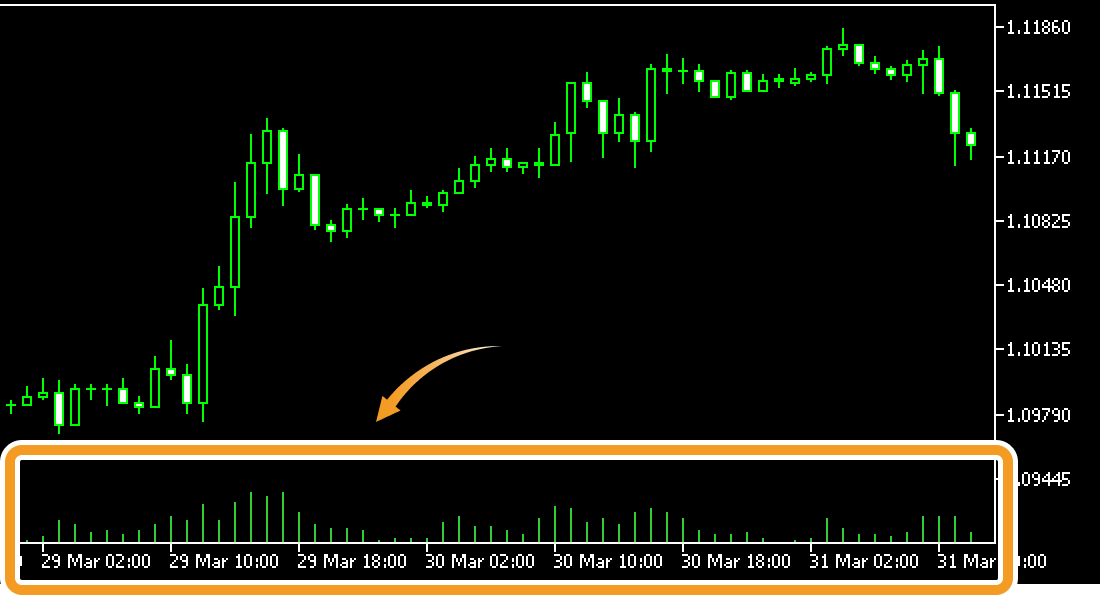
Show/hide volumes. When "Show volumes" is checked, volumes will be displayed at the bottom of the chart.
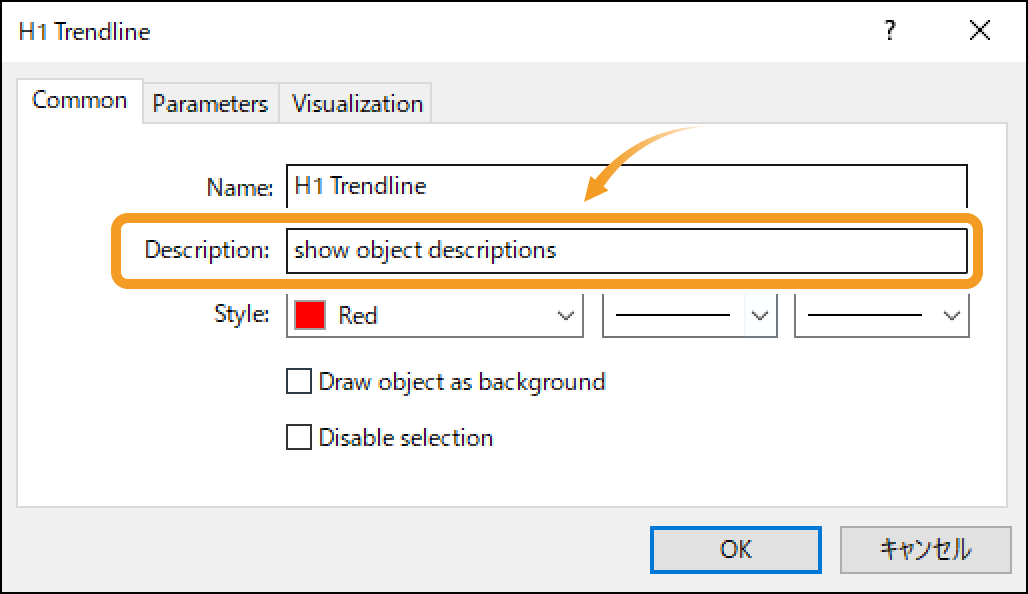
Show/hide the descriptions for objects on the chart. When it is checked, the descriptions will be displayed near the objects. The descriptions can be specified in the object properties window.
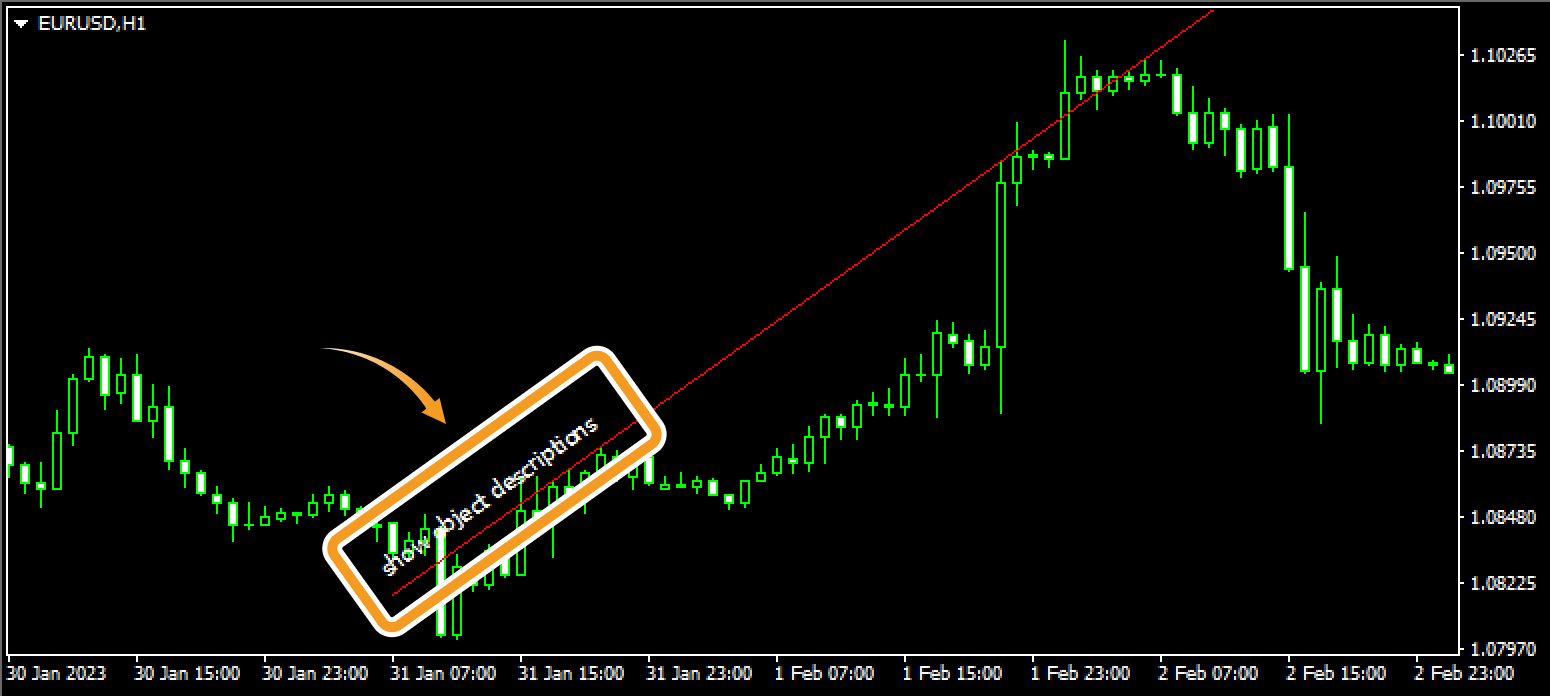
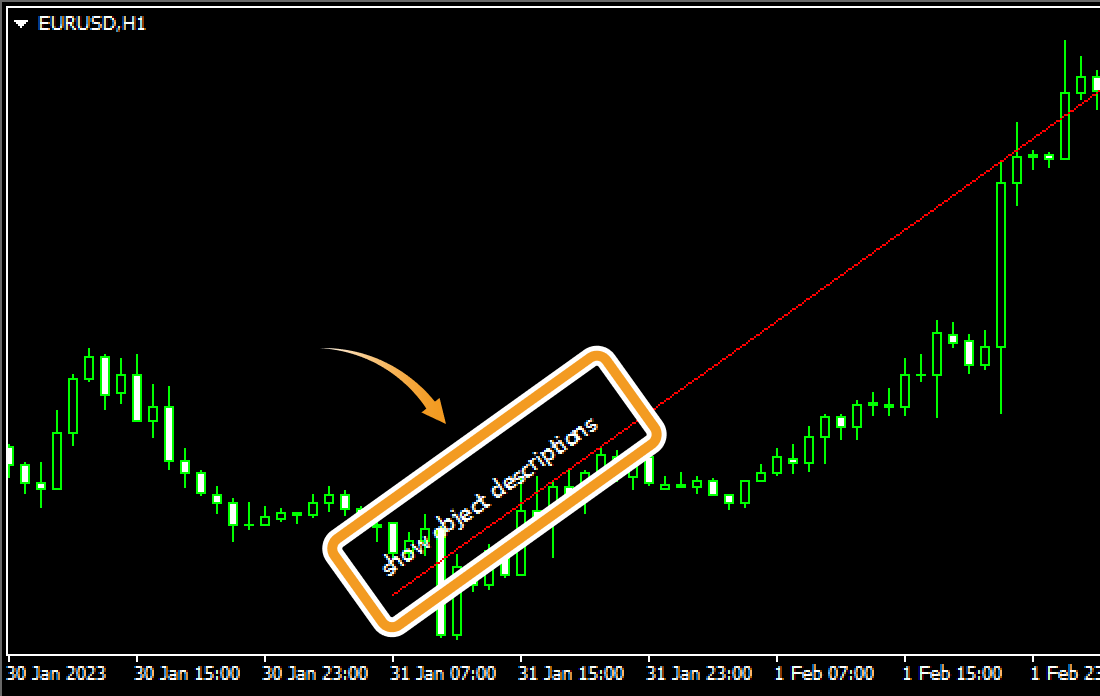
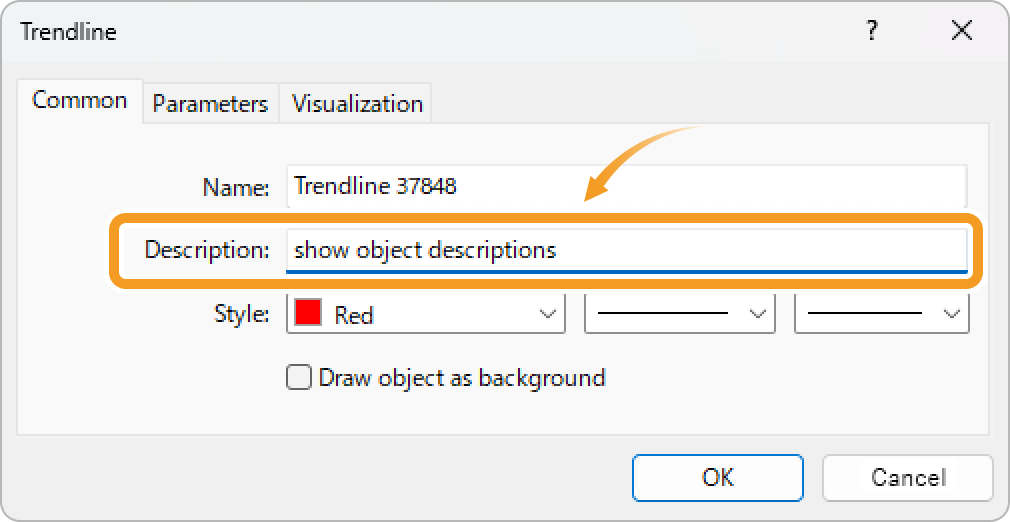
You can set the descriptions to show on the chart in the "Description" of the properties for each object.
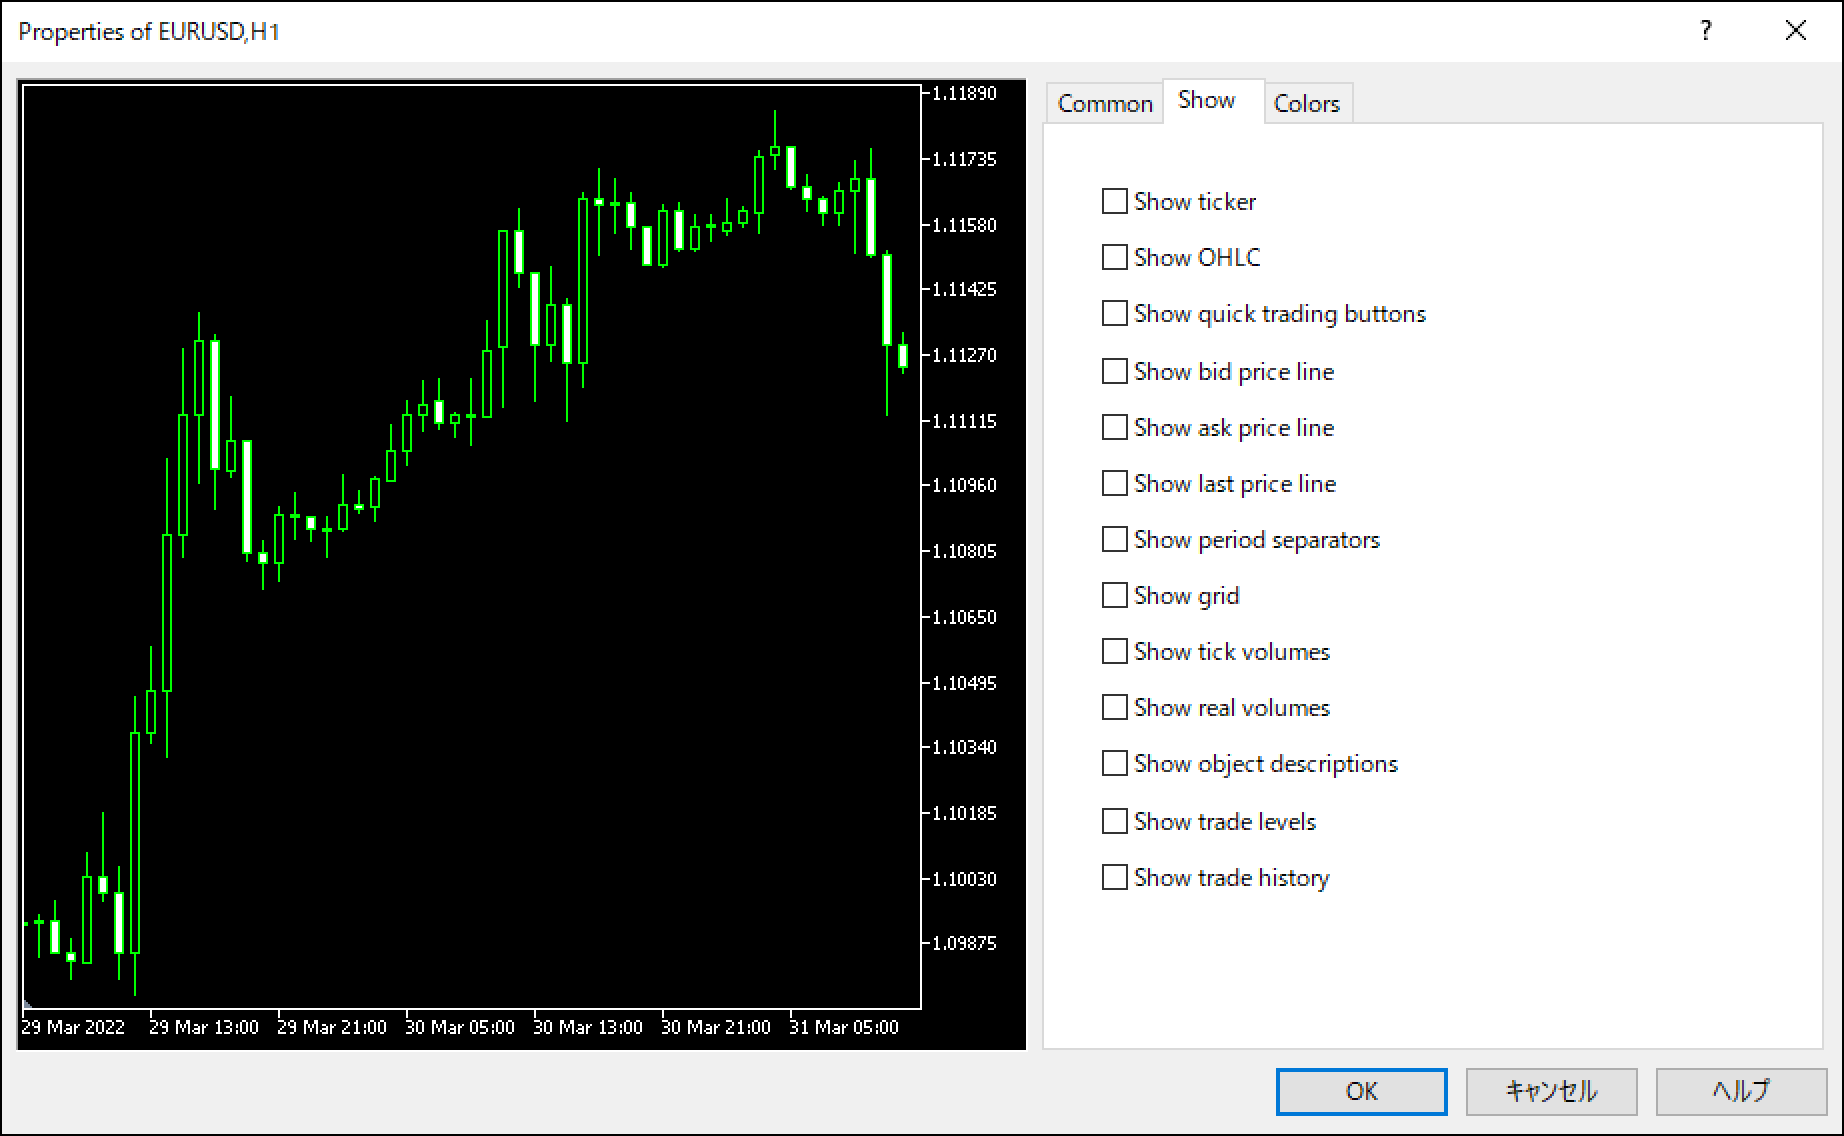
Right-click on the chart and select "Properties".
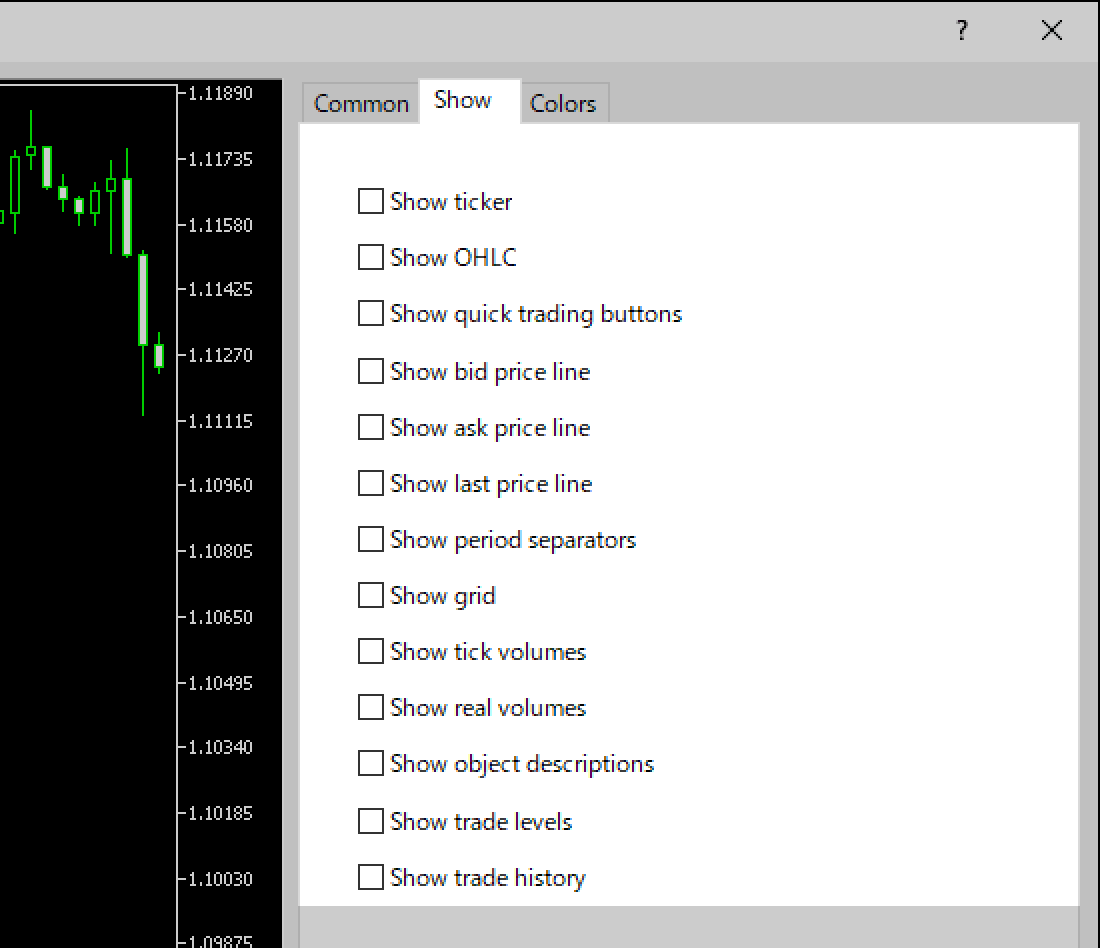
In the "Show" tab, check the items to display on the chart, and uncheck the ones to hide.
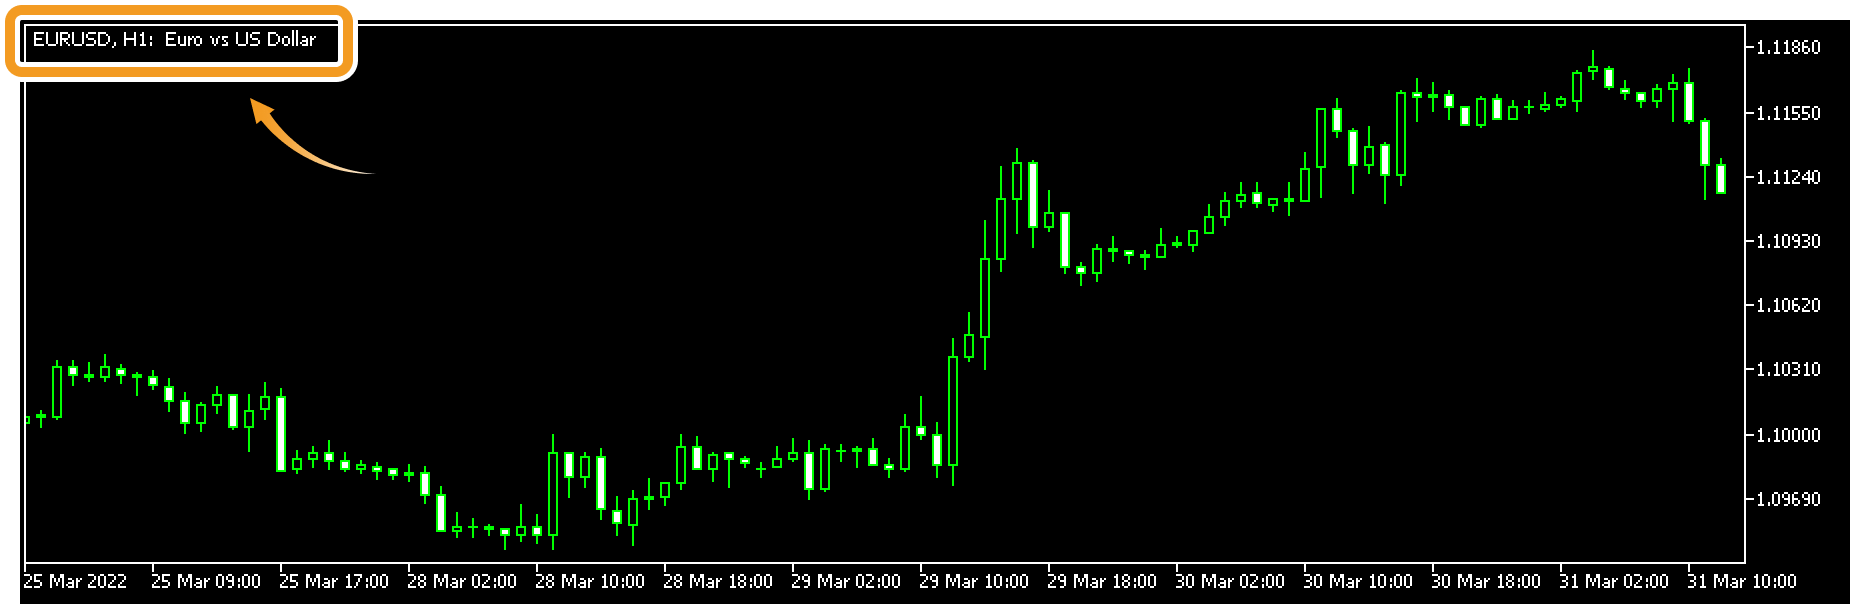
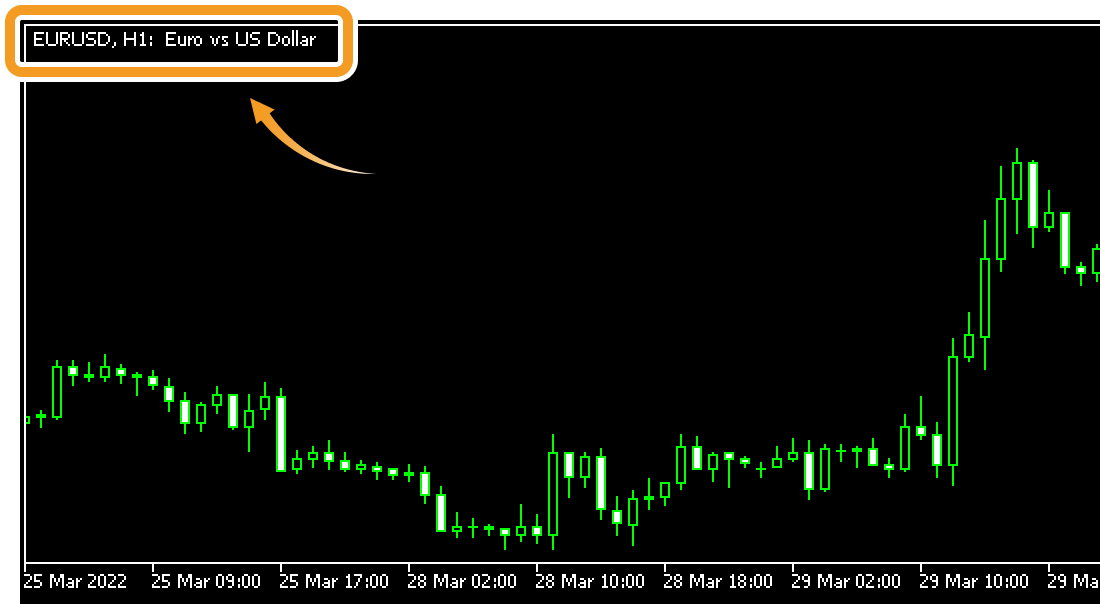
Show/hide ticker. When it is checked, the symbol name will be displayed on the top-left corner of the chart.
Show/hide OHLC. OHLC is short for Open price, High price, Low price, and Close price. When it is checked, OHLC prices will be displayed on the top-left corner of the chart in the same order.
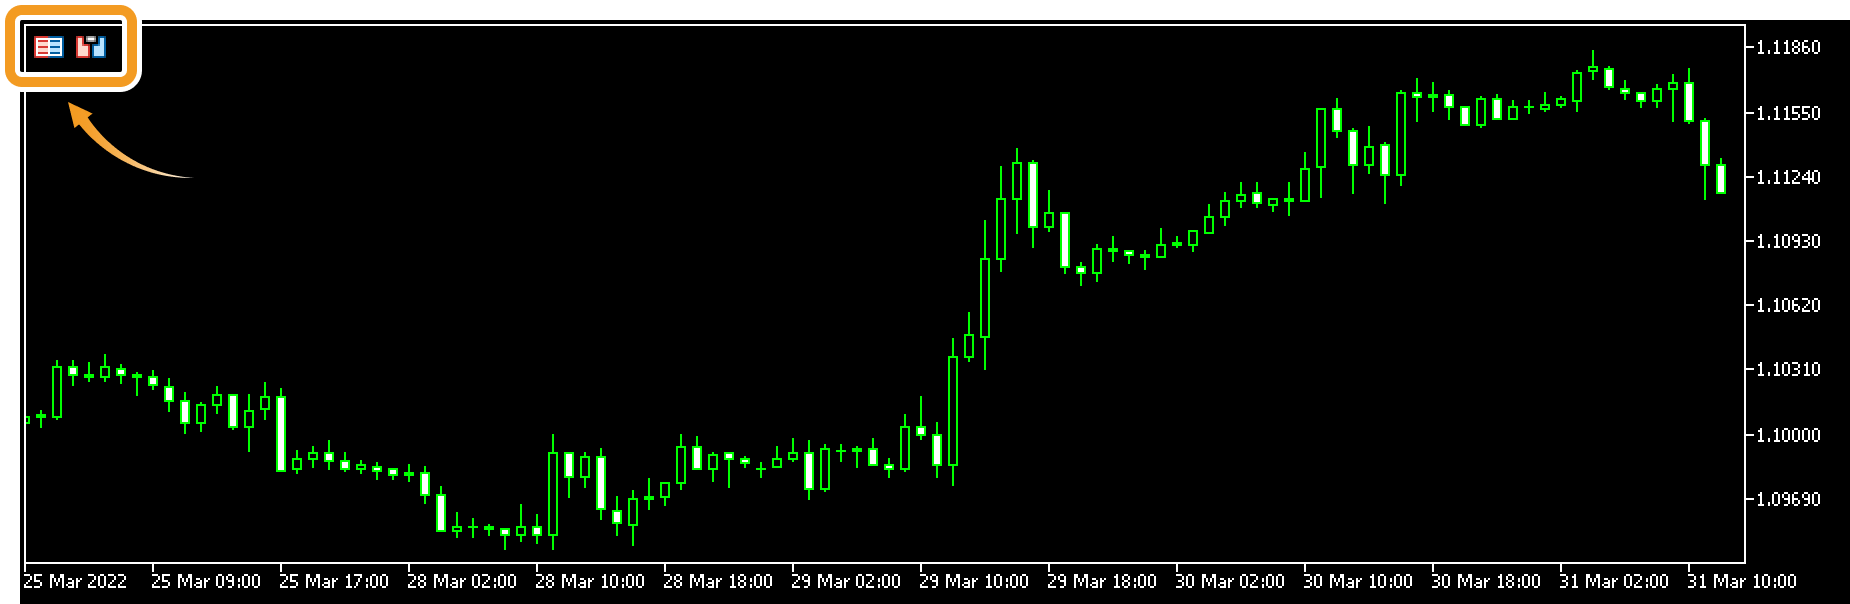
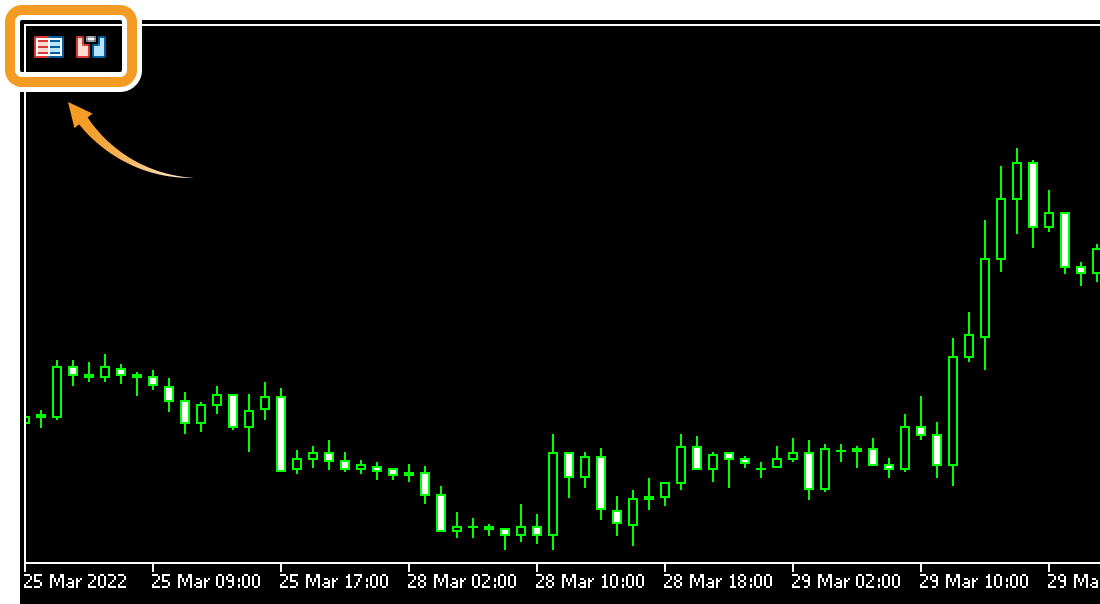
Show/hide buttons for "One Click Trading" and "Depth Of Market". When it is checked, the buttons for "One Click Trading" and "Depth Of Market" will be displayed on the top left corner of the chart.
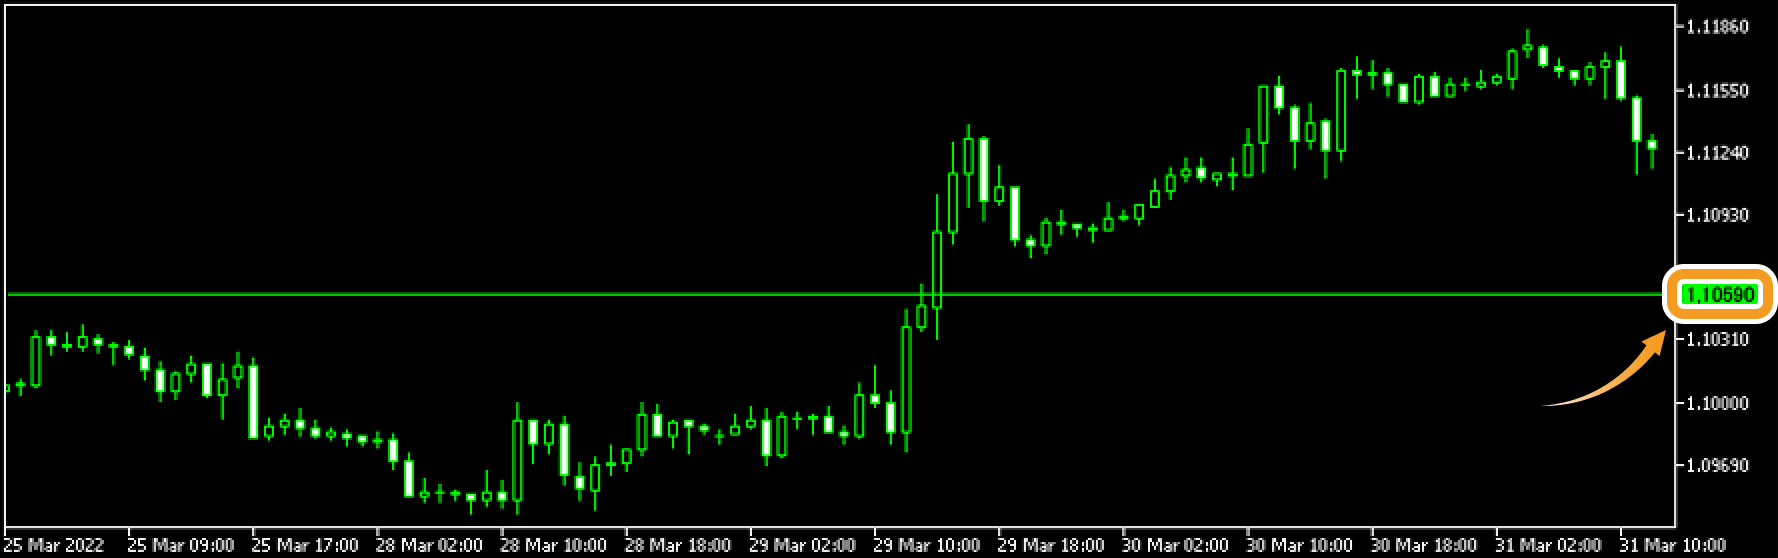
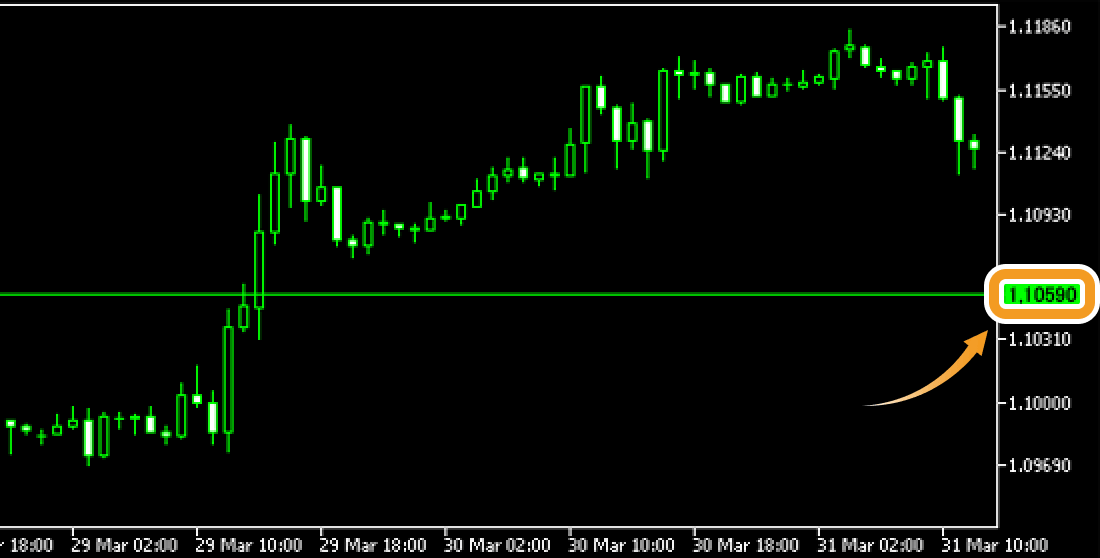
Show/hide Ask and Bid prices. When "Show bid price line" is checked, the bid price will be displayed on the chart. When "Show ask price line" is checked, the ask price will be displayed on the chart.
MetaTrader5 (MT5) charts are created using Bid value. By default, the Bid values are shown on the chart. You cannot create a chart based on Ask in MT5.
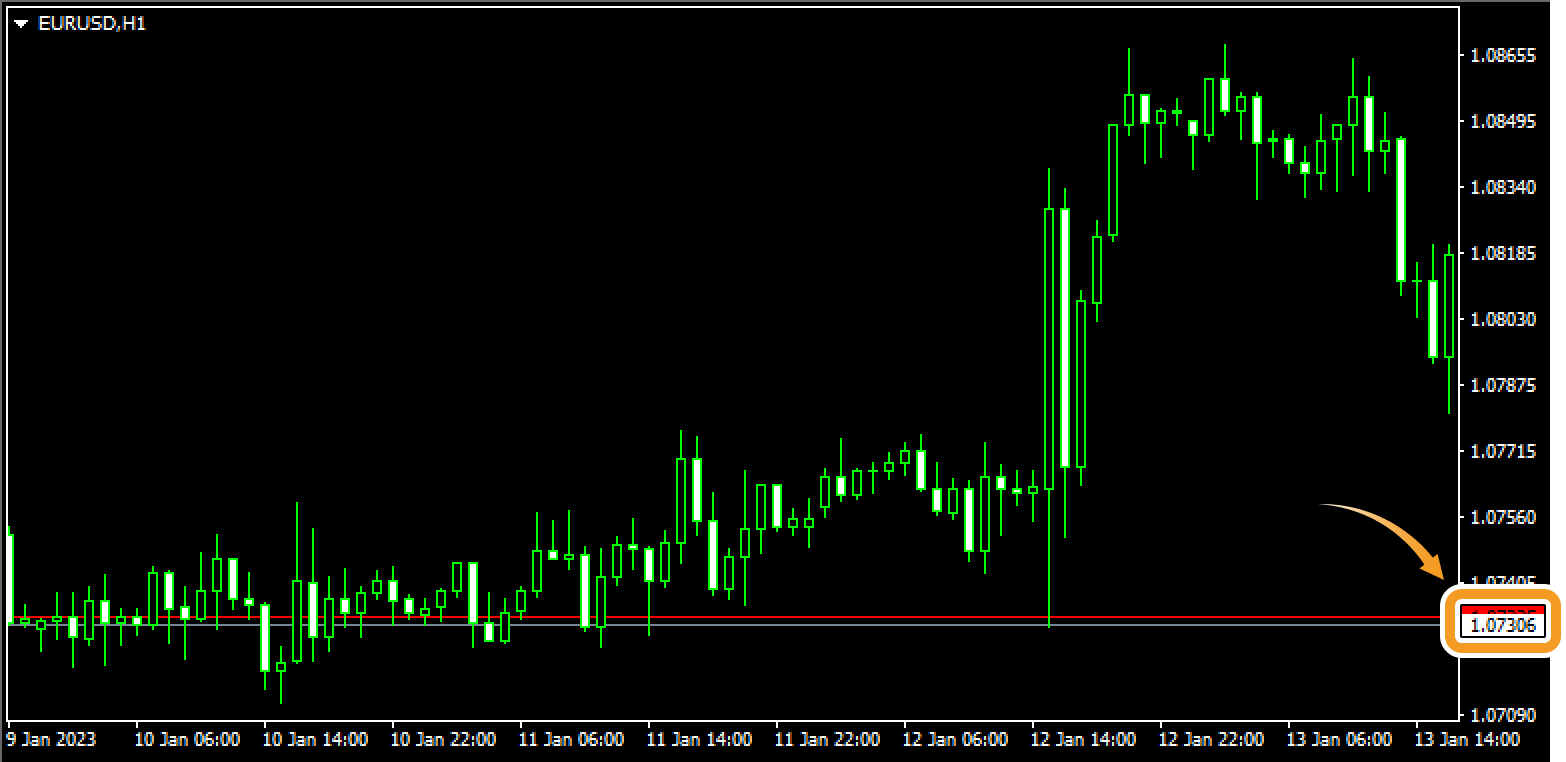
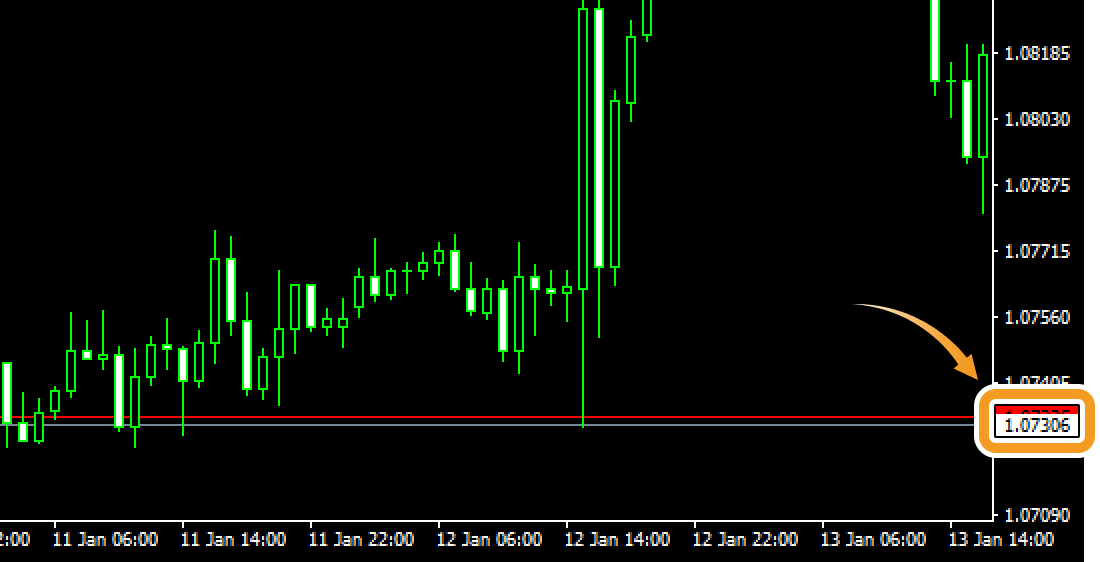
Show/hide the last traded price. When it is checked, the last price will be displayed. It will not be displayed if it is not provided by your broker.
Show/hide gridlines on the chart. When it is checked, gridlines will be displayed on the chart.
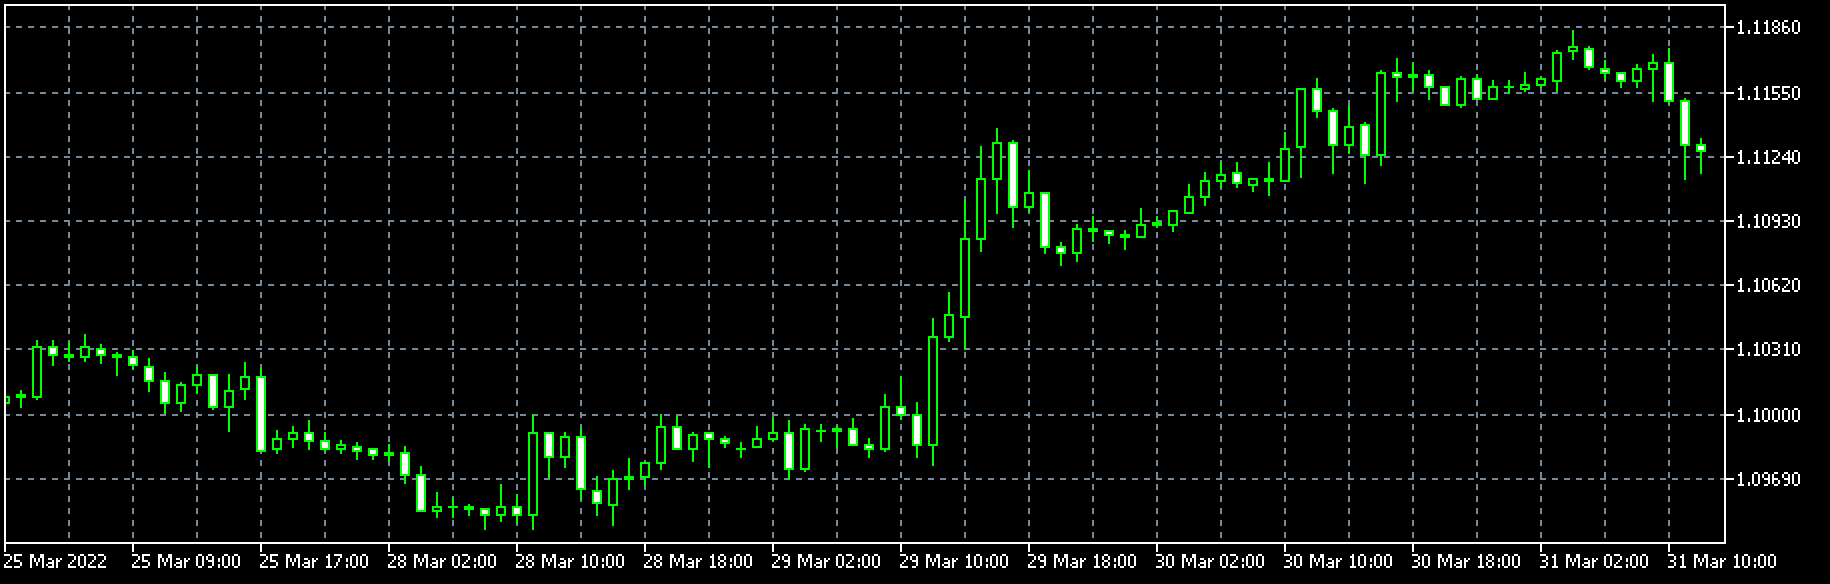
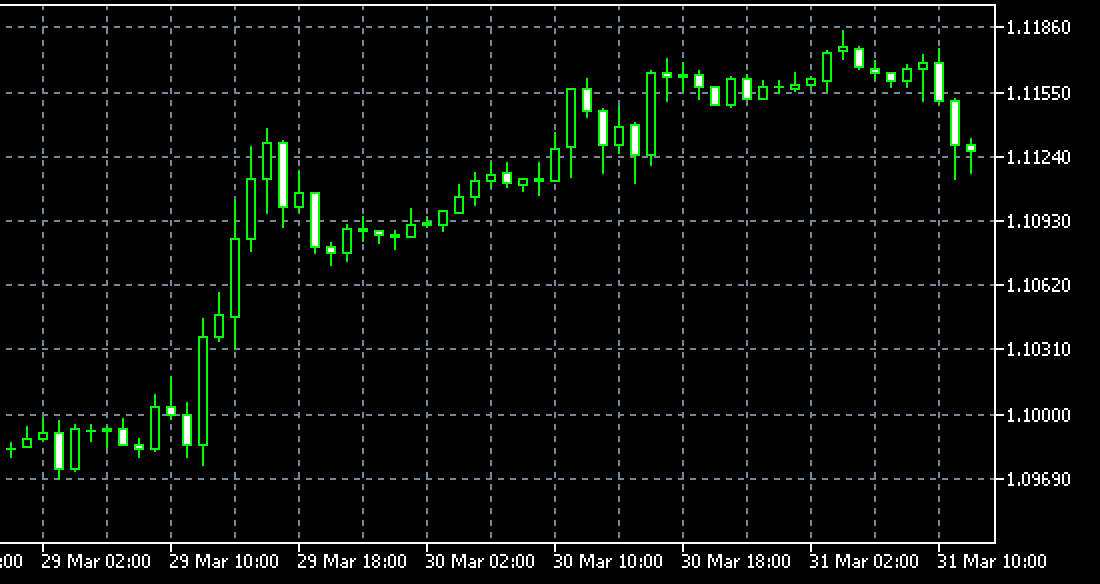
Show/hide period separators. The interval varies depending on the timeframe. When it is checked, period separators will be displayed on the chart.
| Separator interval | Timeframe |
|---|---|
| Daily | M1, M2, M3, M4, M5, M6, M10, M12, M15, M20, M30, H1, H2 |
| Weekly | H3, H4, H6, H8, H12 |
| Monthly | D1 |
| Yearly | W1, MN |
Show/hide tick volumes and real volumes. When "Show tick volumes" is checked, tick volumes will be displayed on the sub-window. When "Show real volumes" is checked, real volumes will be displayed on the sub-window.
Tick volume displayed in MT5 comes from the forex broker. The volume displays the total trade volume. Since MT5 cannot calculate the trade volume of forex and CFD symbols traded outside of the exchange, it uses ticks provided by the broker to analyze market liquidity and price movements. A rise in liquidity means more tick updates, and a decrease in liquidity means fewer tick updates.
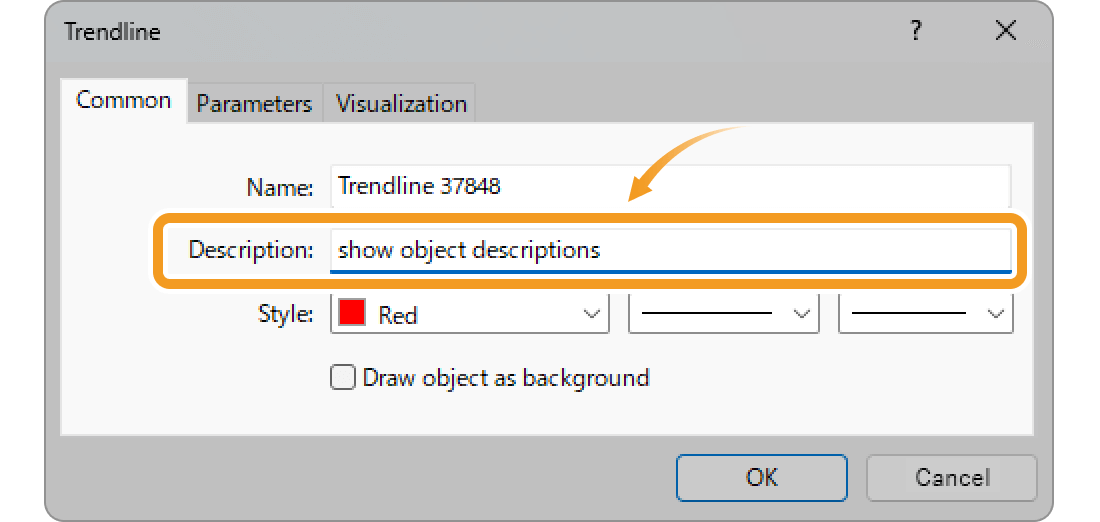
Show/hide the descriptions for objects on the chart. When it is checked, the descriptions will be displayed near the objects. The descriptions can be specified in the object properties window.
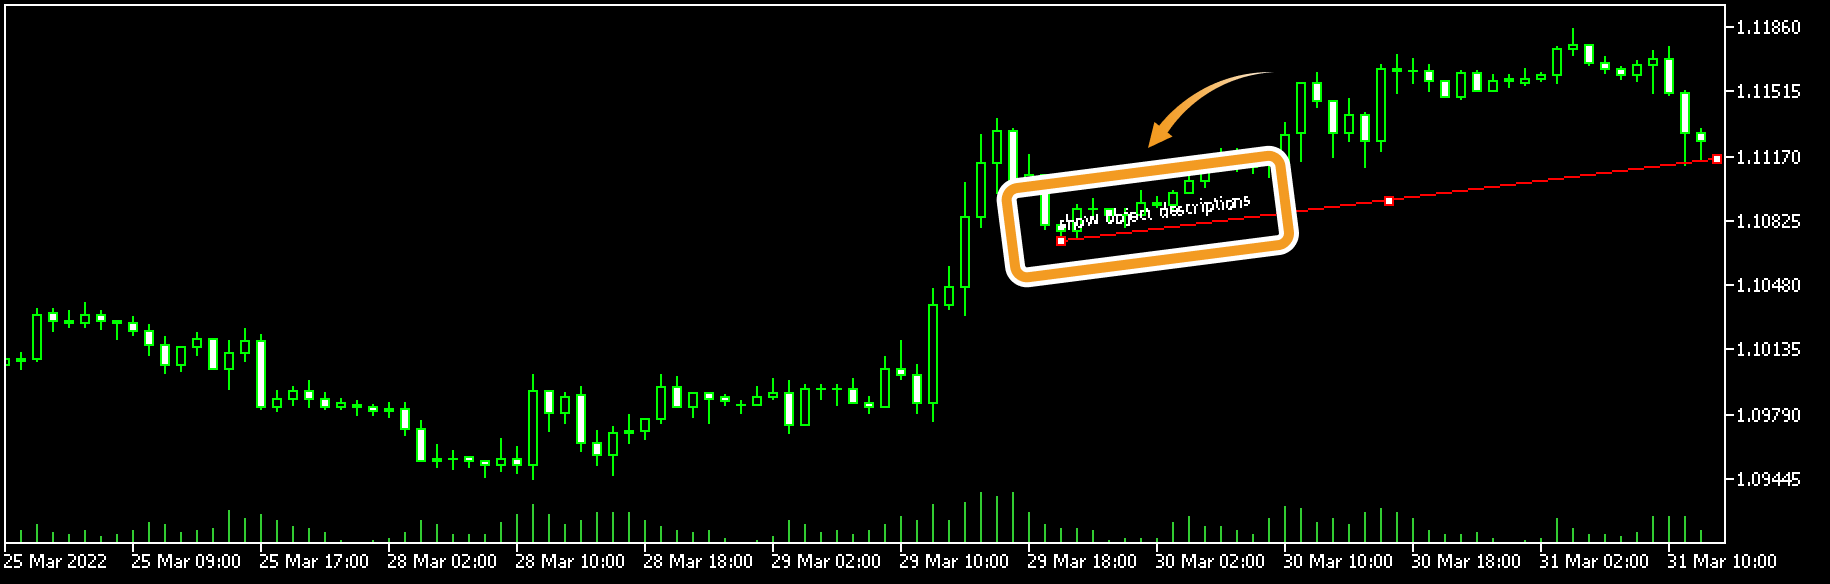
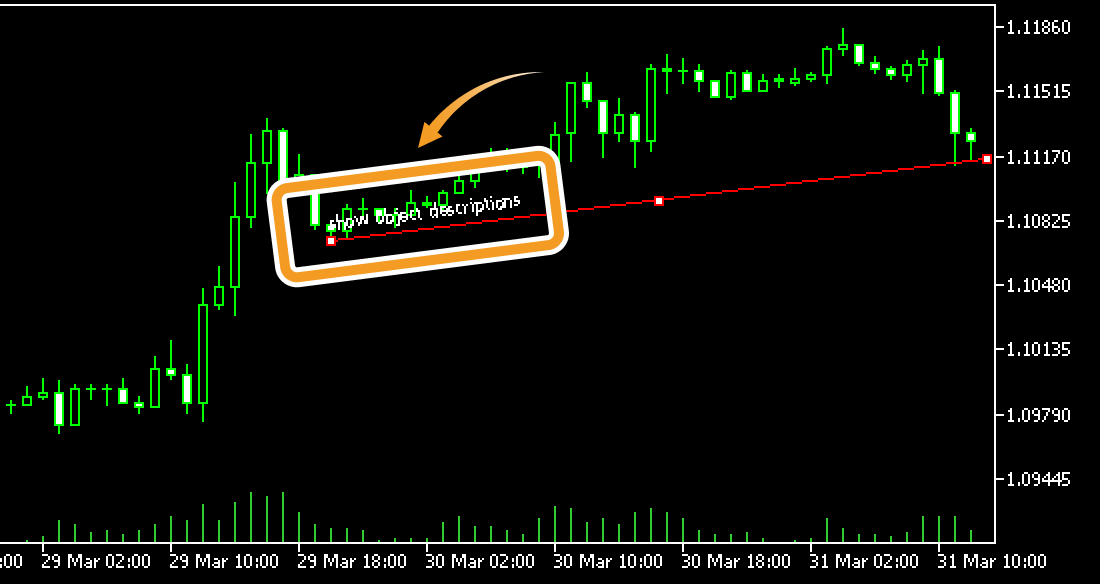
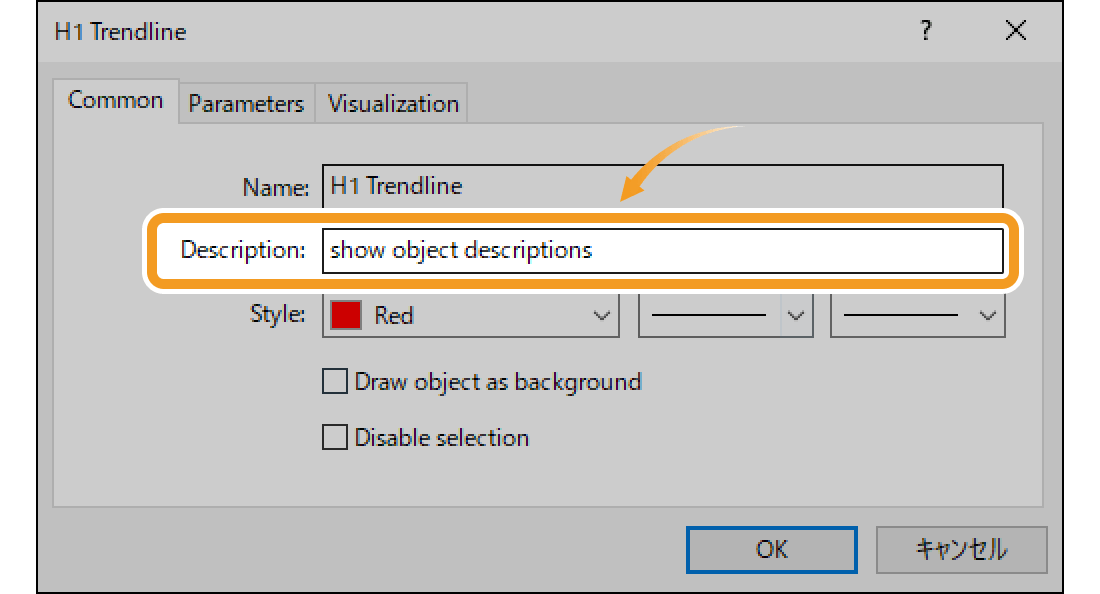
You can set the descriptions to show on the chart in the "Description" of the properties for each object.
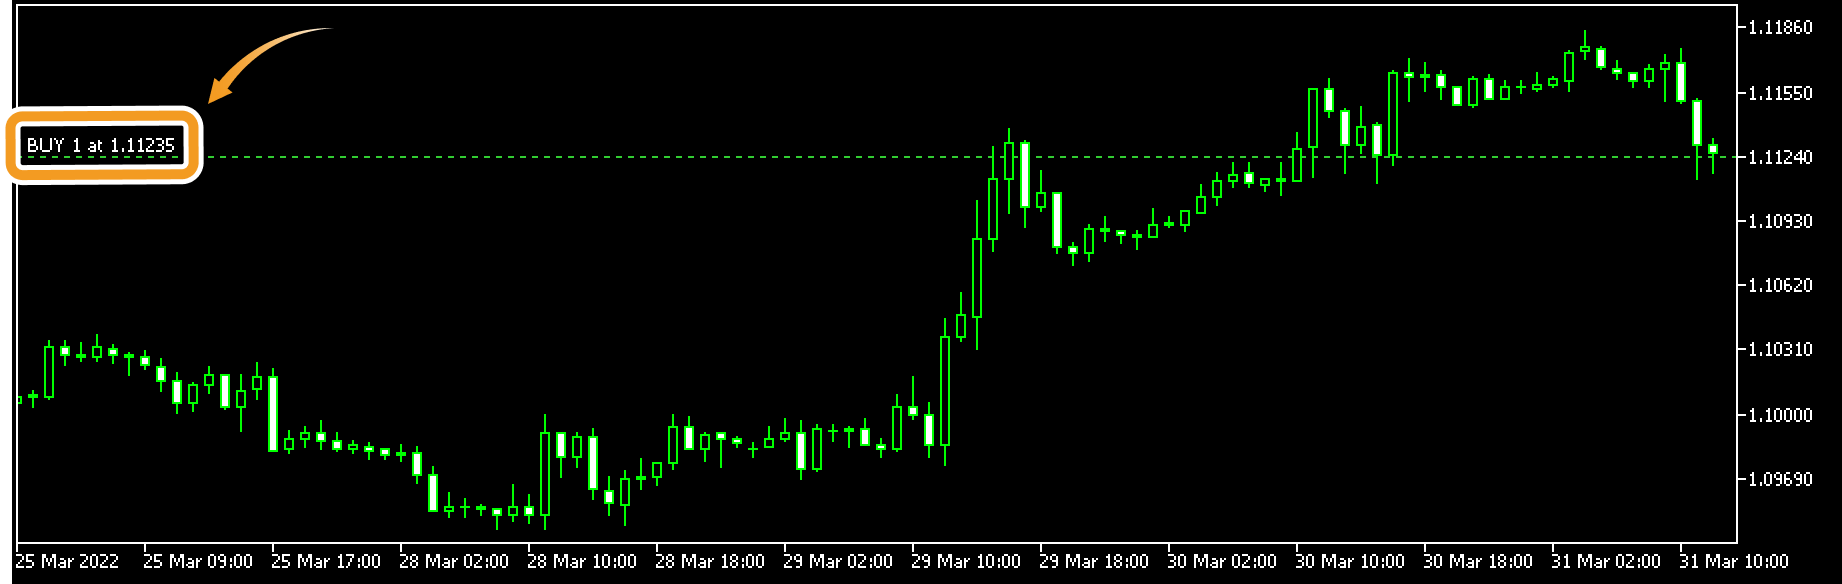
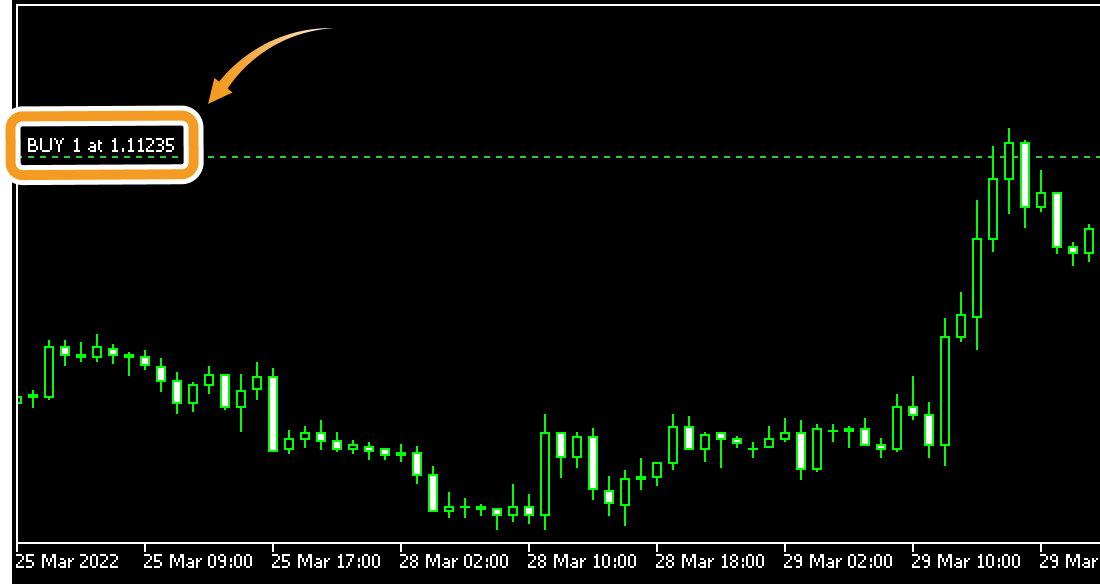
Show/hide the open price for the position you are holding. When it is checked, order type, volume, and open price will be displayed on the chart.
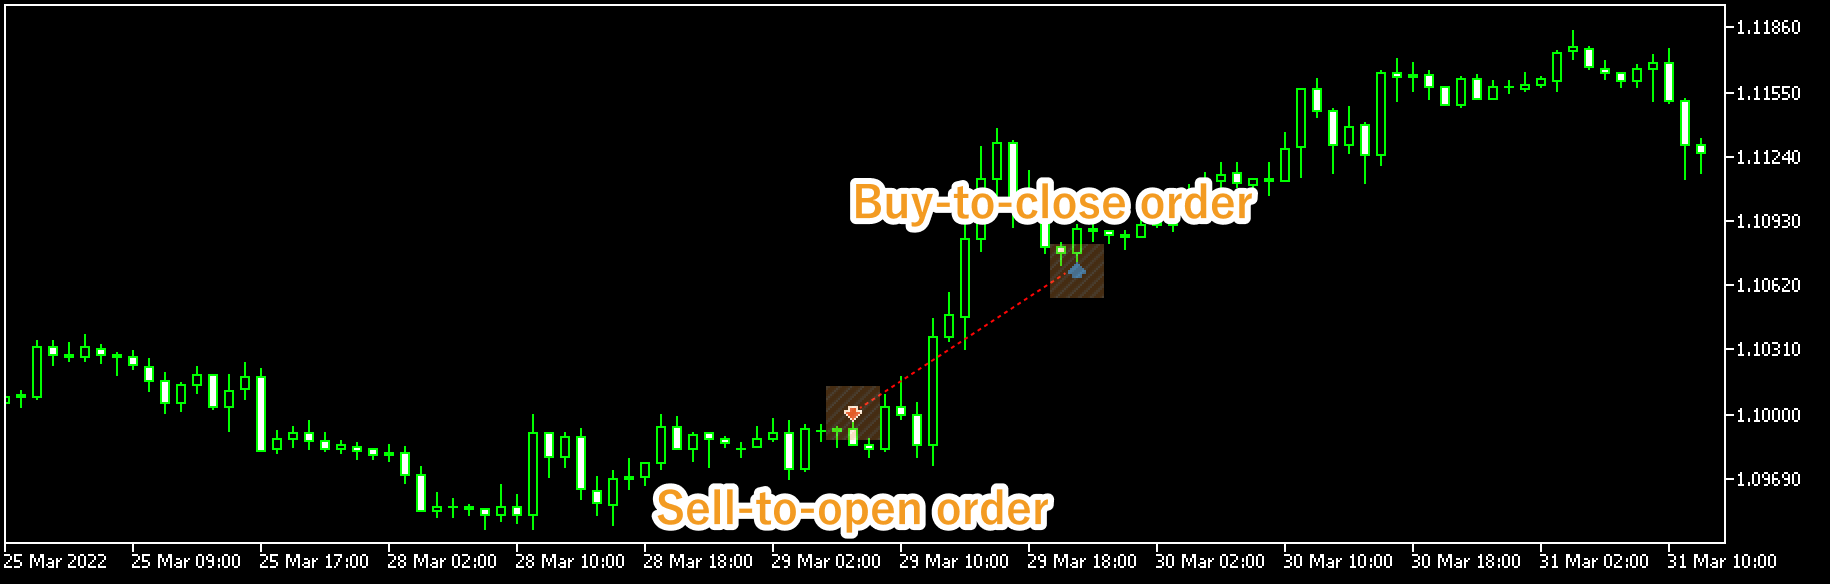
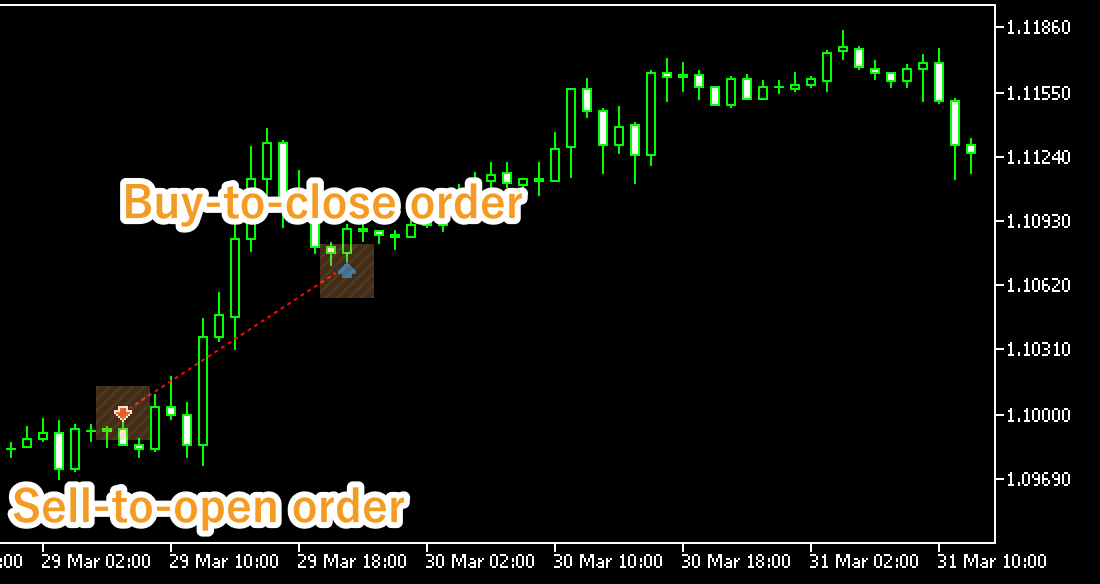
Show/hide trade history. When it is checked, blue arrows will be displayed where buy-to-open or buy-to-close order was executed. For sell-to-open or sell-to-close order, red arrows will be shown.
Related article: Display arrows and other objects
Was this article helpful?
0 out of 0 people found this article helpful.
Thank you for your feedback.