MT4/MT5: Change chart type
Charts (PC)
Charts (PC)

This article was :
published
updated
On MetaTrader4 (MT4) / MetaTrader5 (MT5), you can choose from three chart types: bar chart, candlesticks, and line chart. When displaying multiple chart screens, you can switch the chart type for every chart.
Here we'll look at how to change the chart type on MT4/MT5. You can change it from the menu, toolbar, or chart properties. Additionally, in MT5, you can change it from the context menu by right-clicking on a chart.
Switch between MT4/MT5 tabs to check the steps for each.
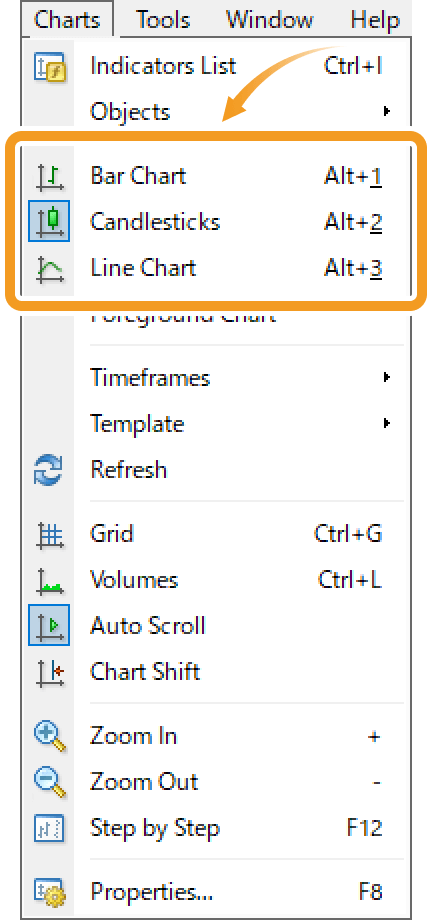
Click "Charts" in the menu and select a chart type.
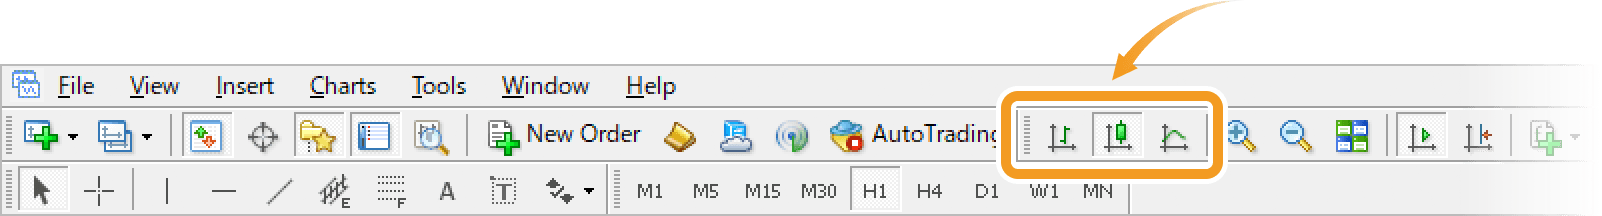
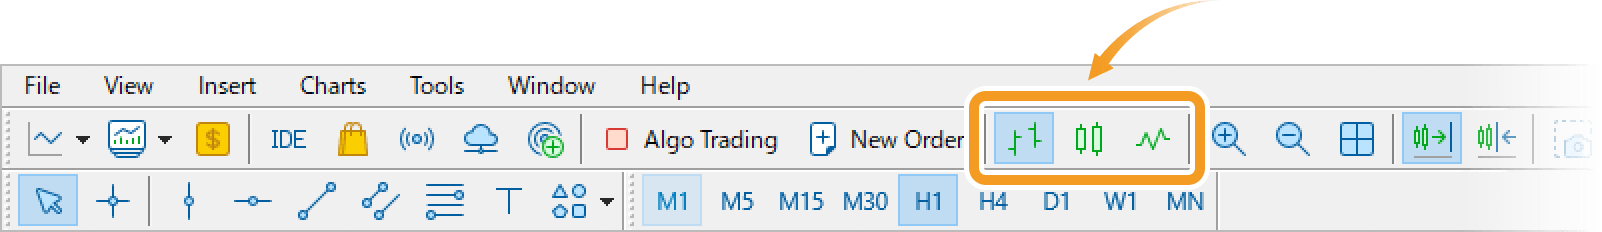
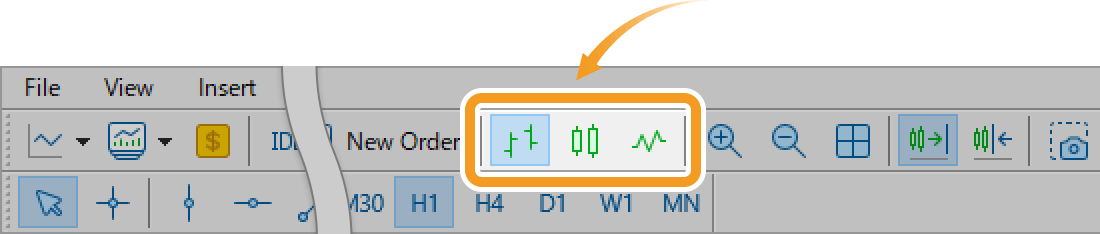
Select from "Bar chart", "Candlesticks", or "Line chart" in the toolbar.
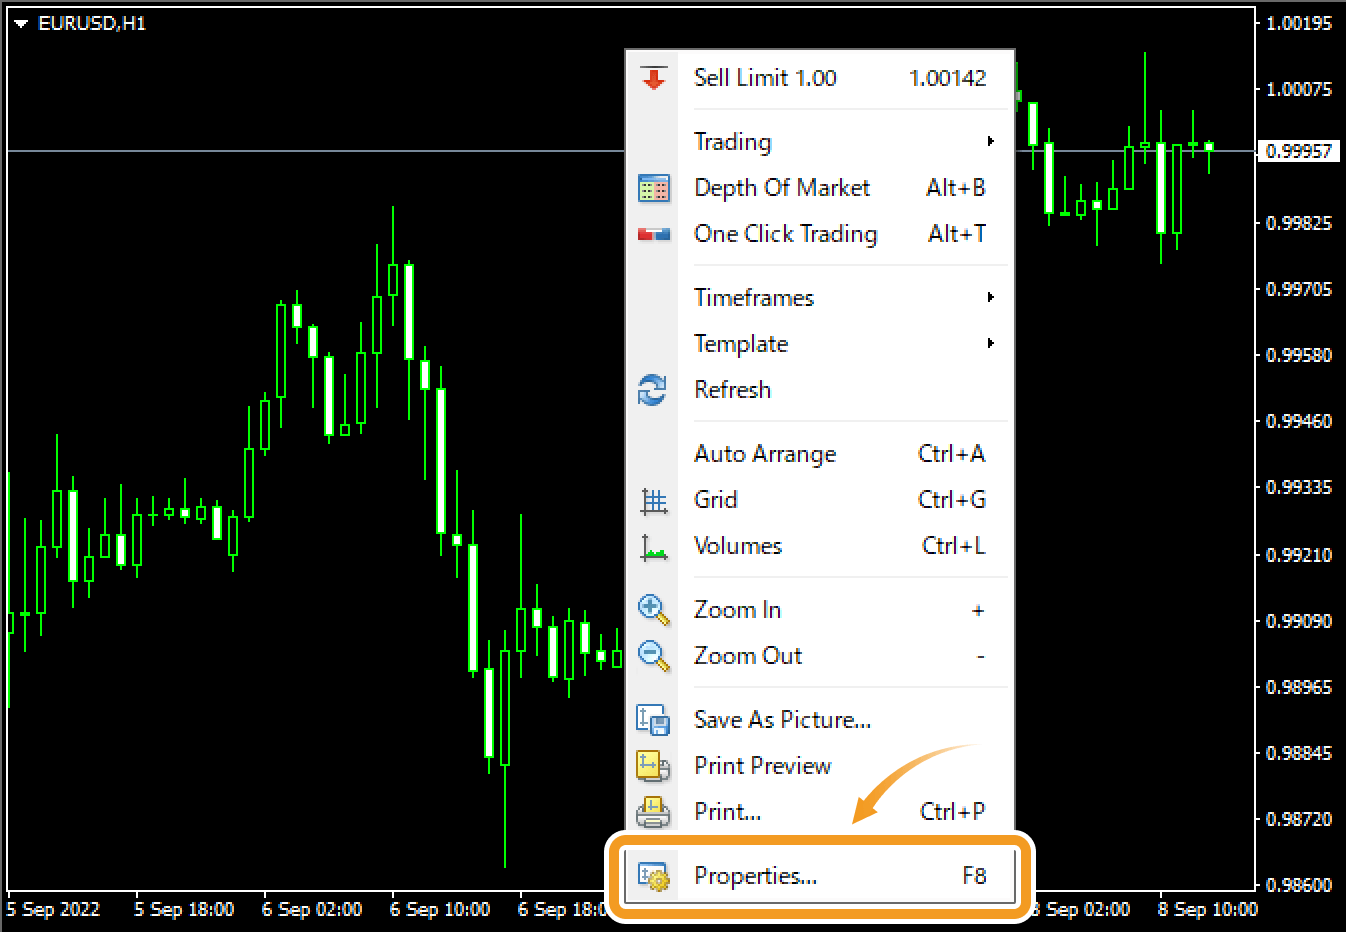
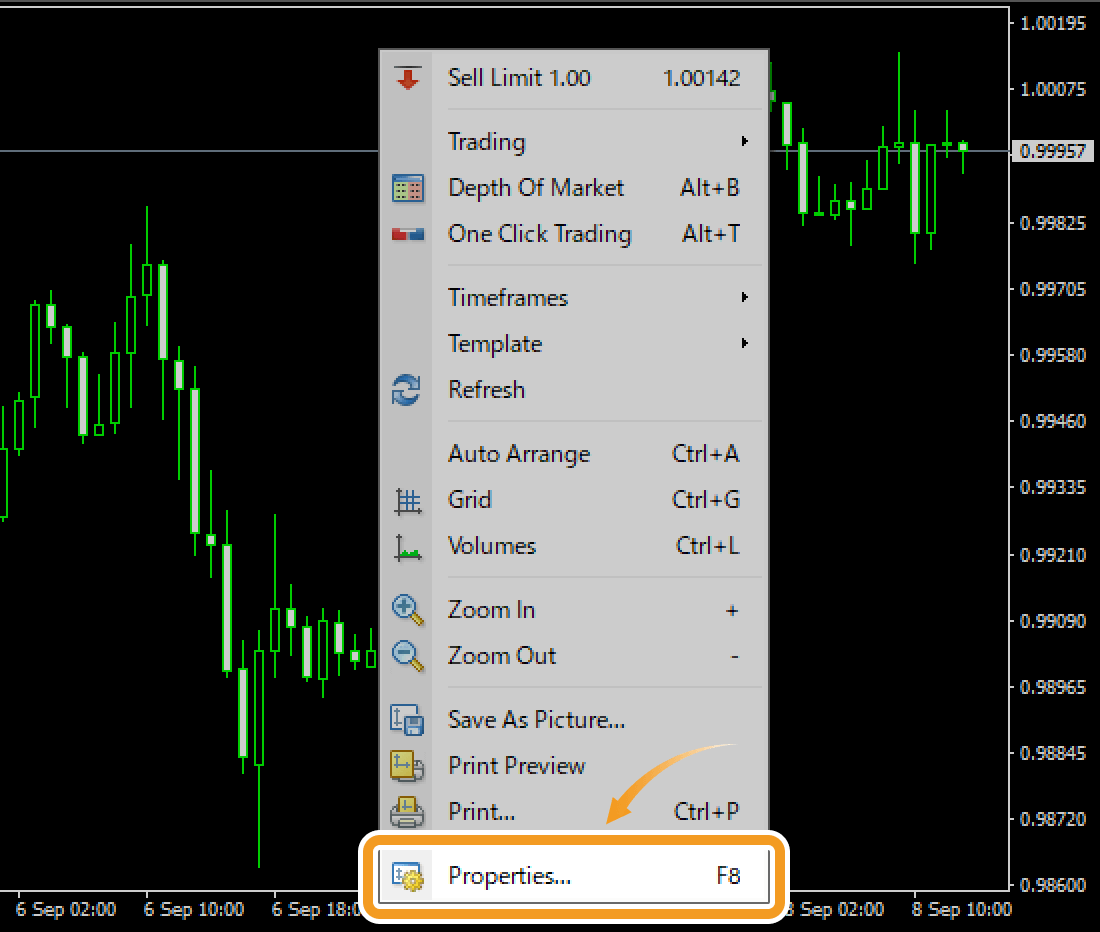
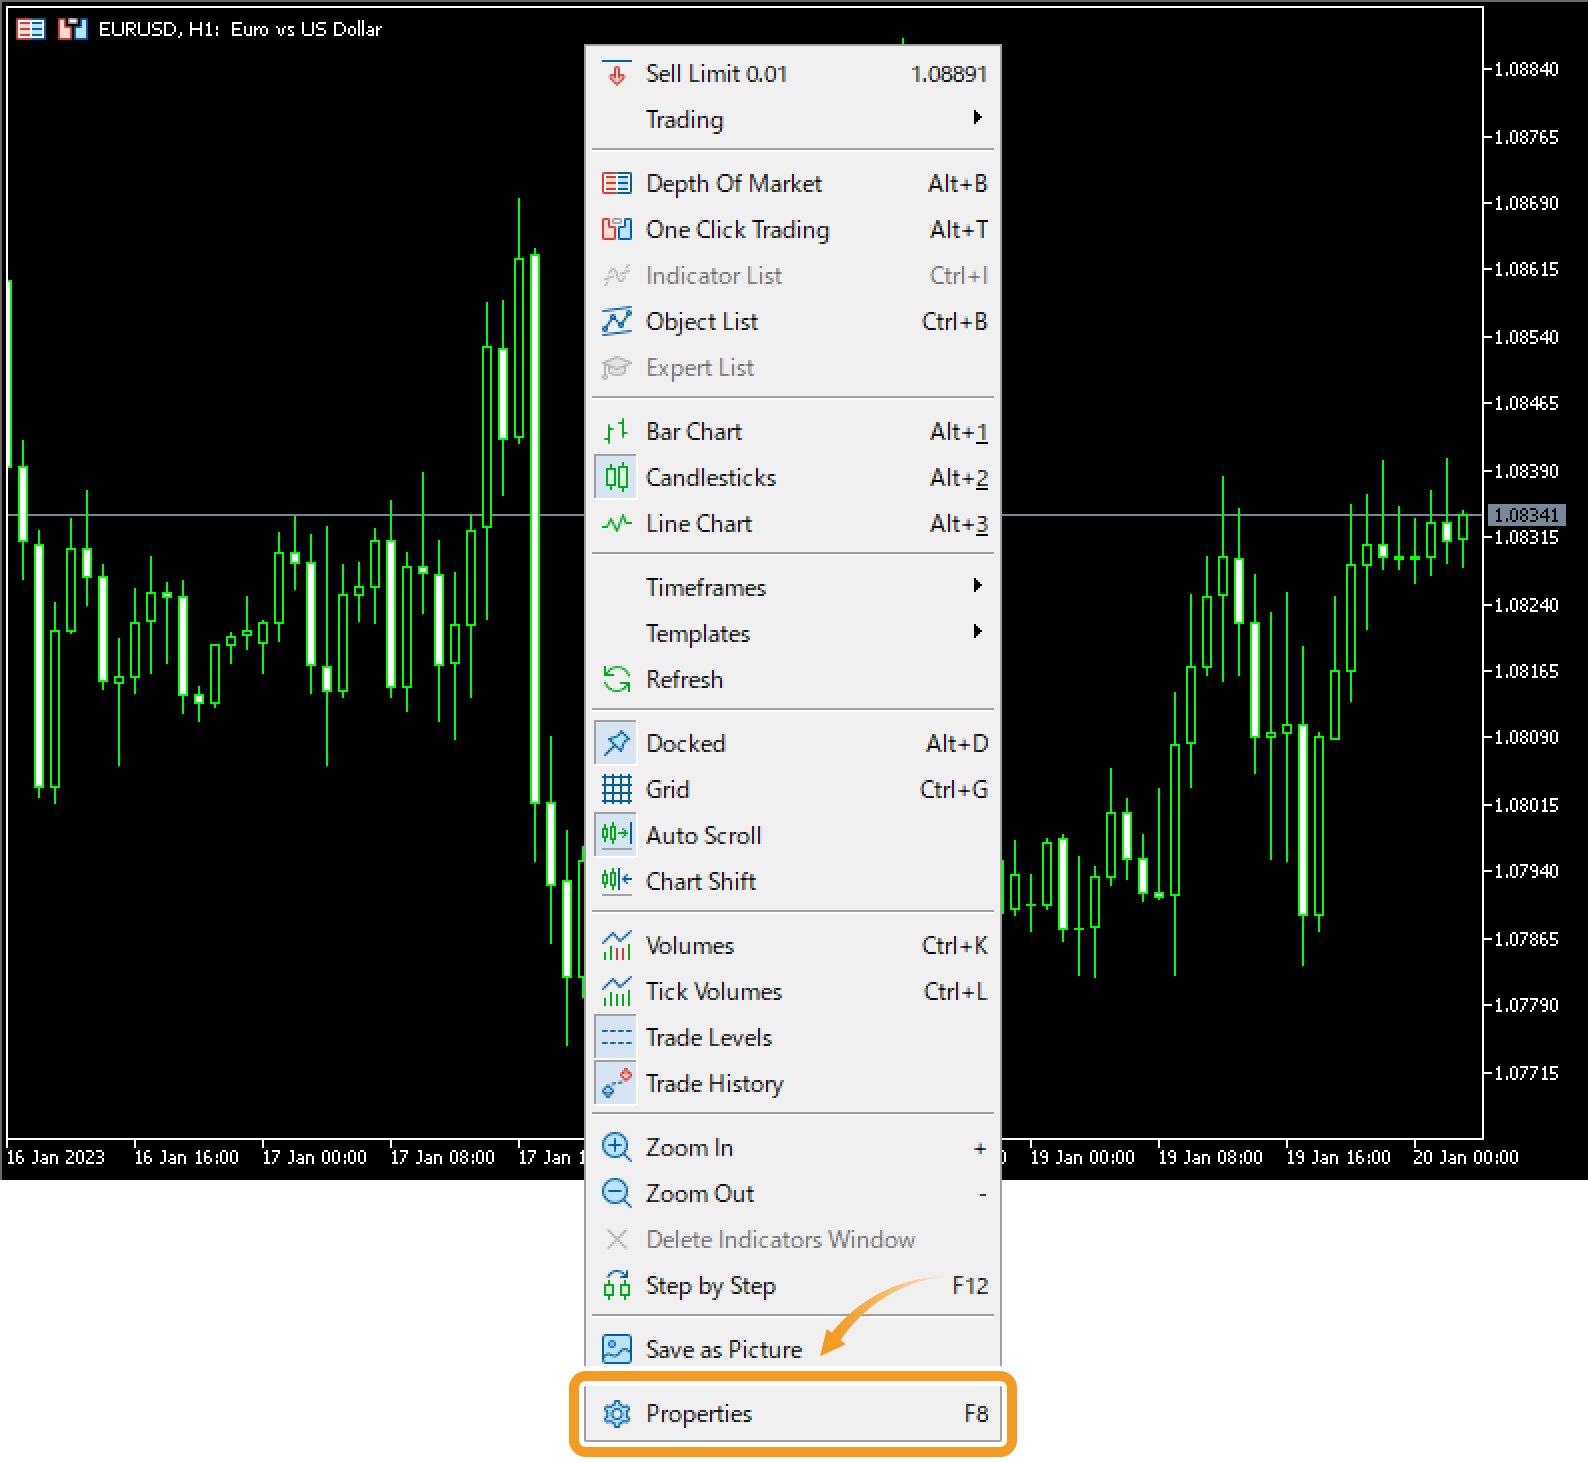
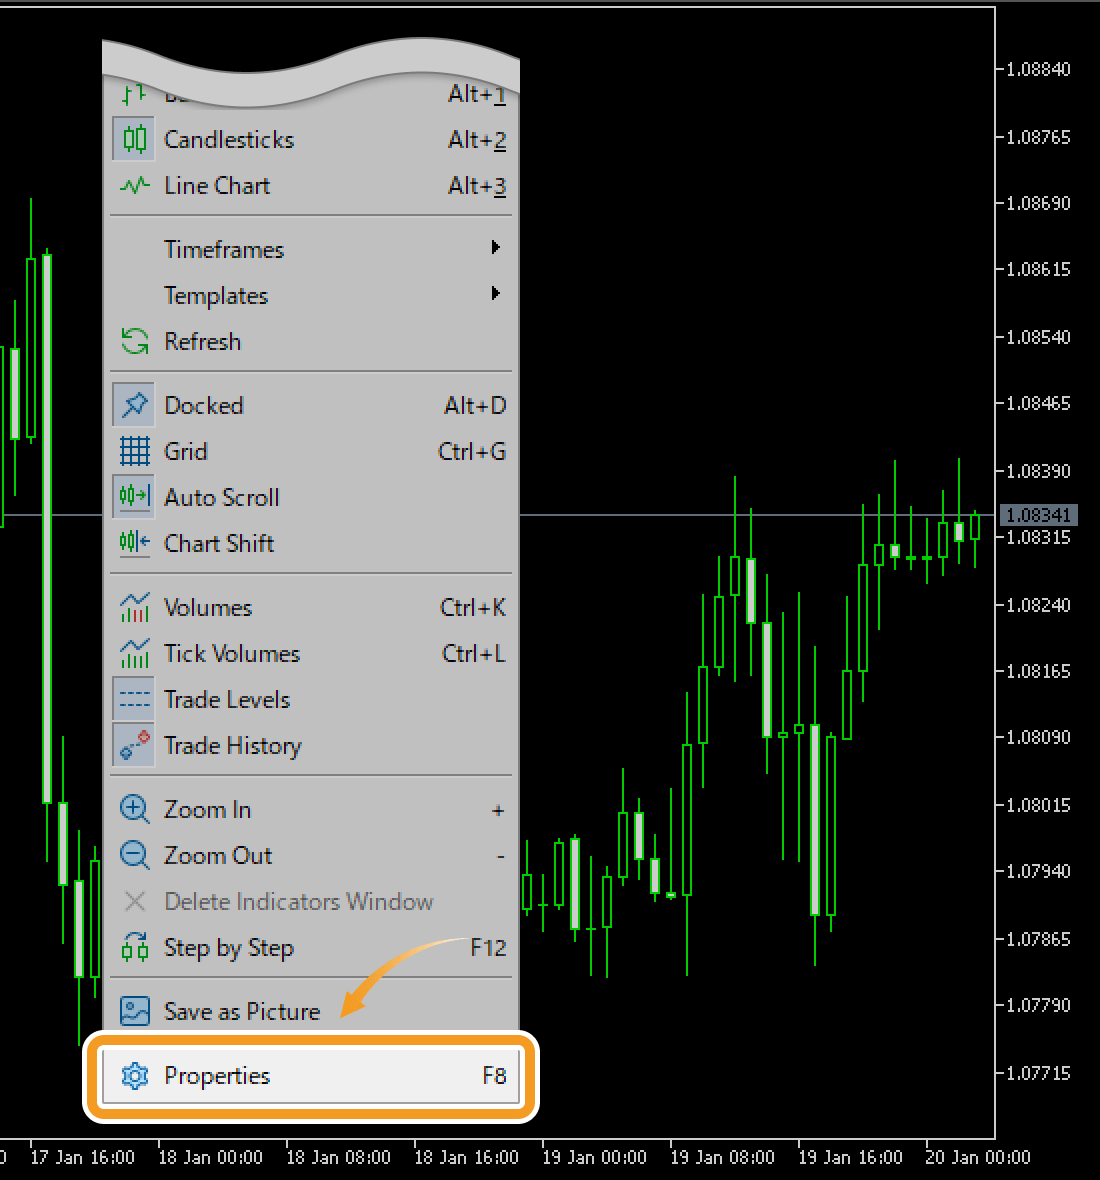
Right-click on a chart and select "Properties" on the context menu.
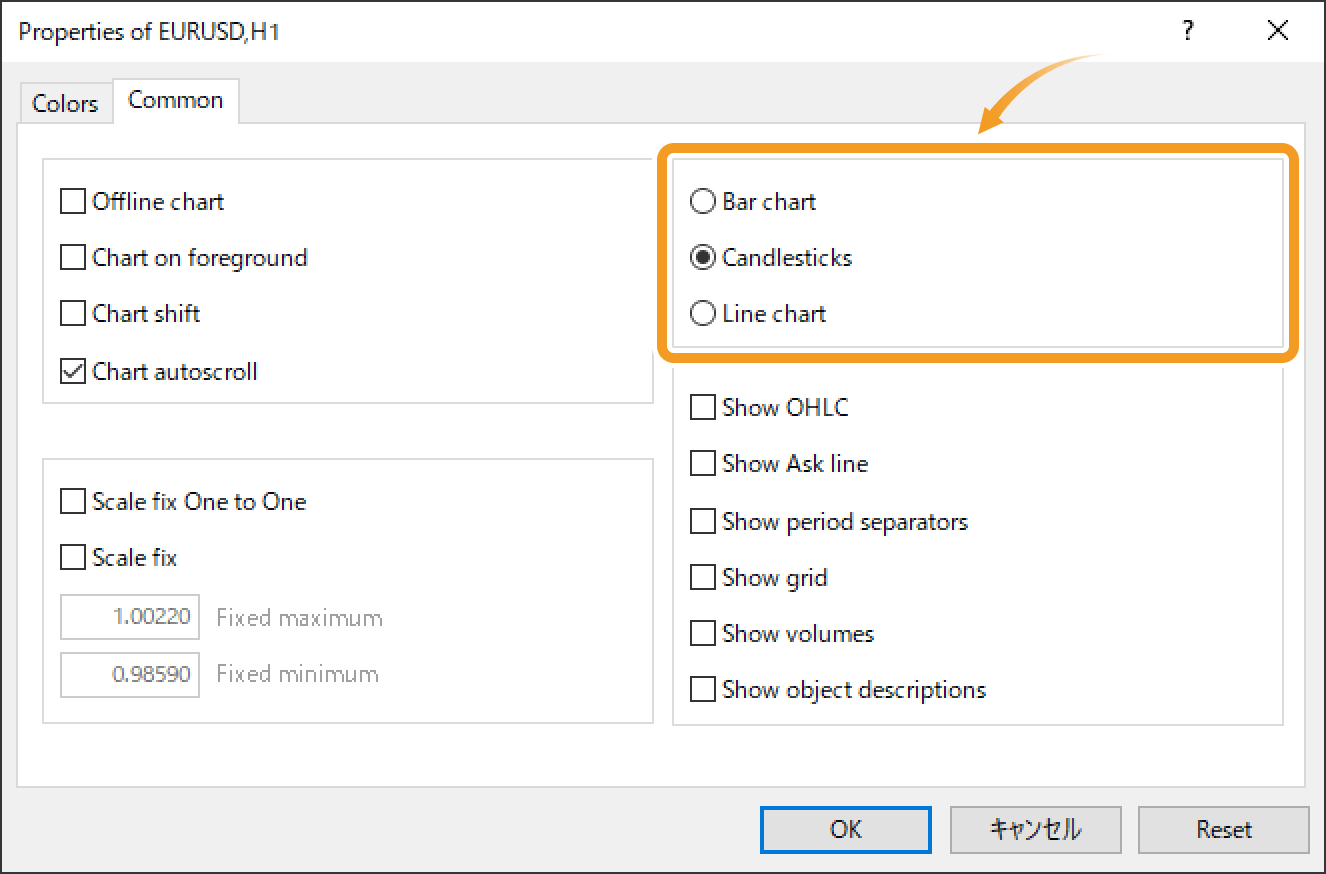
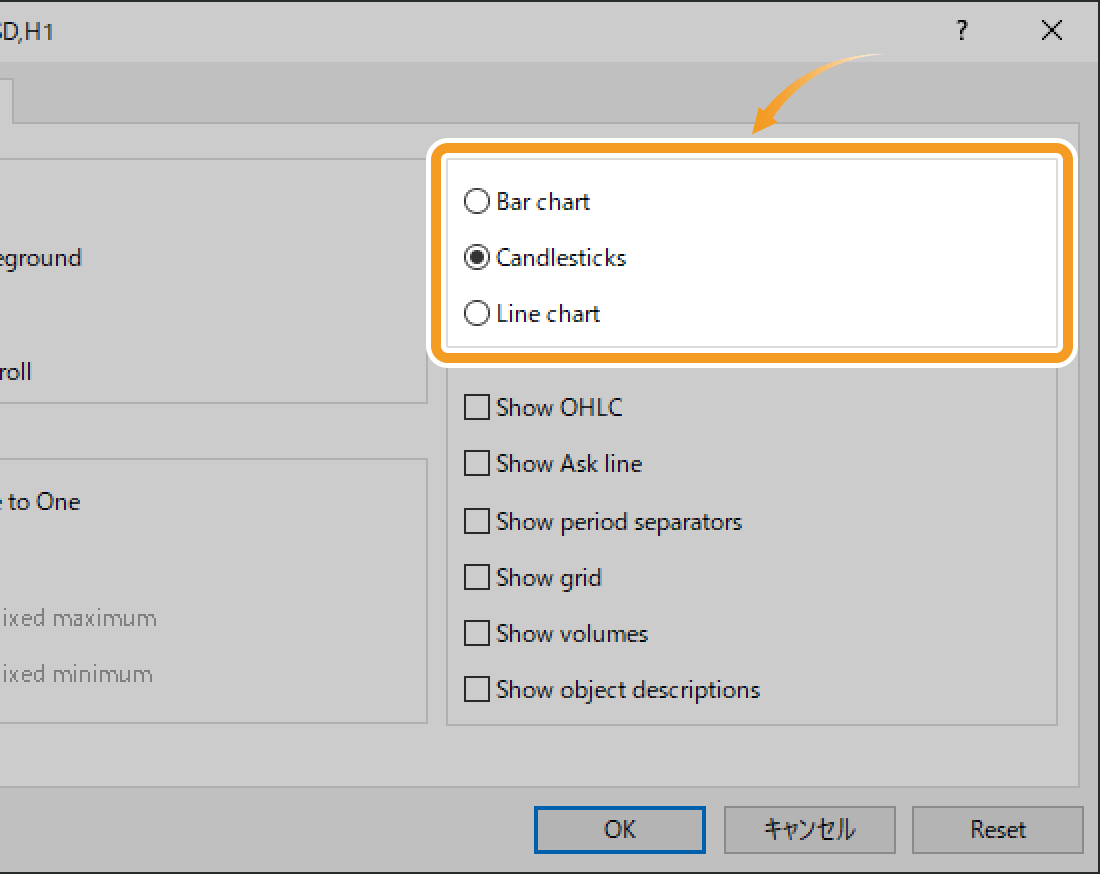
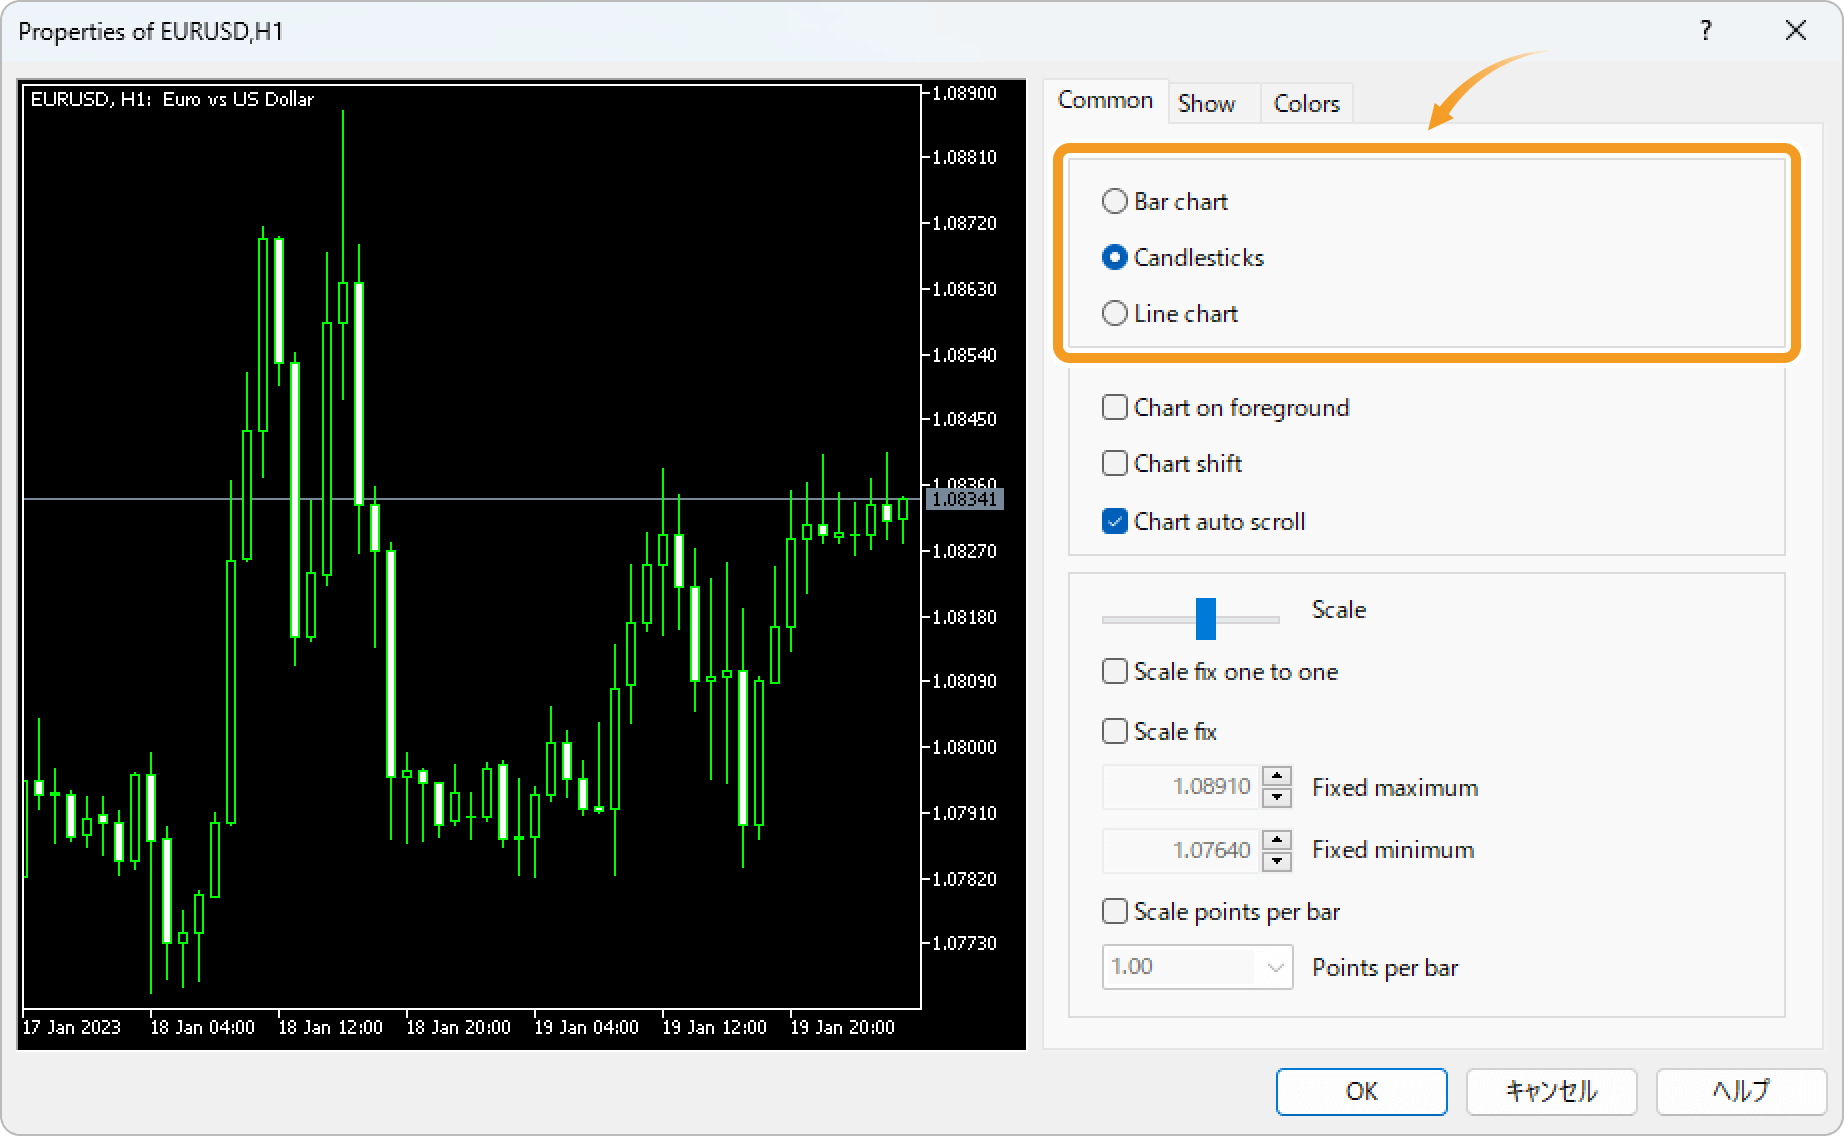
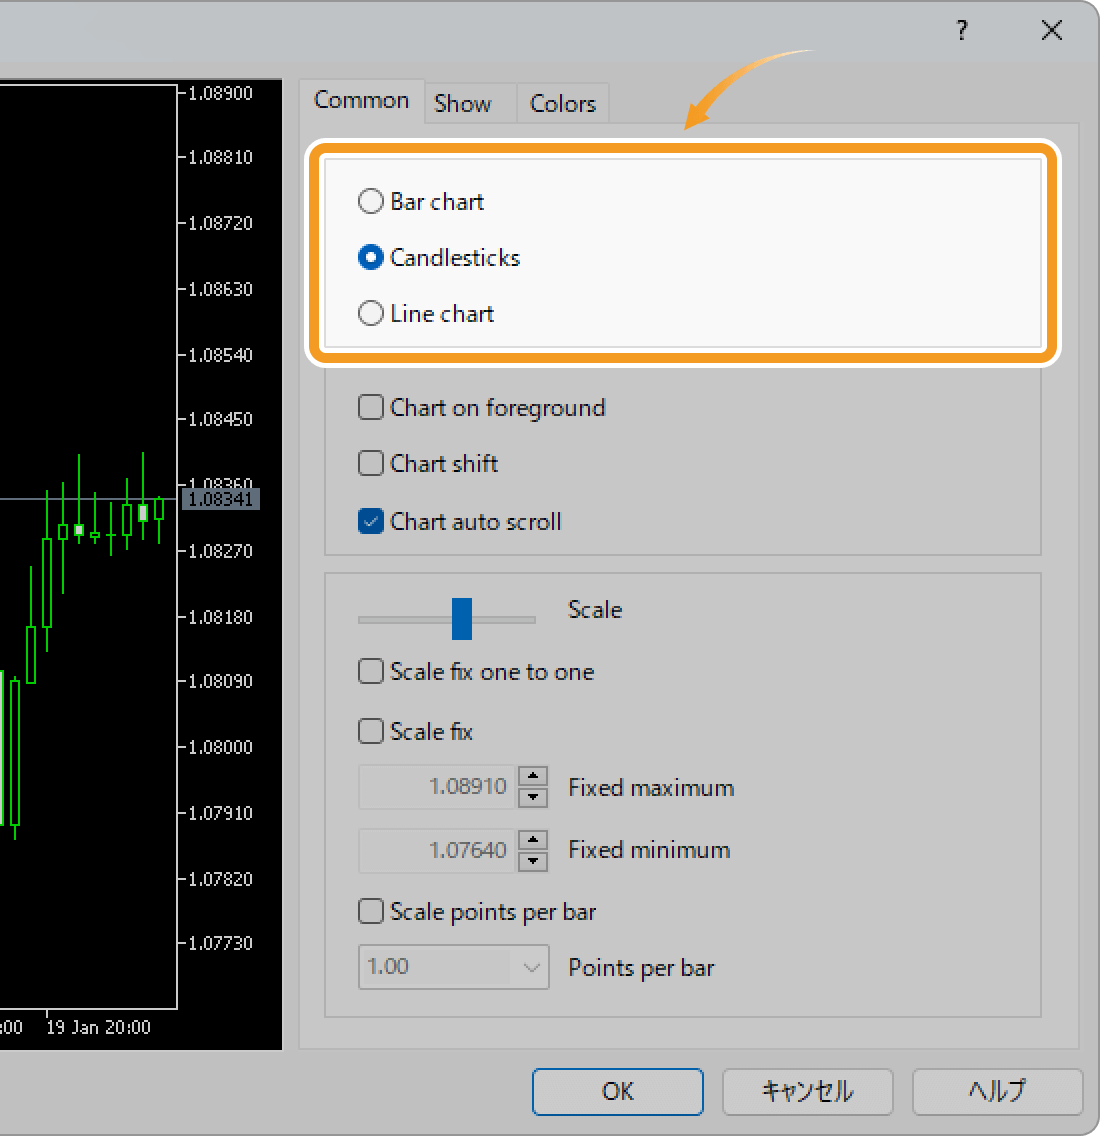
Select a chart type on the "Common" tab of the properties.
The charts will be changed to the selected chart type.
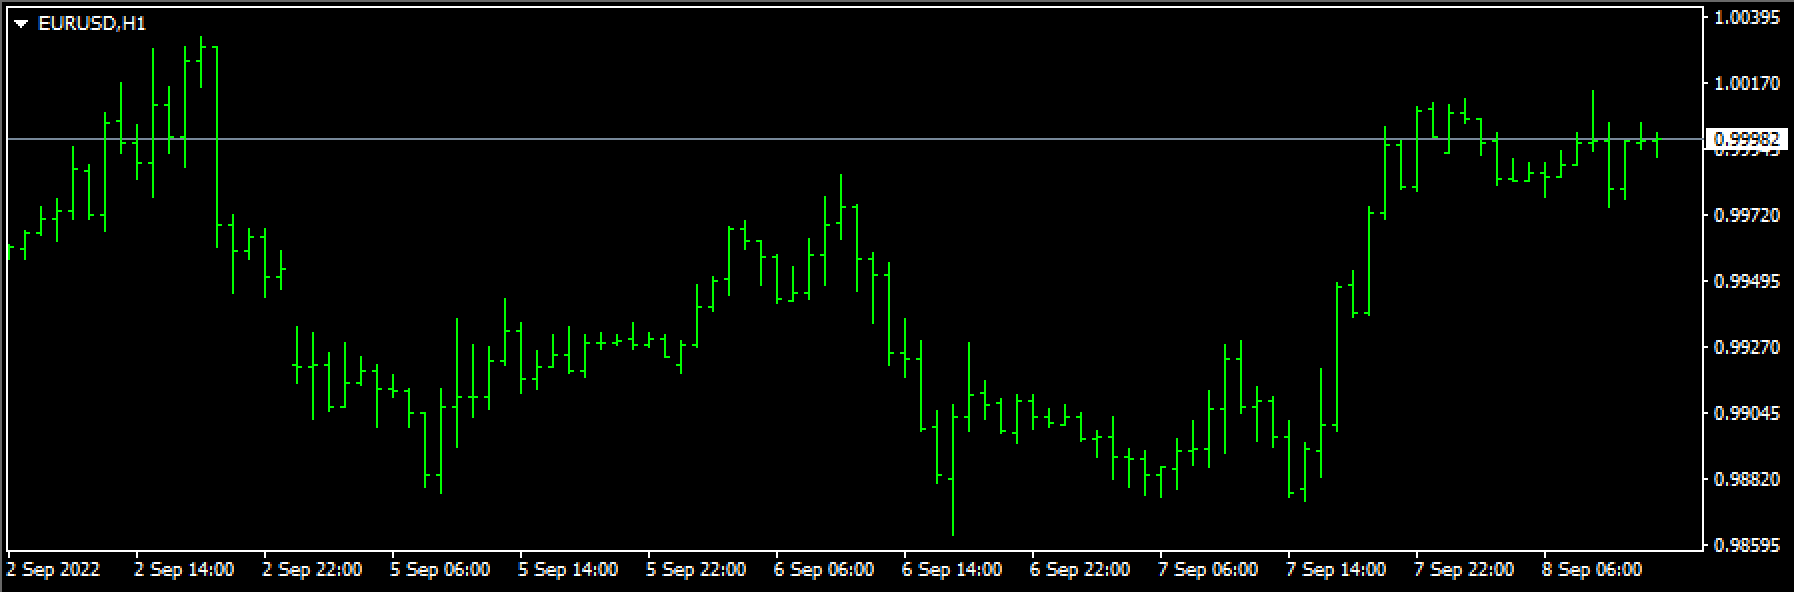
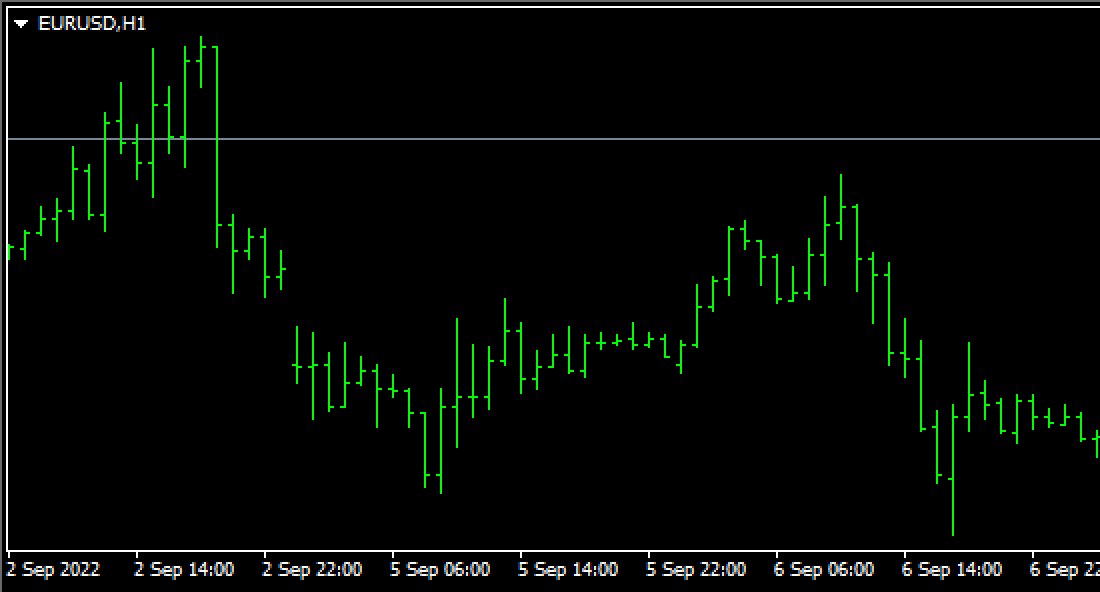
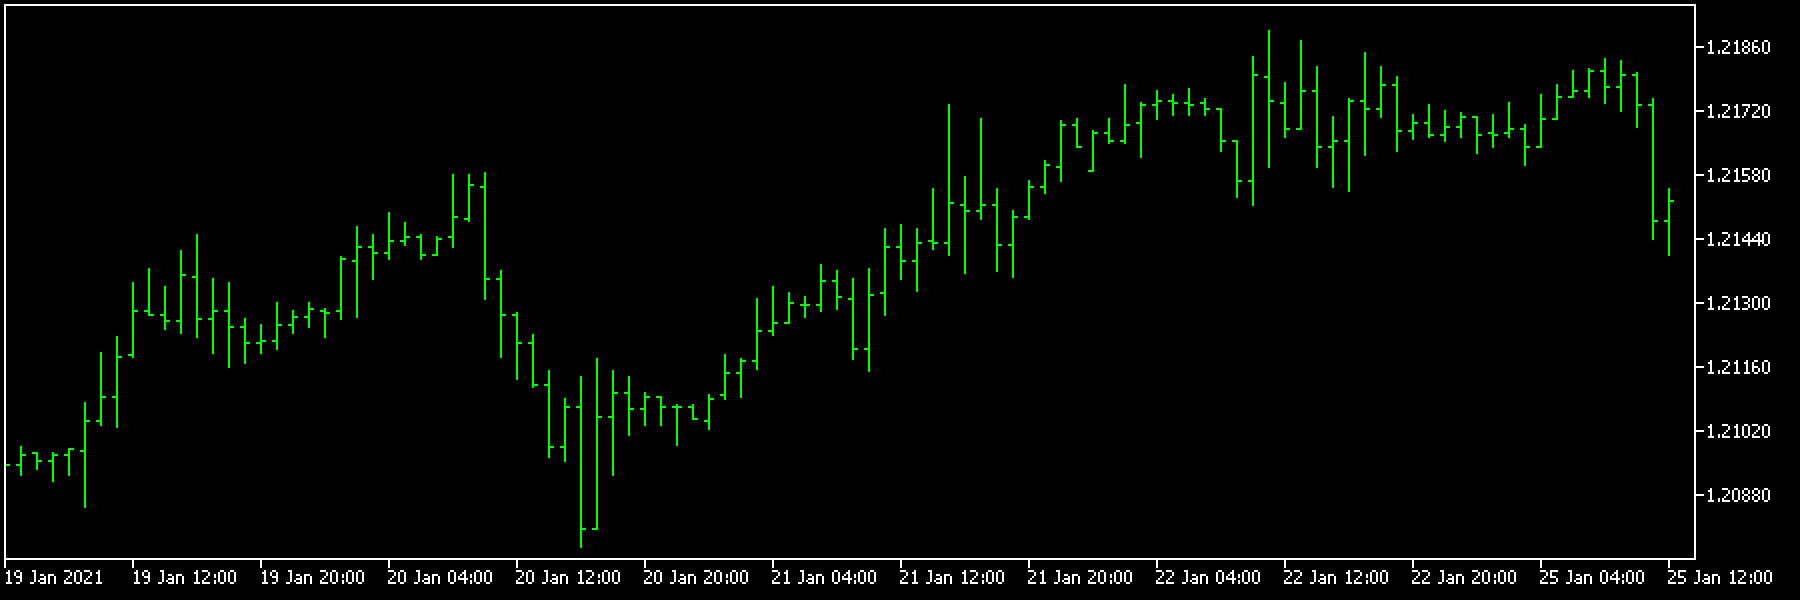
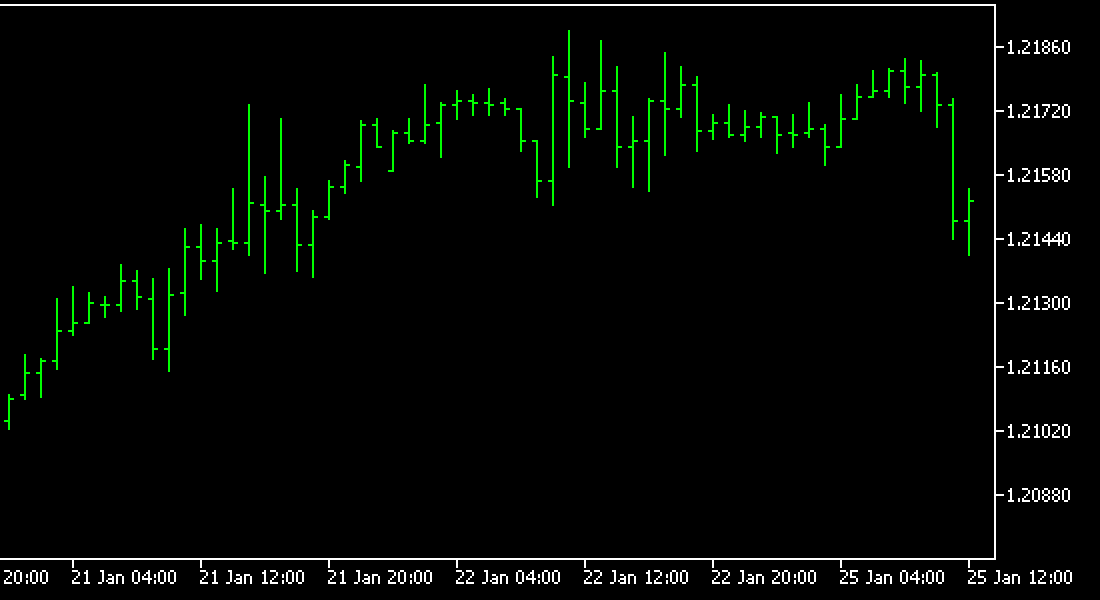
Bar chart displays the open, close, high, and low prices using a bar. There are 2 horizontal lines coming out of the single vertical line. The top and bottom of the vertical line indicate the high and low respectively. And the horizontal line on the left indicates the open, and the one on the right indicates the close price.
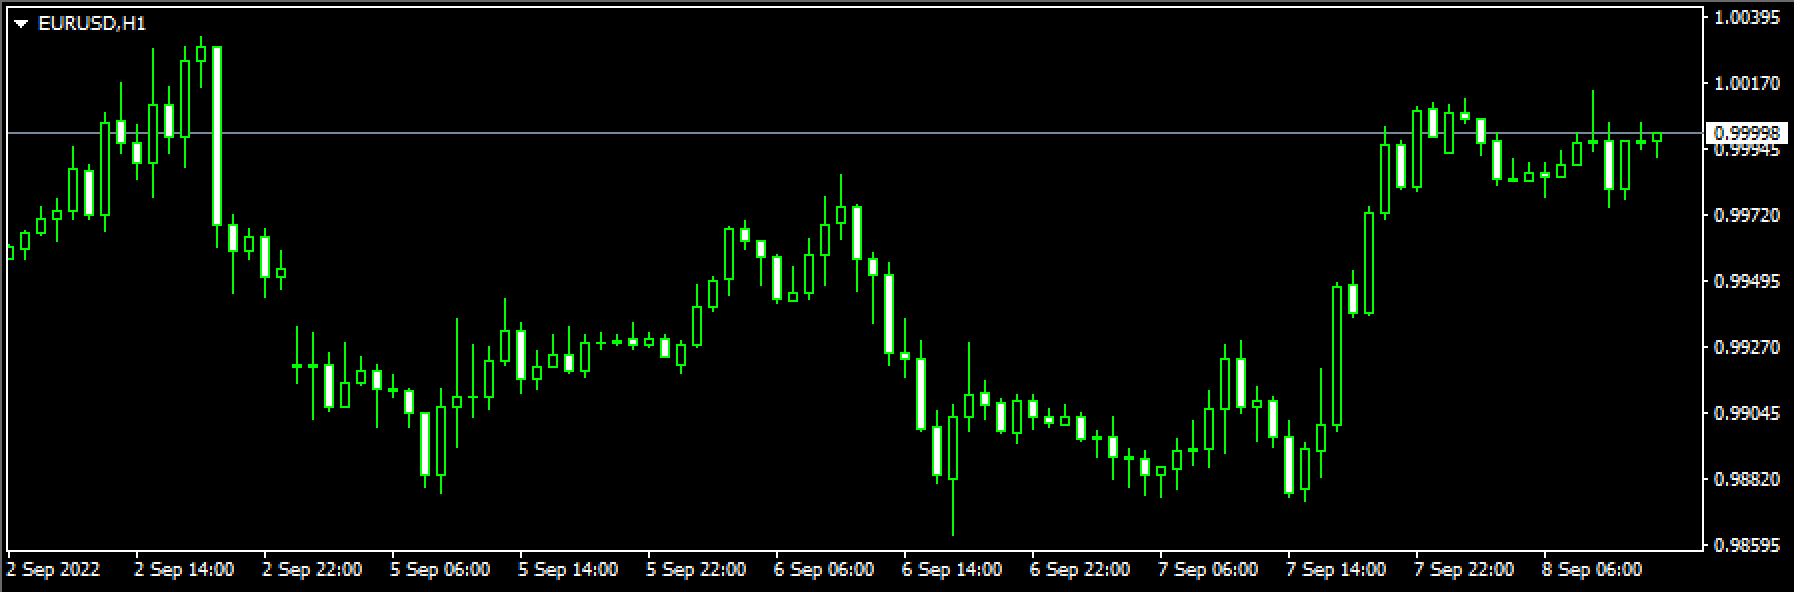
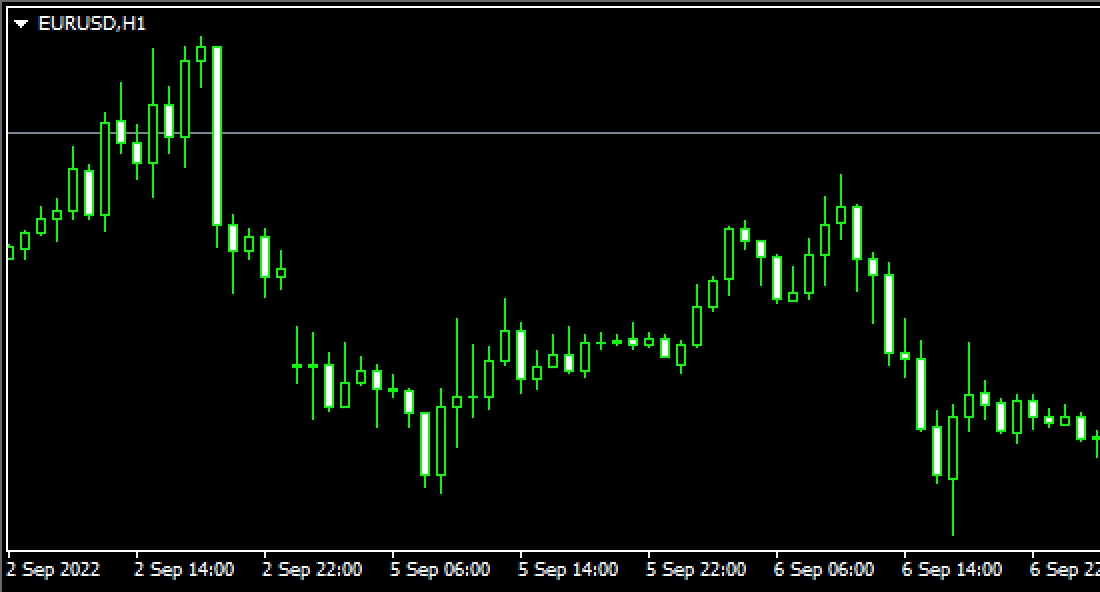
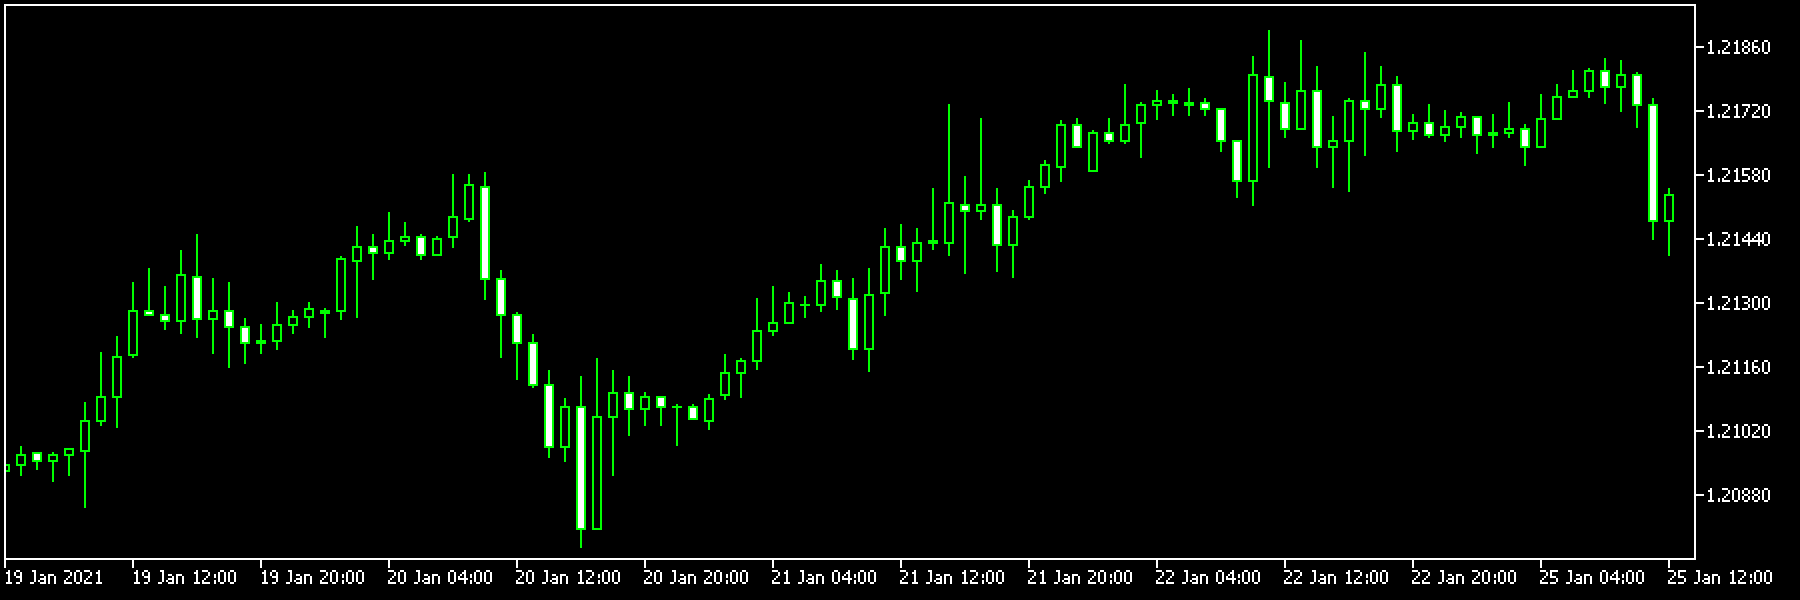
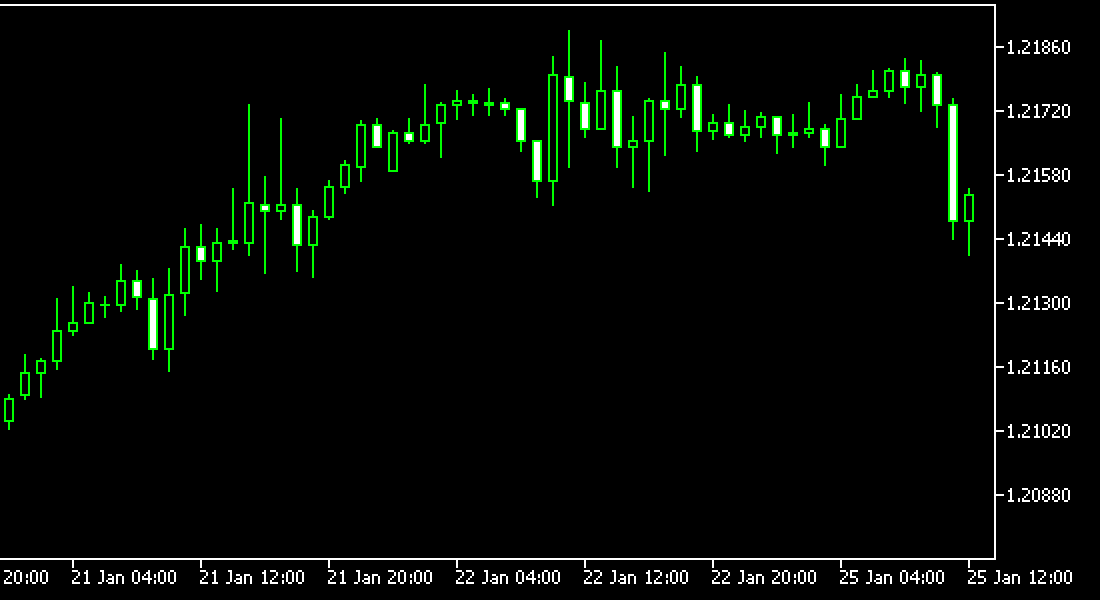
Candlesticks show the open, close, high, and low prices in the form of a candlestick.
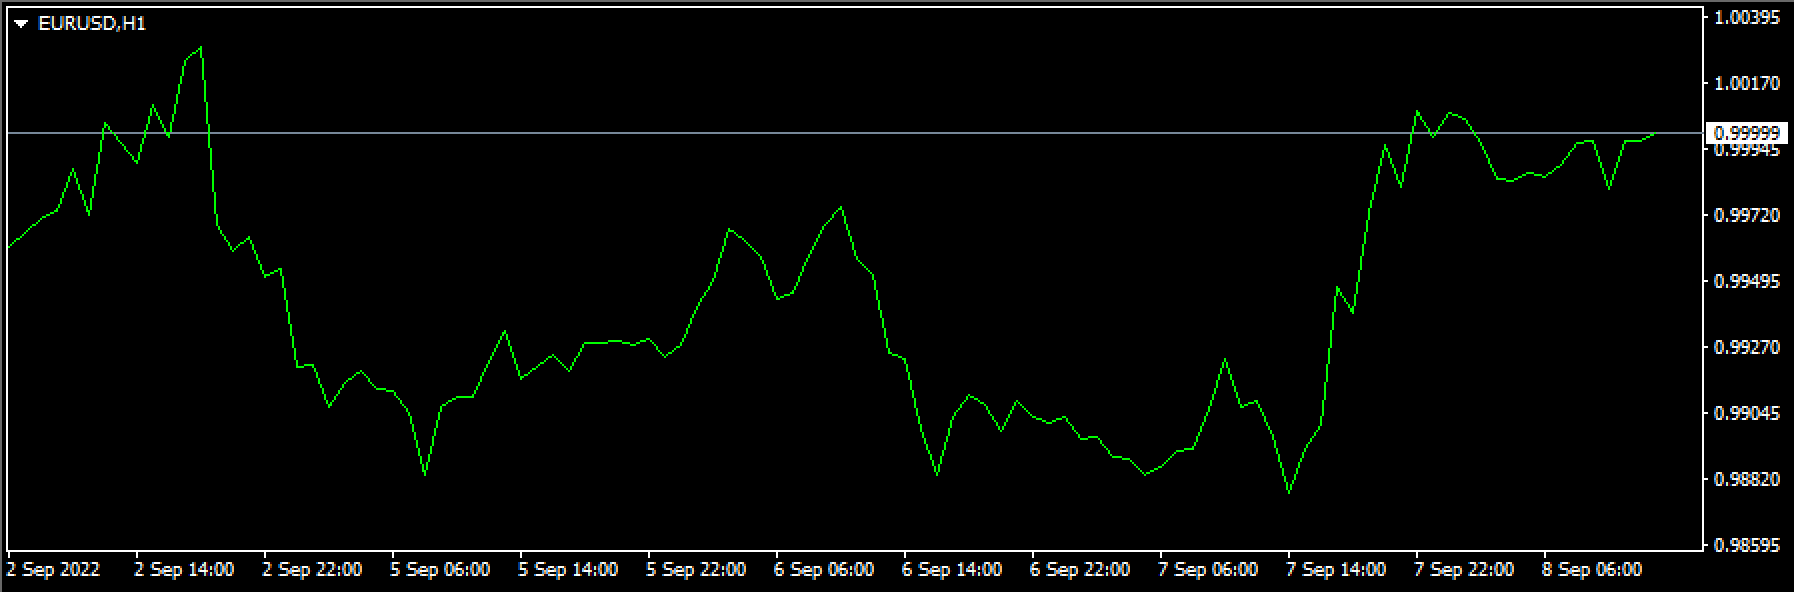
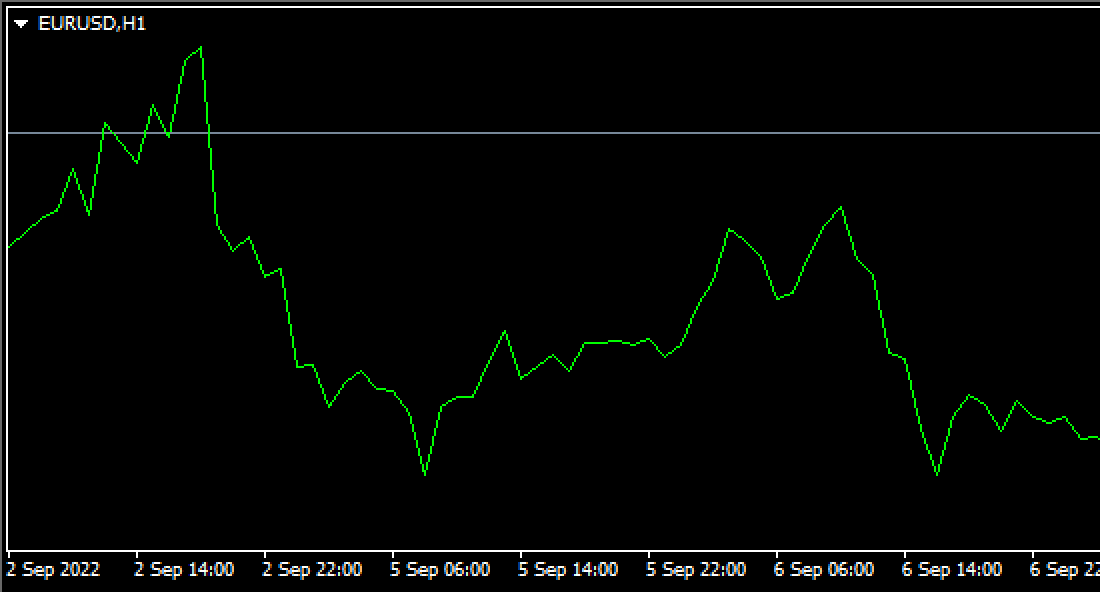
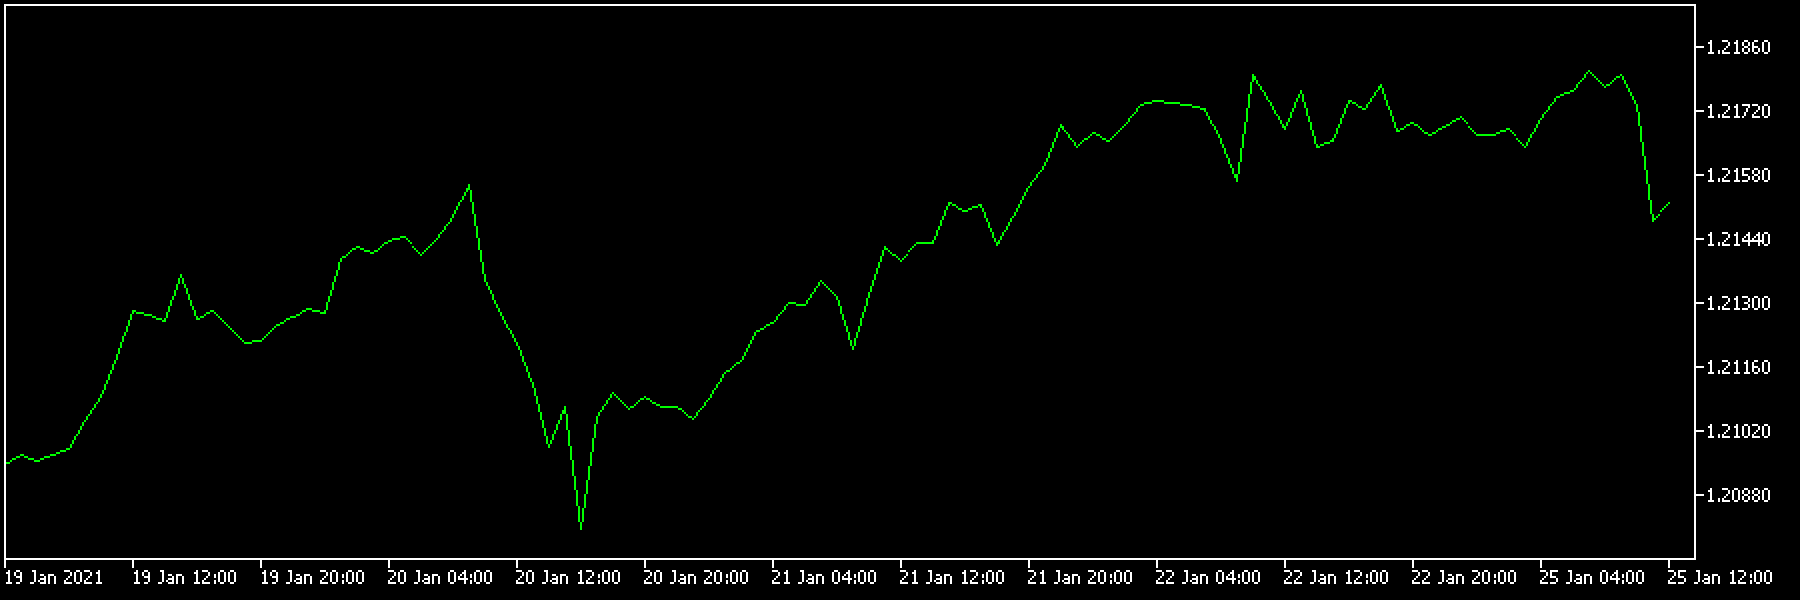
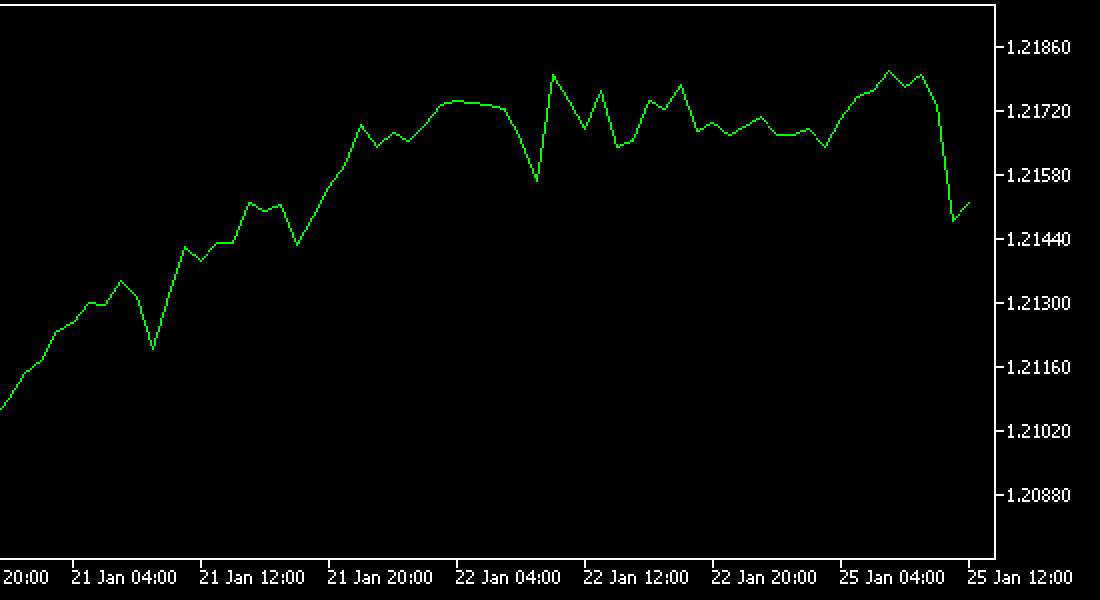
Line chart only plots close price. Open, high, and low prices are not shown.
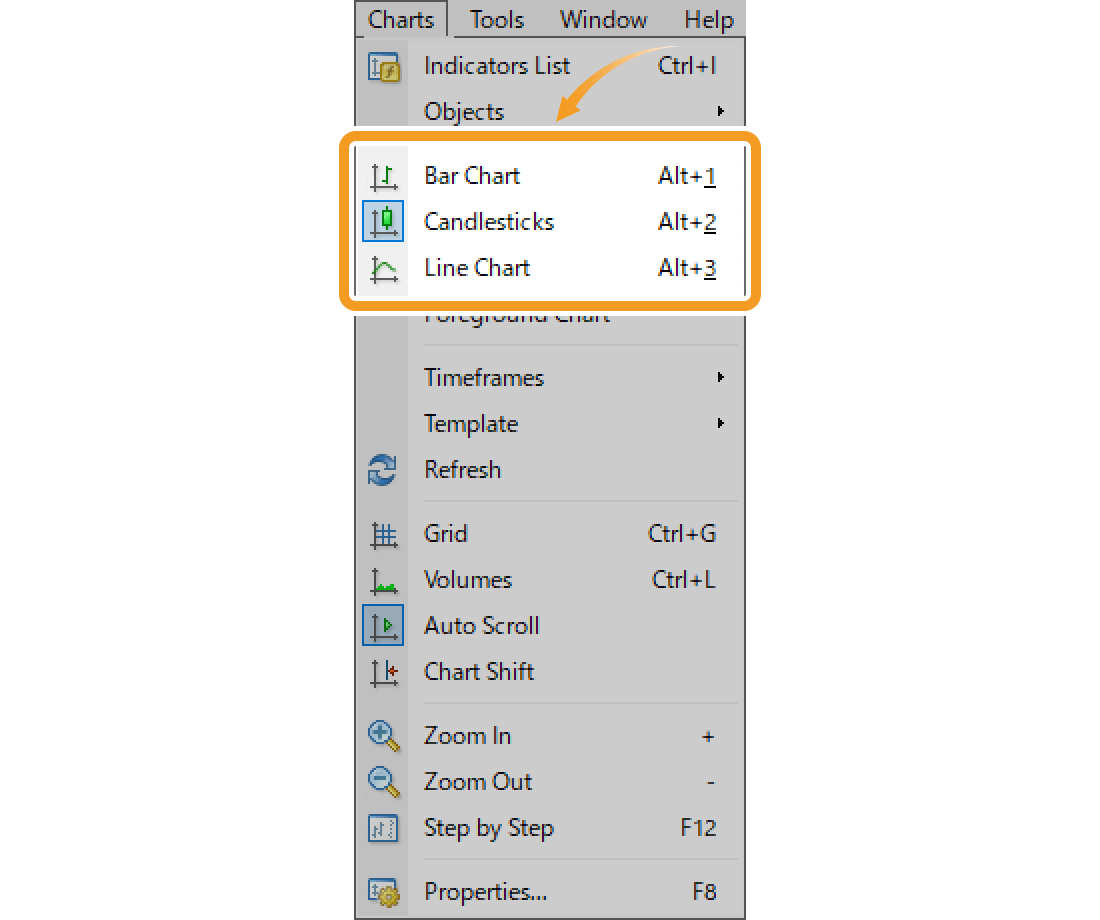
Click "Charts" in the menu and select a chart type.
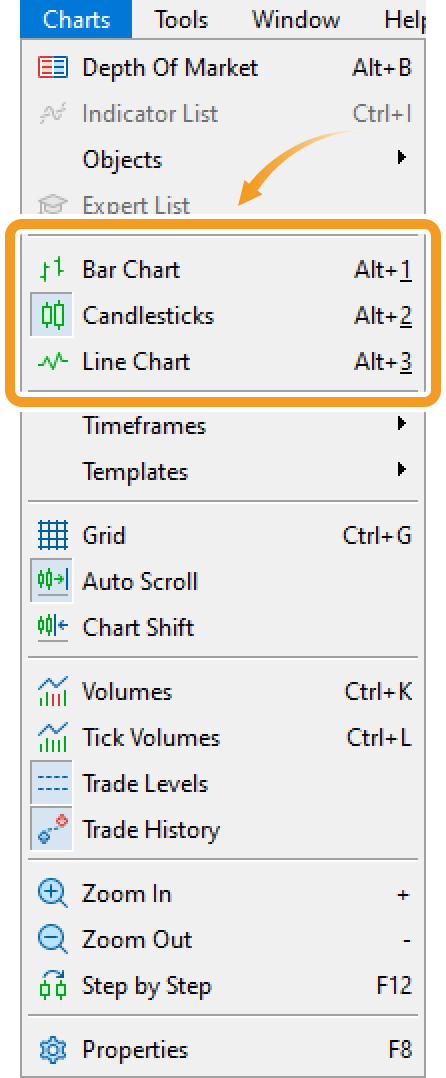
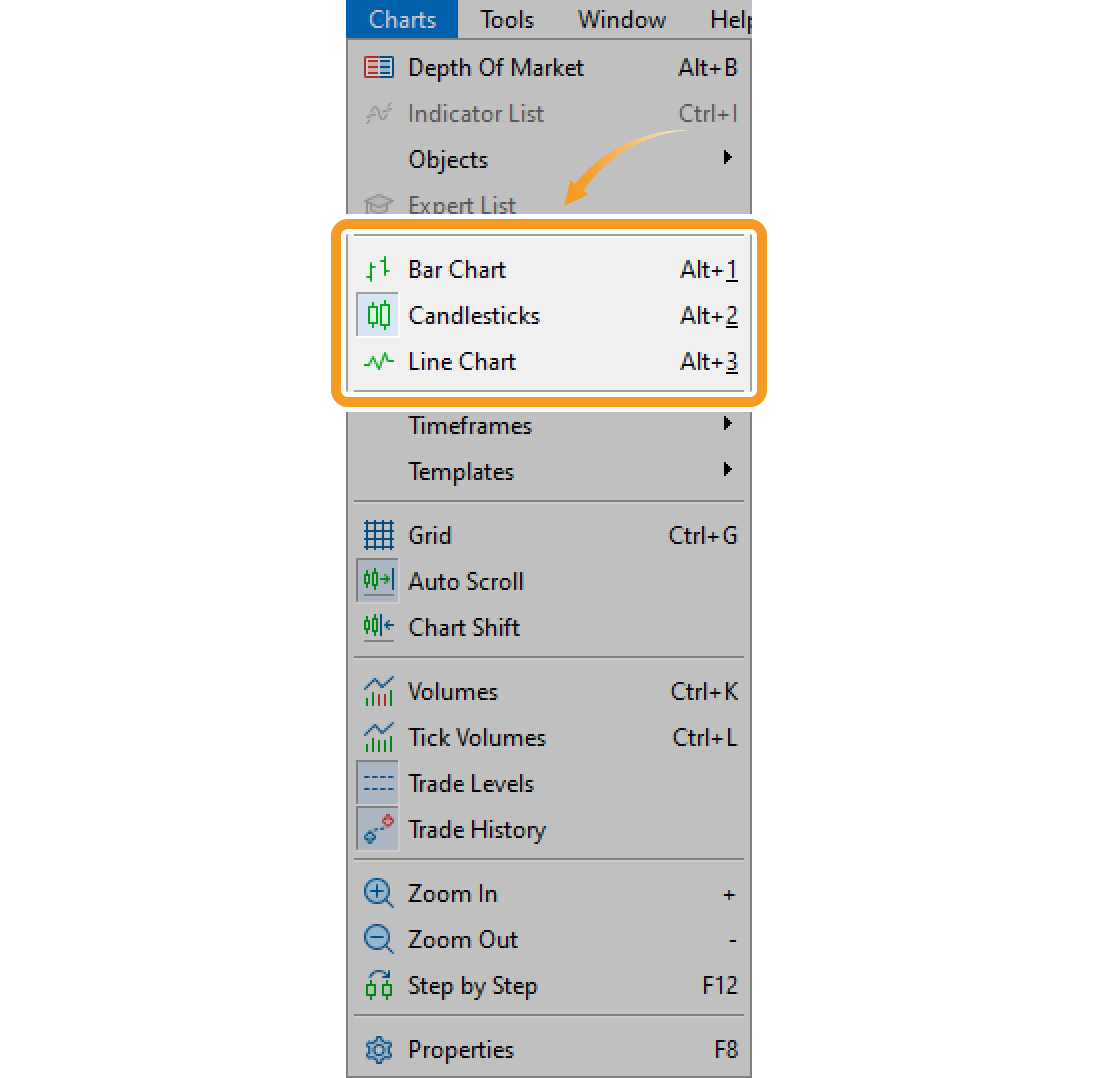
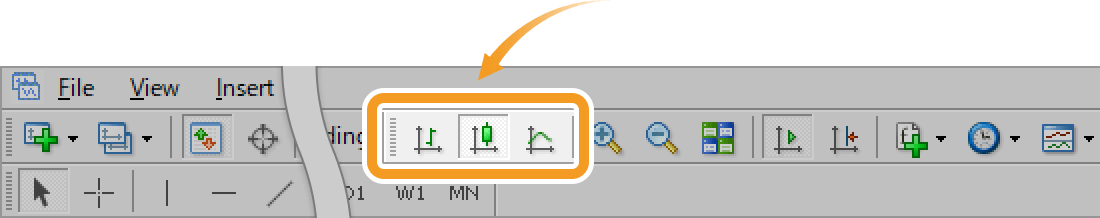
Select from "Bar chart", "Candlesticks", or "Line chart" in the toolbar.
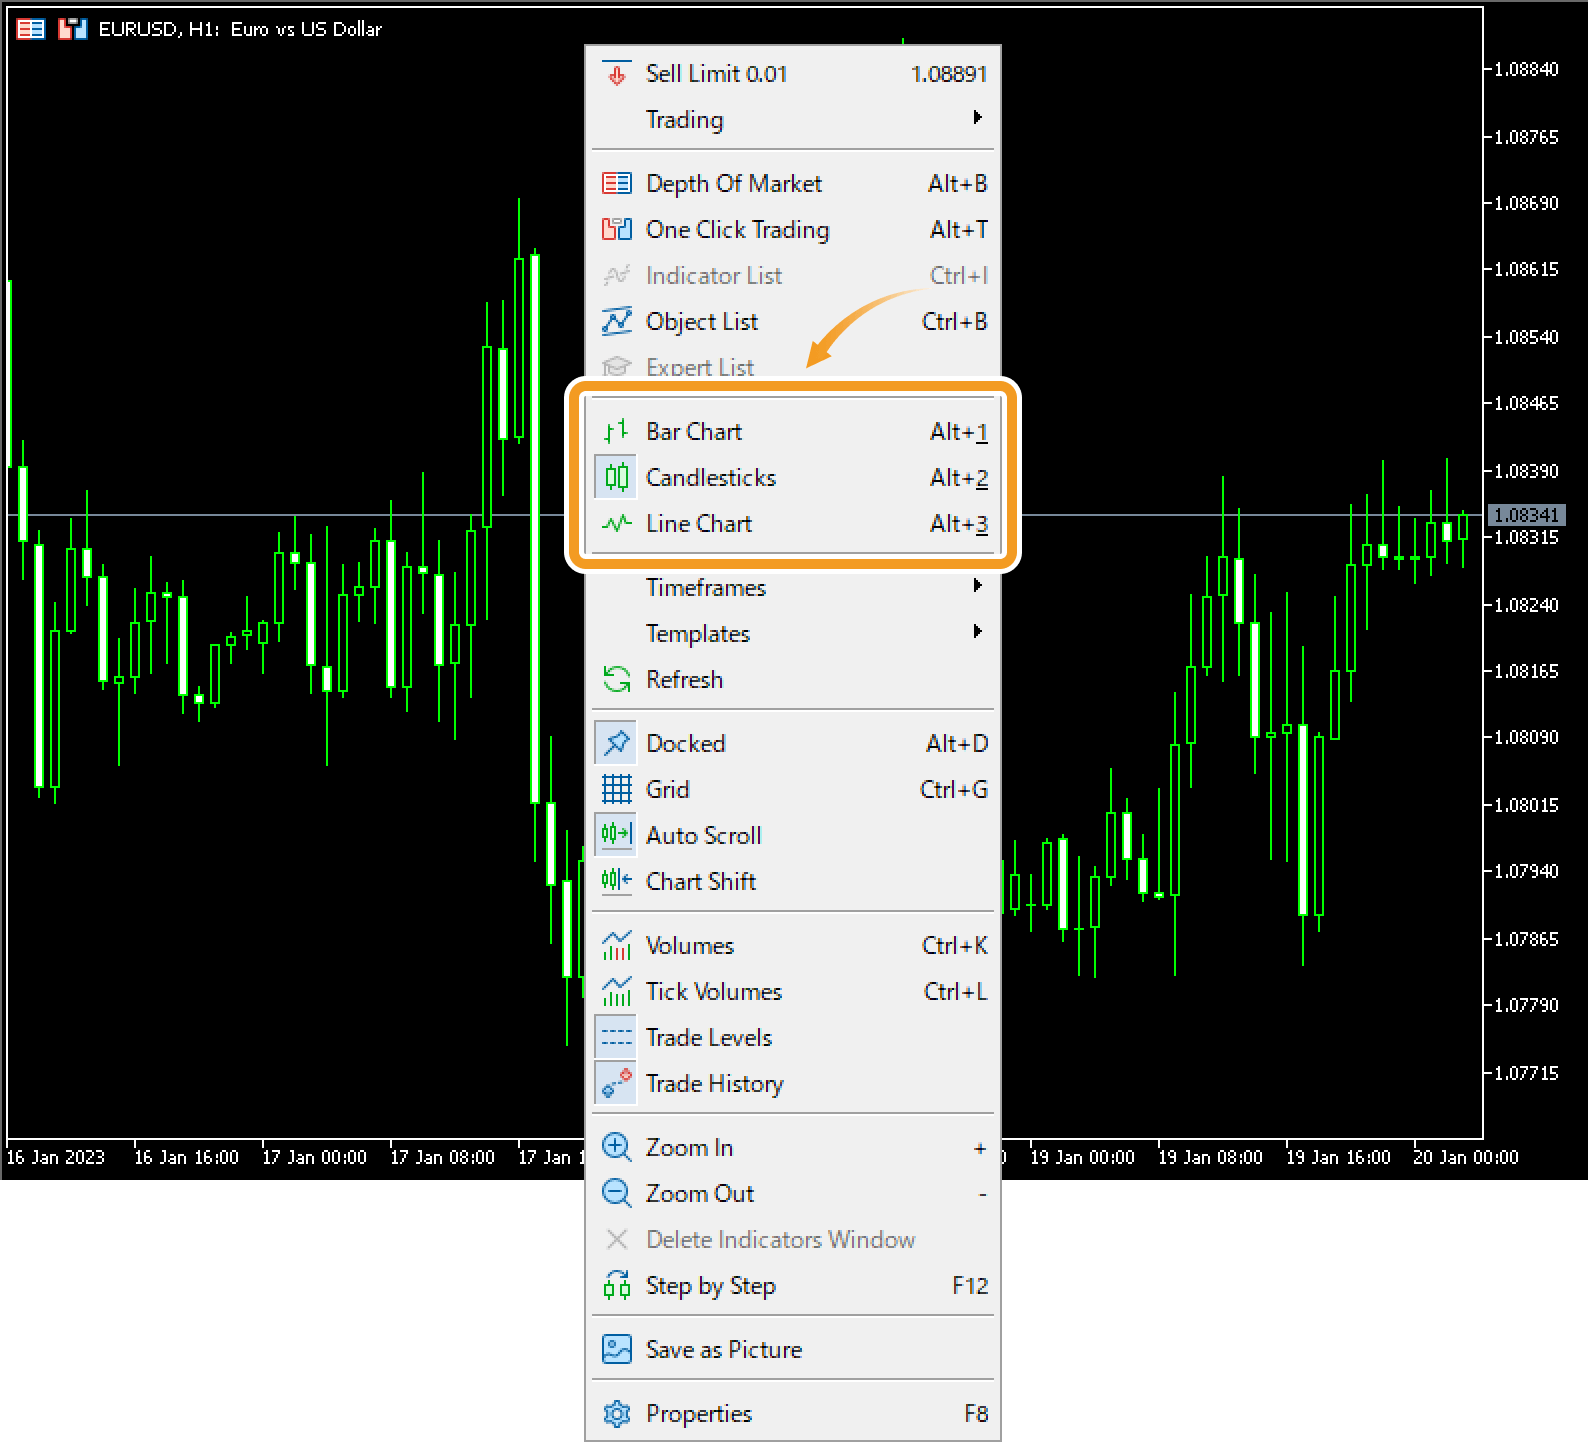
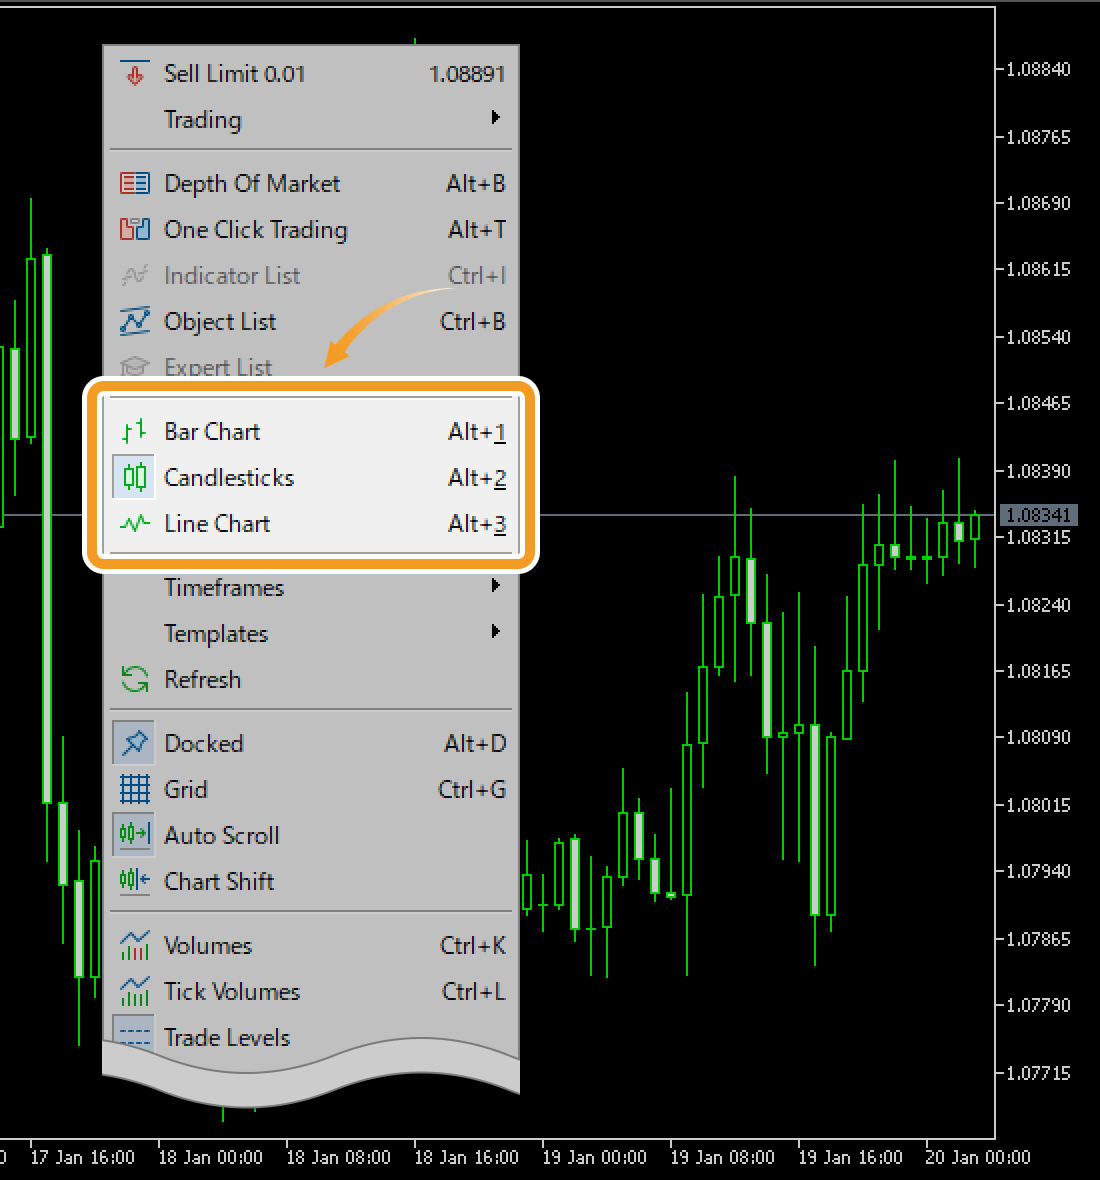
Right-click on a chart and select a chart type.
Right-click on a chart and select "Properties" on the context menu.
Select a chart type on the "Common" tab of the properties.
The charts will be changed to the selected chart type.
Bar chart displays the open, close, high, and low prices using a bar. There are 2 horizontal lines coming out of the single vertical line. The top and bottom of the vertical line indicates the high and low respectively. And the horizontal line on the left indicates the open, and the one on the right indicates the close price.
Candlesticks show the open, close, high, and low prices in the form of a candlestick.
Line chart only plots close price. Open, high, and low prices are not shown.
Was this article helpful?
0 out of 0 people found this article helpful.
Thank you for your feedback.