


MT4/MT5: Import historical data
Others (PC)
Others (PC)

This article was :
published
updated
On MetaTrader 4 (MT4), historical price data can be imported in 9 timeframes, whereas MetaTrader 5 (MT5) provides access to both historical price and tick data across 21 timeframes. Use other brokers' historical data by importing data.
Importing tick data, the smallest unit that represents price changes, is a feature exclusive to MT5 and is not available in MT4. With this feature, you can significantly improve the accuracy of backtesting.
Here we will look at how to import historical data on MT4/MT5.
Switch between MT4/MT5 tabs to check the steps for each.
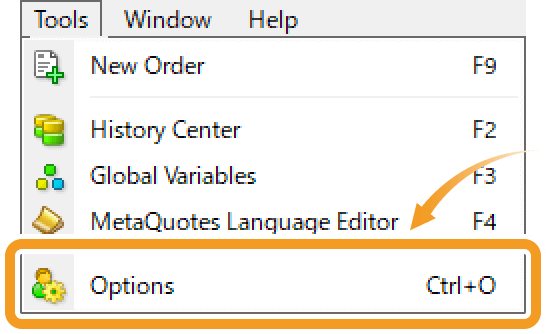
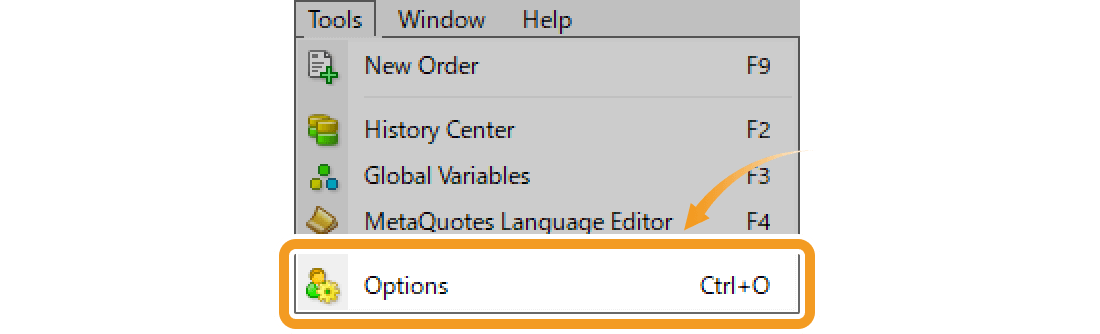
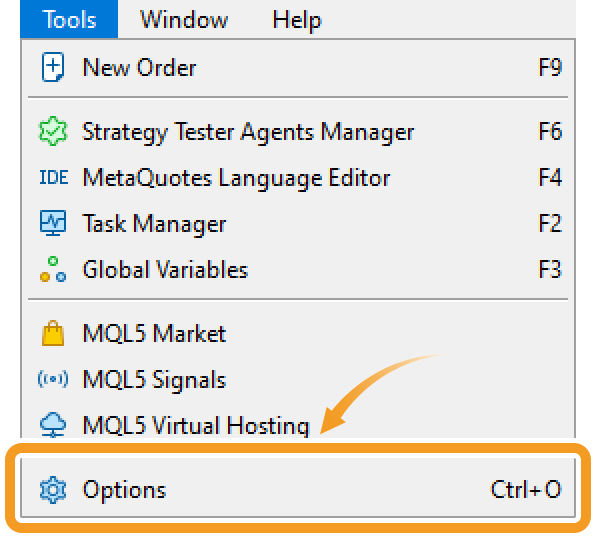
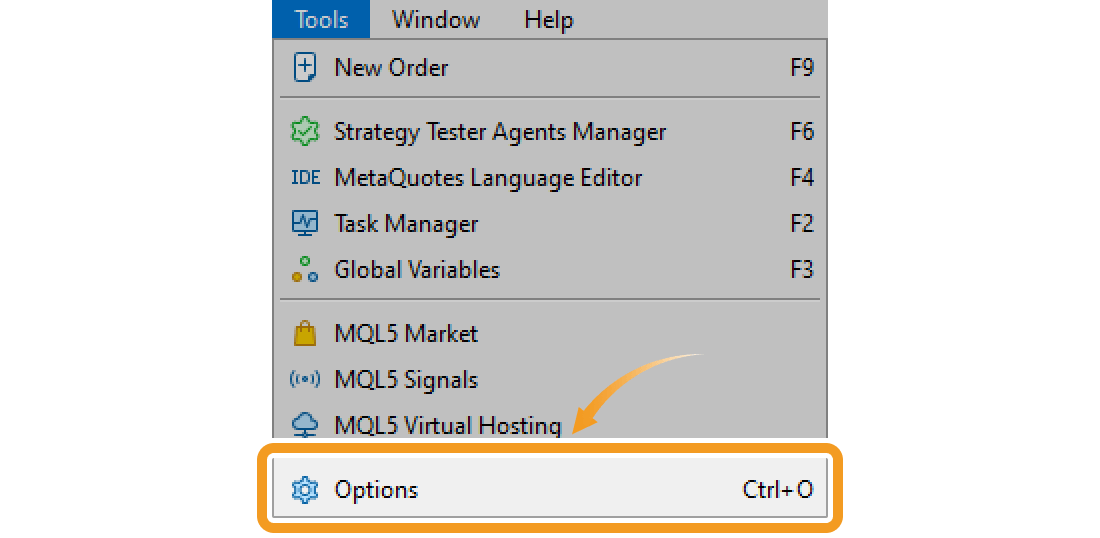
First, increase the number of bars on charts. Click "Tools" on the menu and select "Options". (Shortcut keys: "Ctrl"+"O")
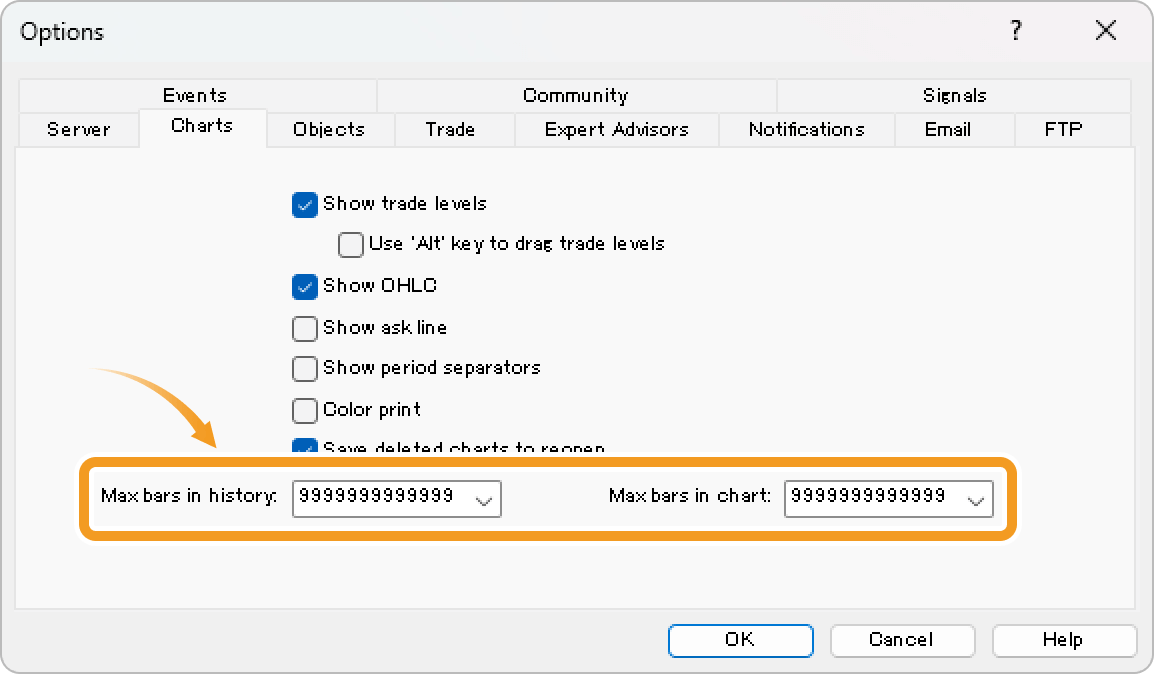
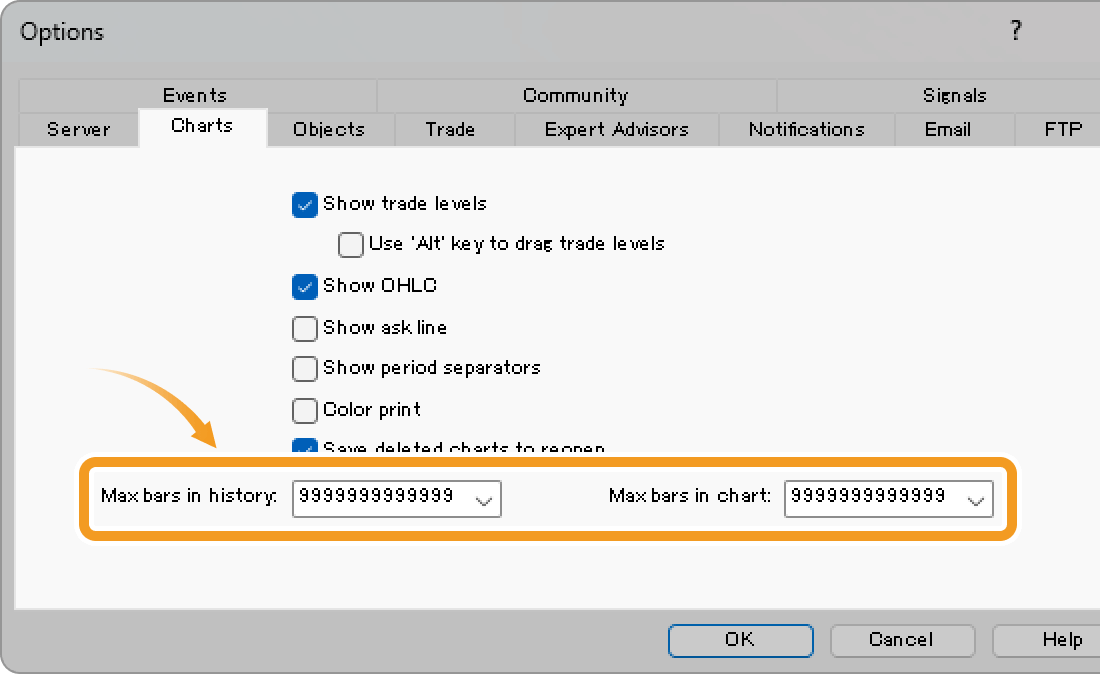
In the "Charts" tab, type "9"s till it reaches the ends of the "Max bars in history" and "Max bars in chart" fields. To be precise, the maximum number of bars is "2,147,483,647" for both, which will be automatically applied if a larger number is entered.
After that, click "OK" and restart MT4.
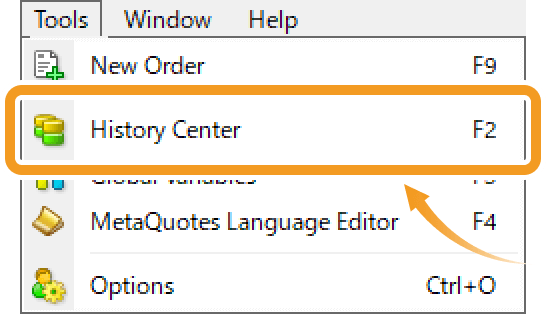
Next, import the historical data. Click "Tools" on the menu and select "History Center". (Shortcut key: "F2")

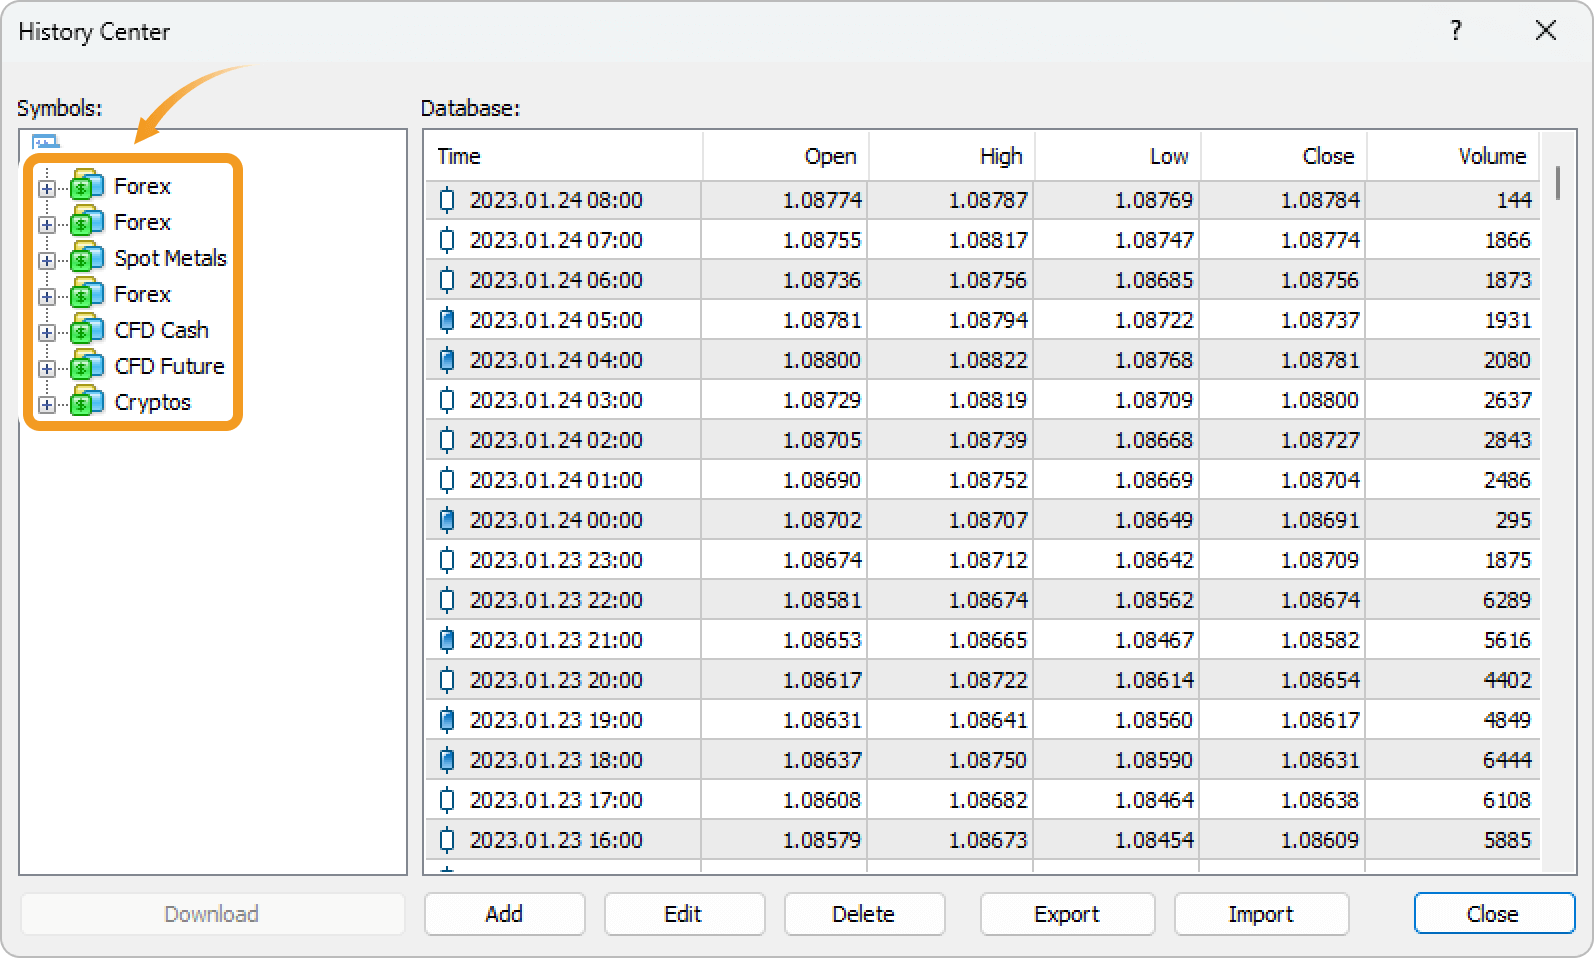
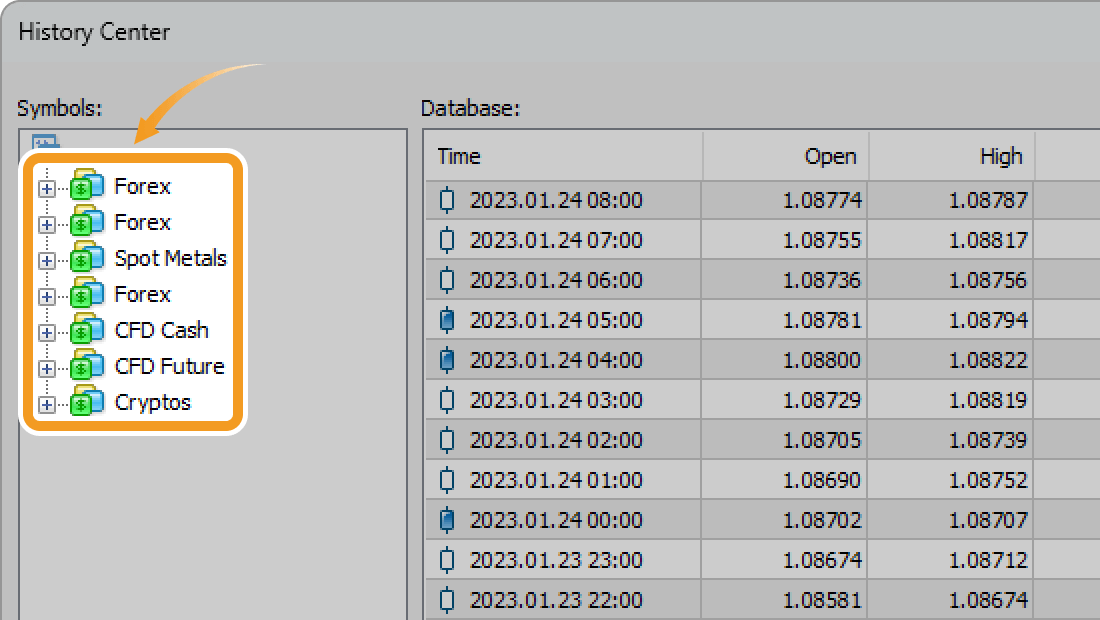
Double-click on the symbol name of the historical data you wish to import to open the timeframe menu, and then choose your preferred timeframe.
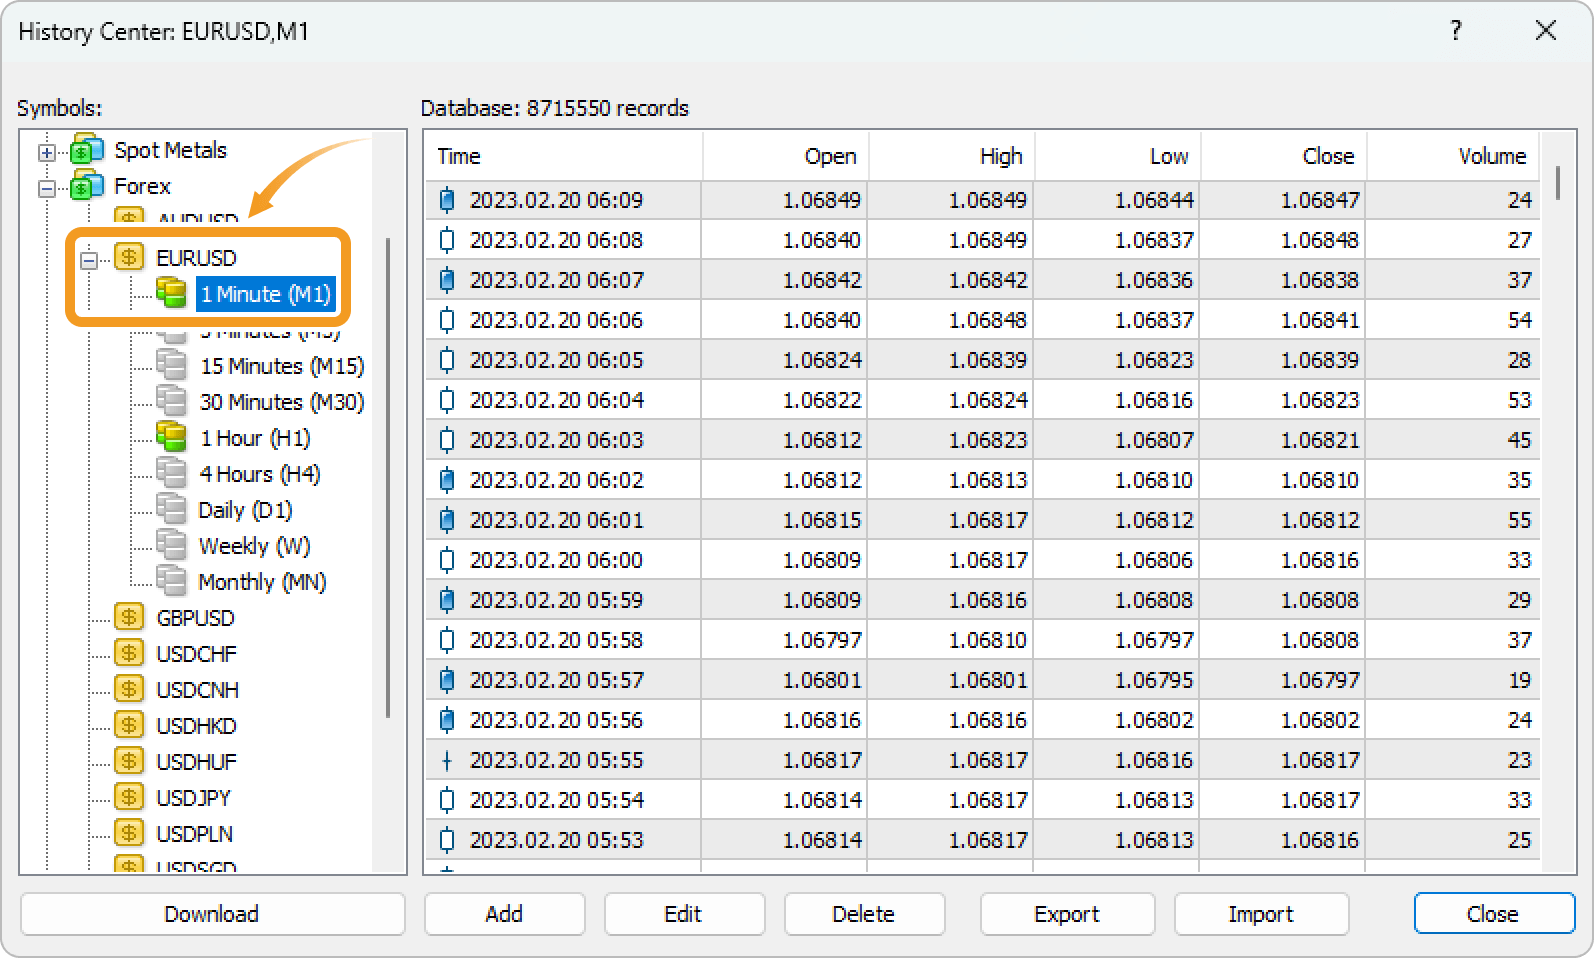
If you open the History Center, you will find some categories such as "Forex" and "Crypto", and symbol names such as "EURUSD" and "USDJPY" under each category. This categorization differs from broker to broker. For currency pairs, "Forex" and smaller categories such as "Major" and "Minor" are often used.
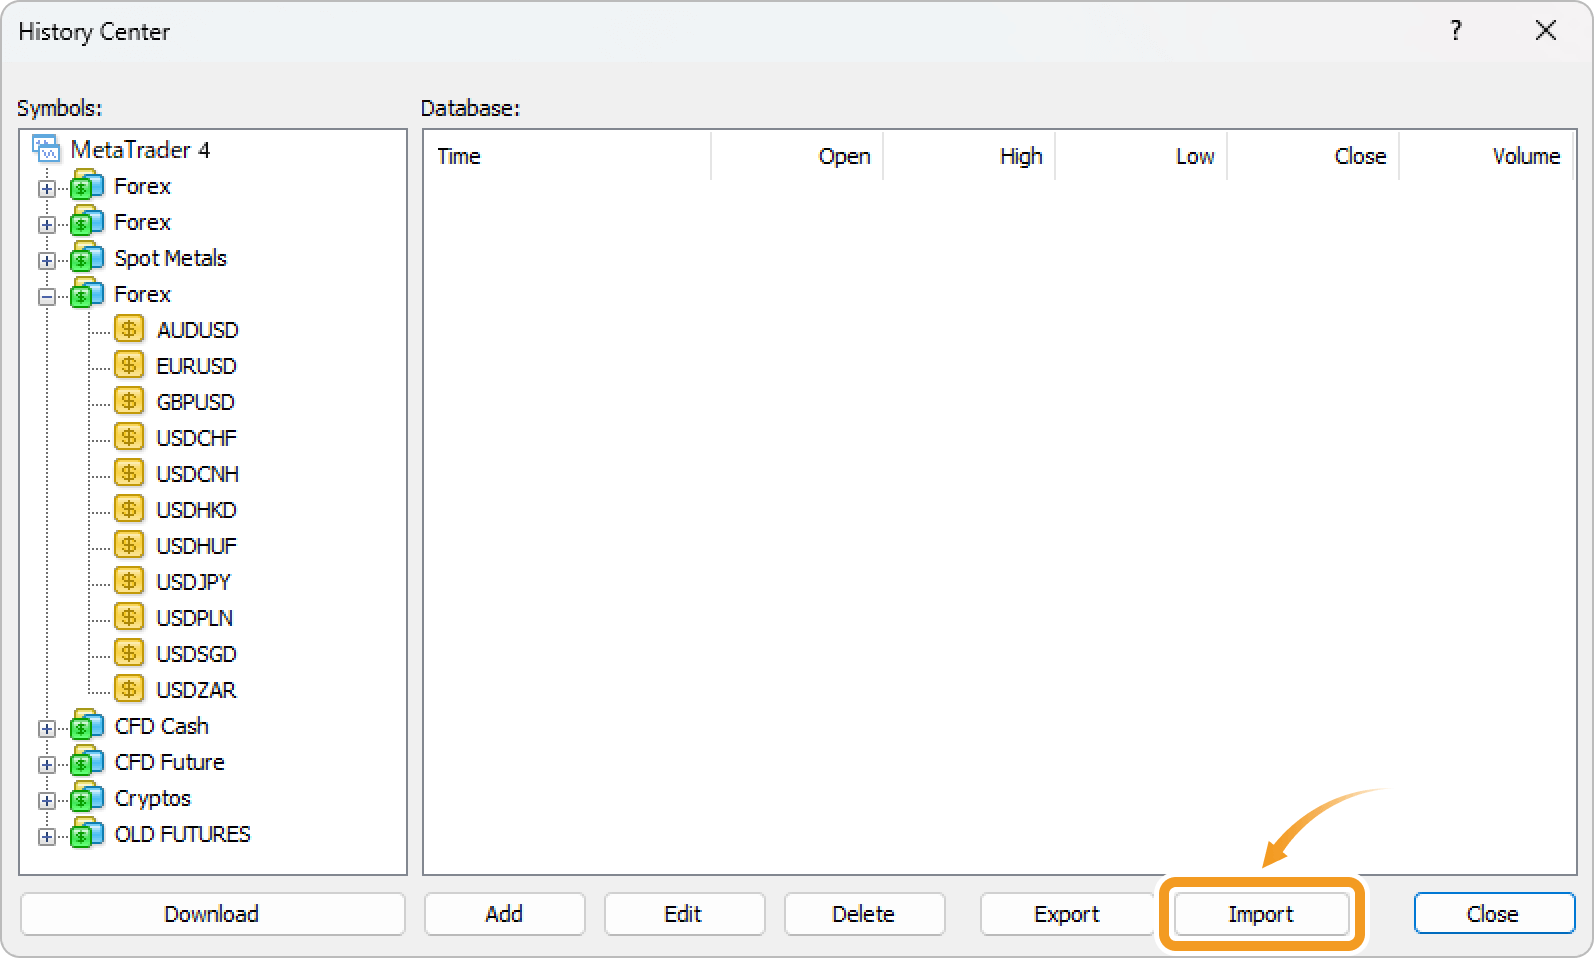
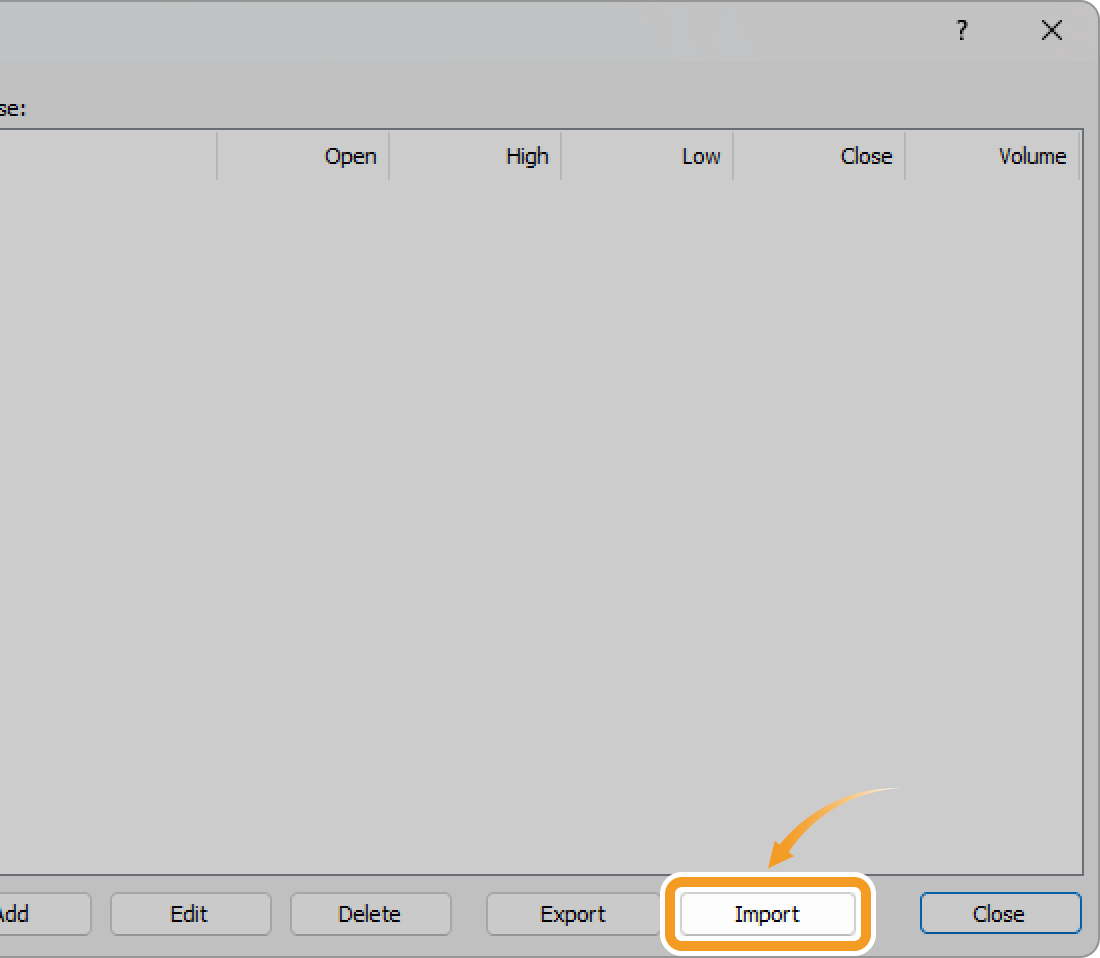
In the "History Center" window, click "Import".
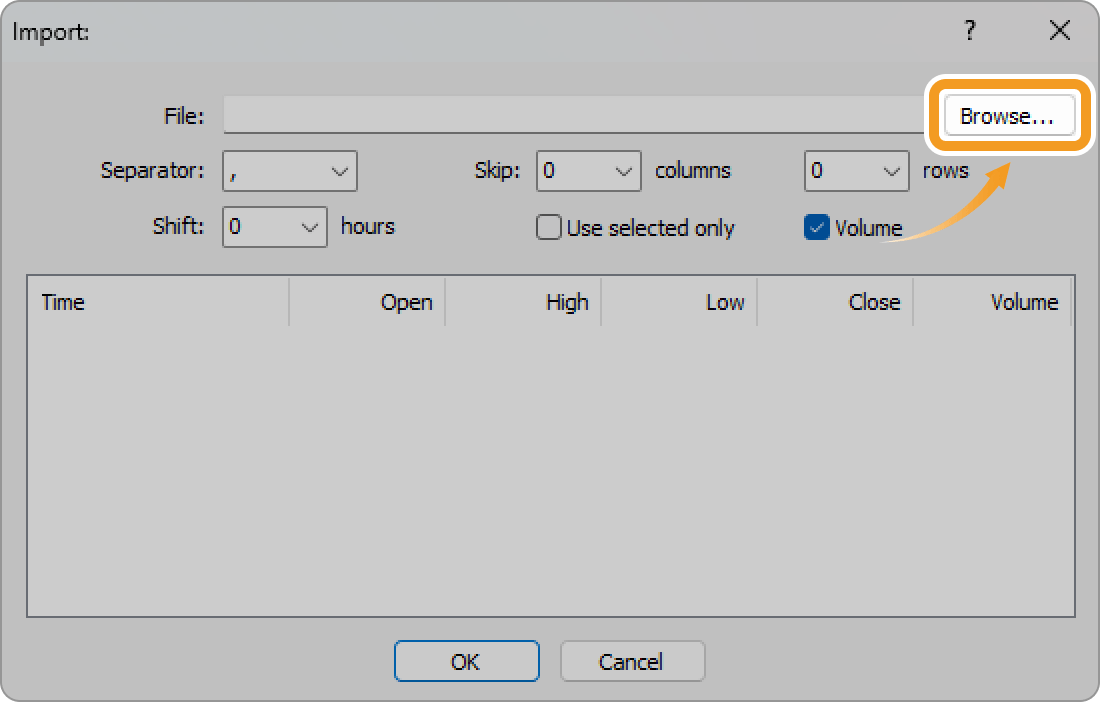
Click "Browse".
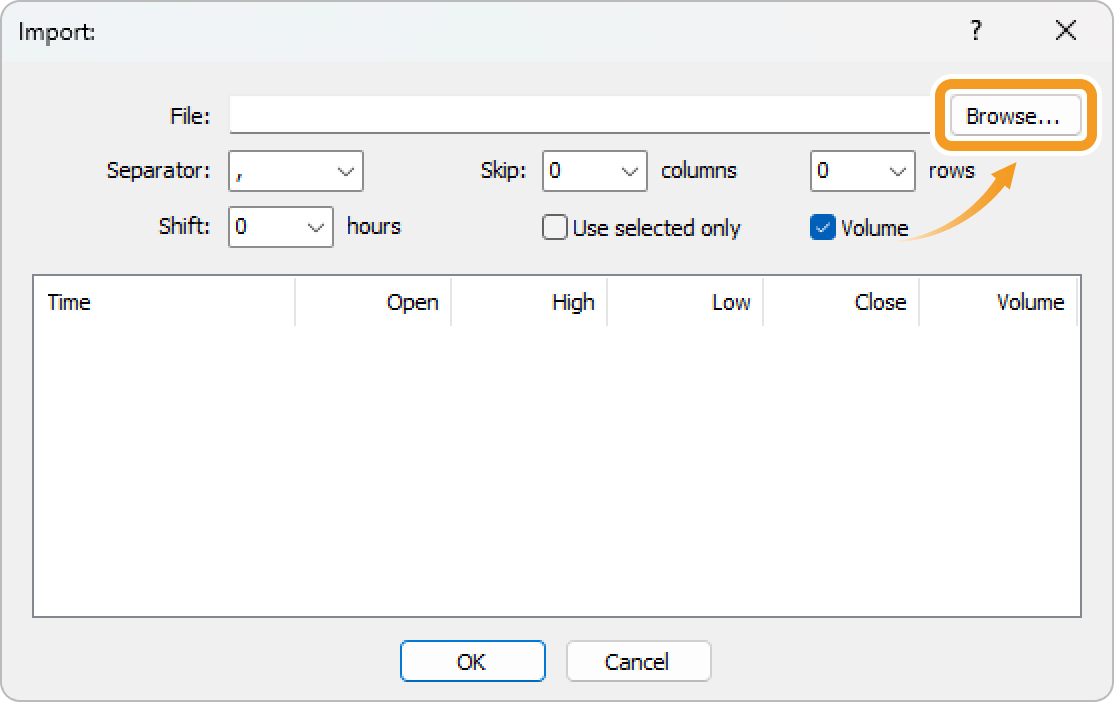
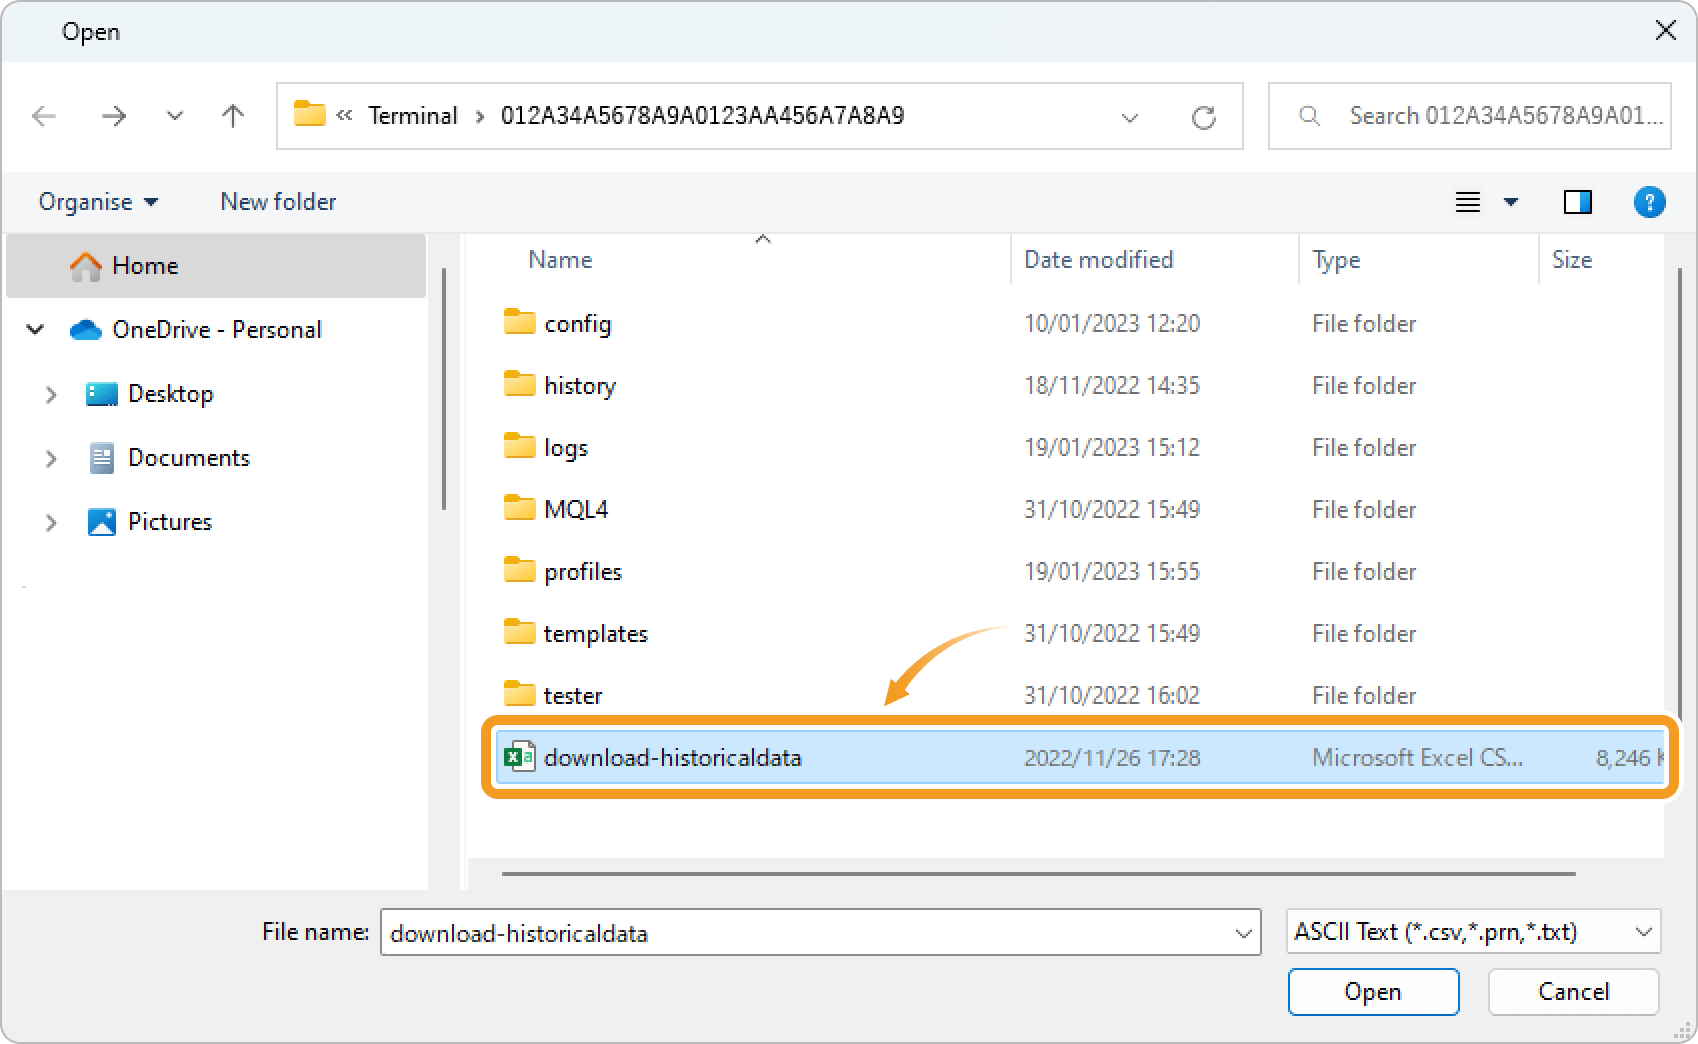
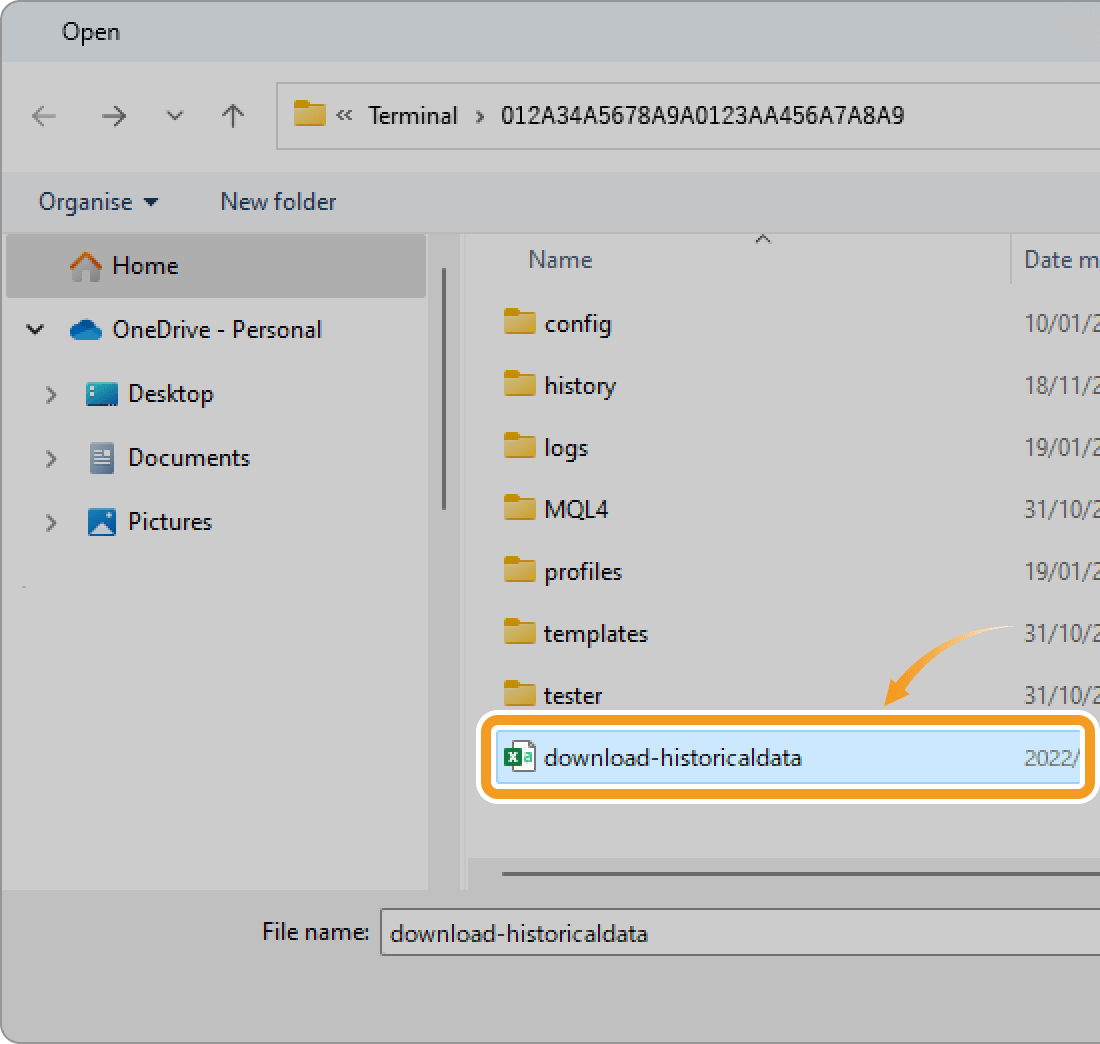
Choose the historical data file to import. If you can't find the file, change the file type to "All Files" in the lower right so that all file formats will be shown. Available files are csv and hst.
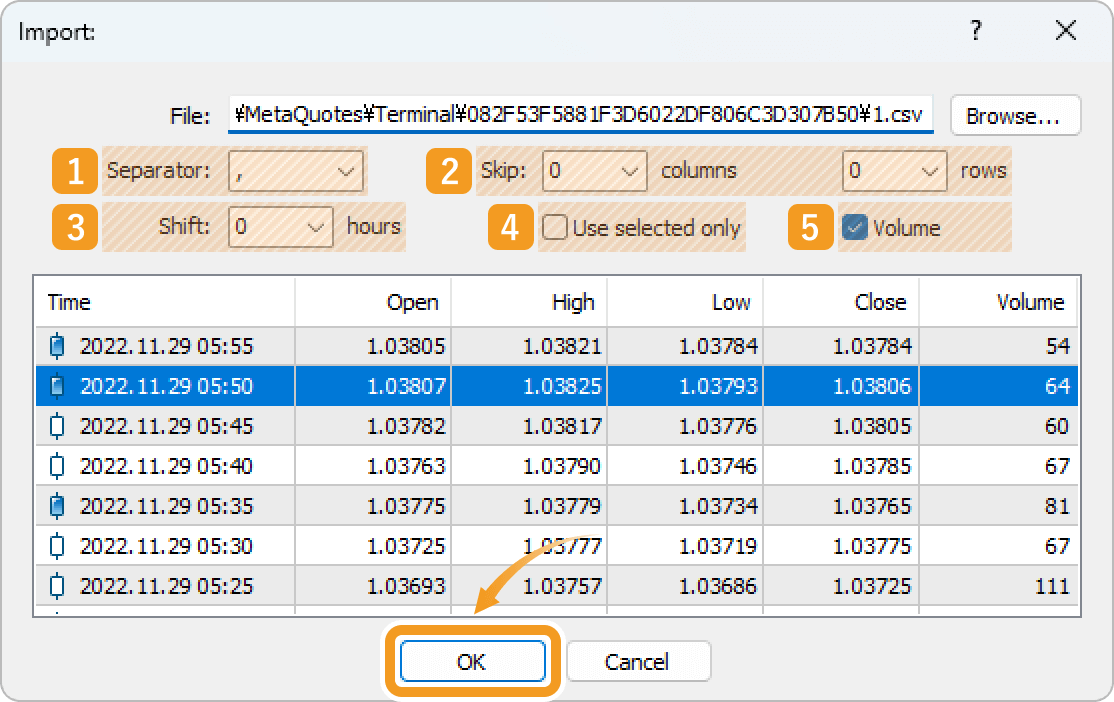
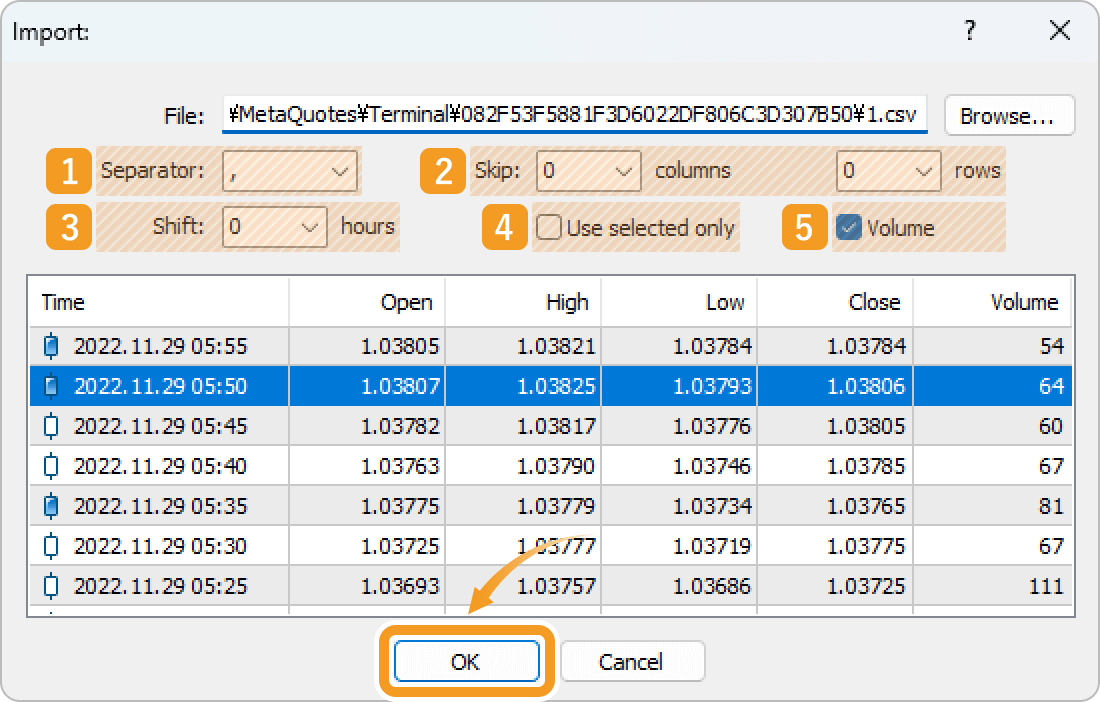
Configure the details of historical data to import. Click "OK" and historical data will be imported.
|
Number |
Item name |
Descriptions |
|---|---|---|
|
1 |
Separator |
Specify the character that separates each item in the data. |
|
2 |
Skip |
Specify the number of rows and columns you want to skip when importing historical data. For example, if you set "rows" to 1000, the first 1,000 rows of the selected historical data will be excluded from the import process. |
|
3 |
Shift |
Shift the historical data by set hours. |
|
4 |
Use selected only |
Check this box when you want to only import the specified historical data. Don't check it if you don't specify the data. |
|
5 |
Volume |
Uncheck this box when you don't want to import the volume data. |
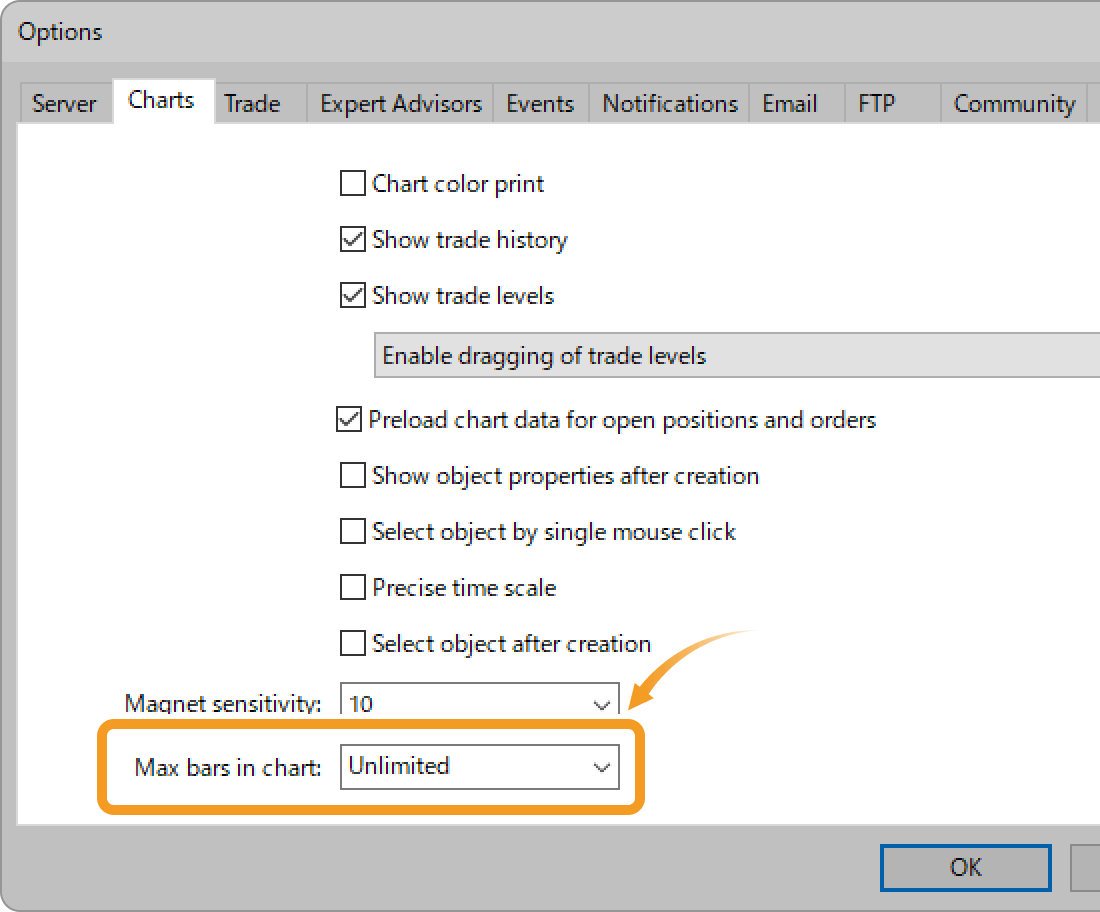
First, increase the number of bars on charts. Click "Tools" on the menu and select "Options". (Shortcut keys: "Ctrl"+"O")
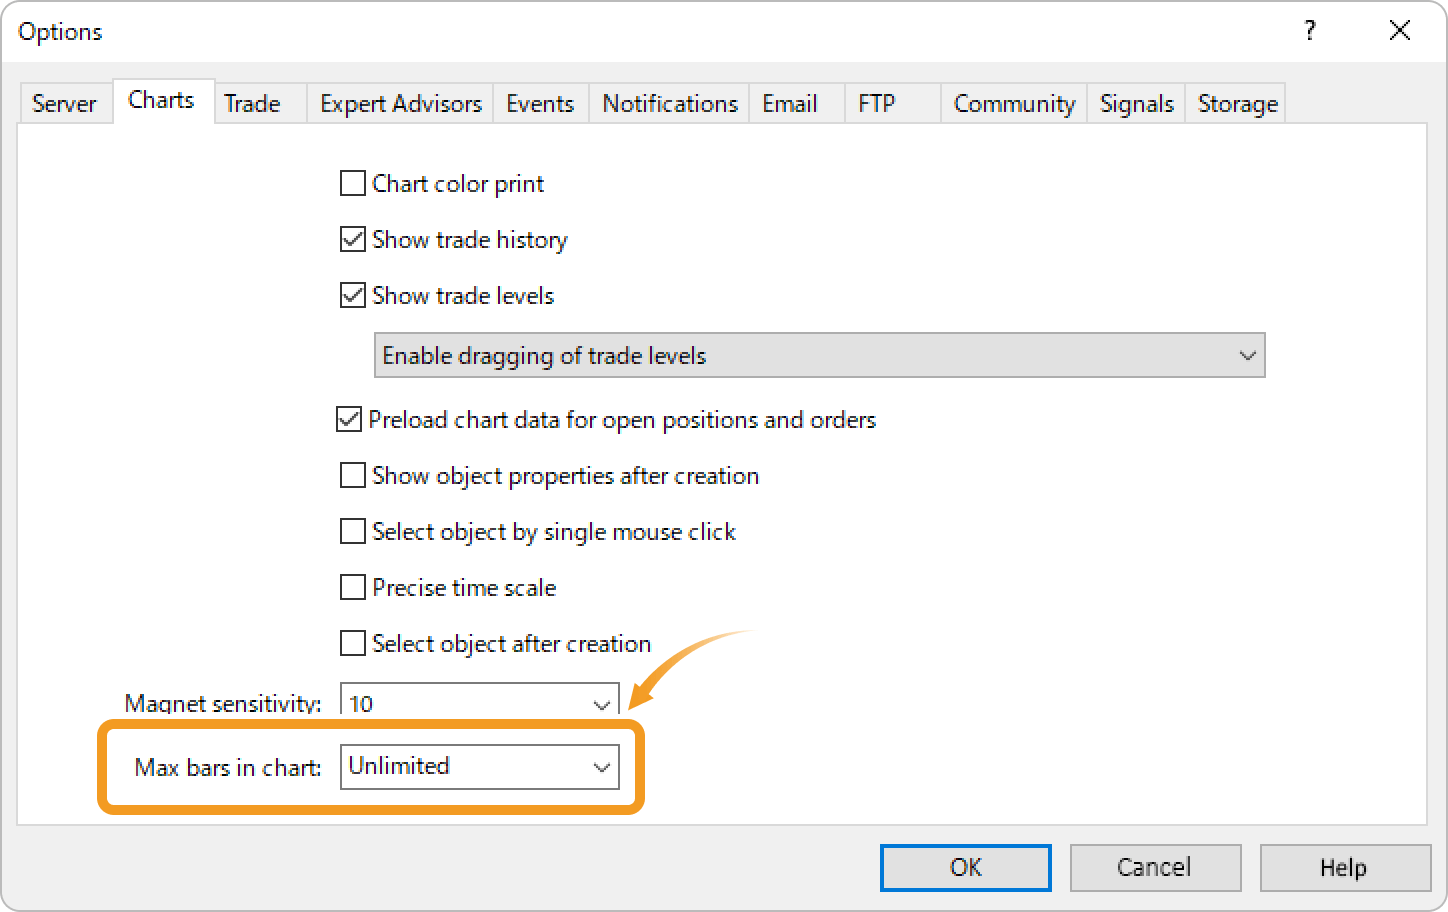
Set "Max bars in chart" to "Unlimited" in the "Charts" tab. Click "OK" and relaunch MT5.
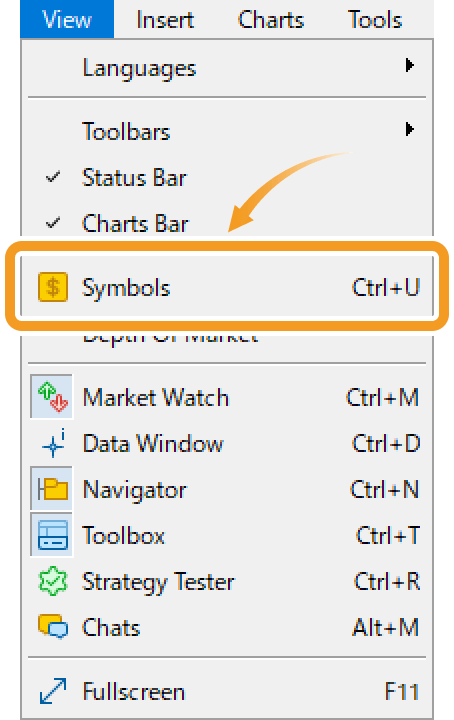
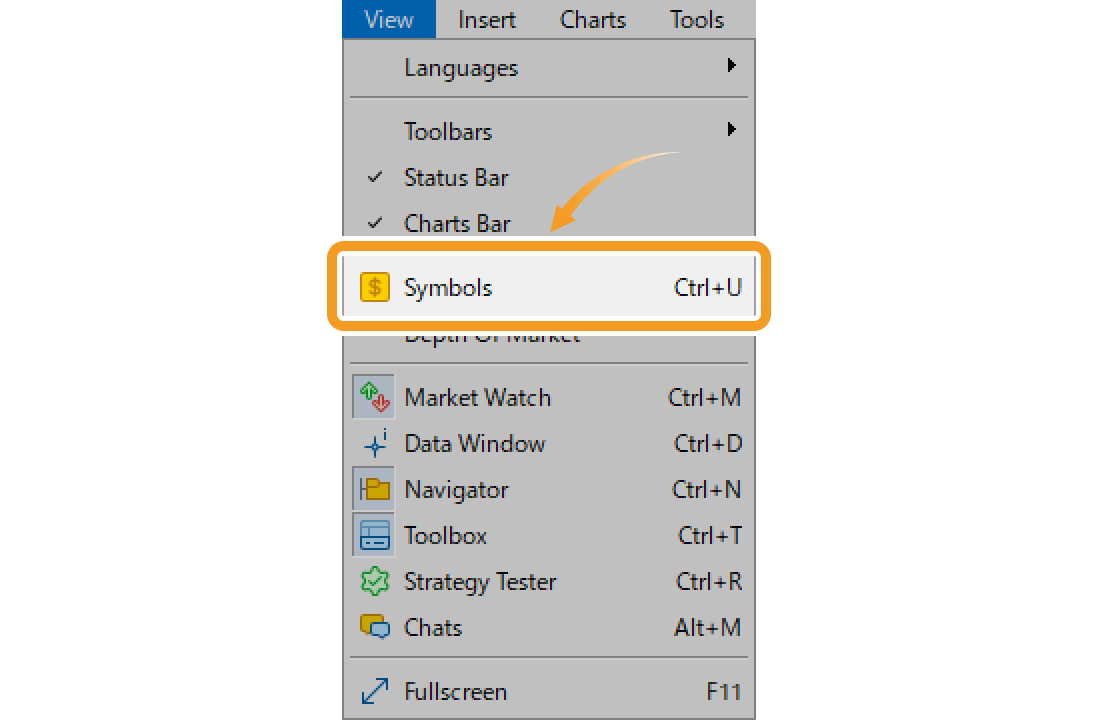
Next, import the historical data. Click "View" on the menu and select "Symbols". (Shortcut keys: "Ctrl"+"U")
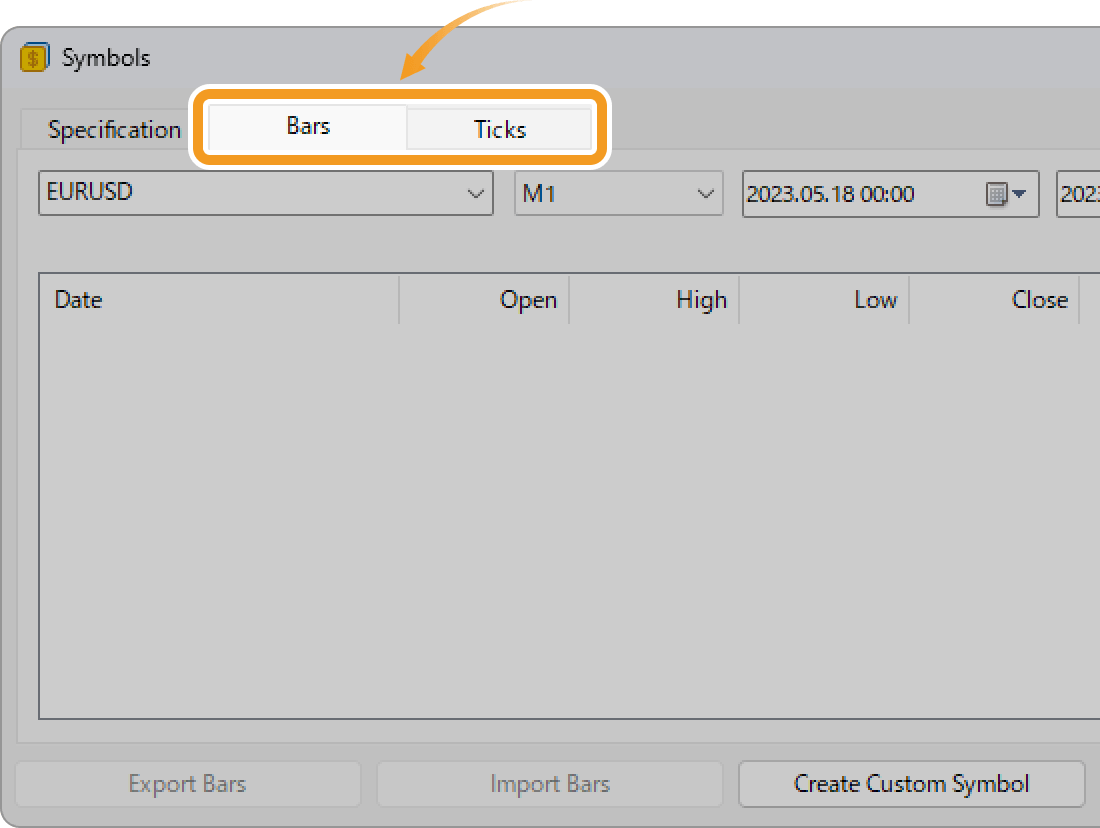
Go to the "Bars" tab if you want to import the histrical bar data, and the "Ticks" tab if you want to import the tick data.
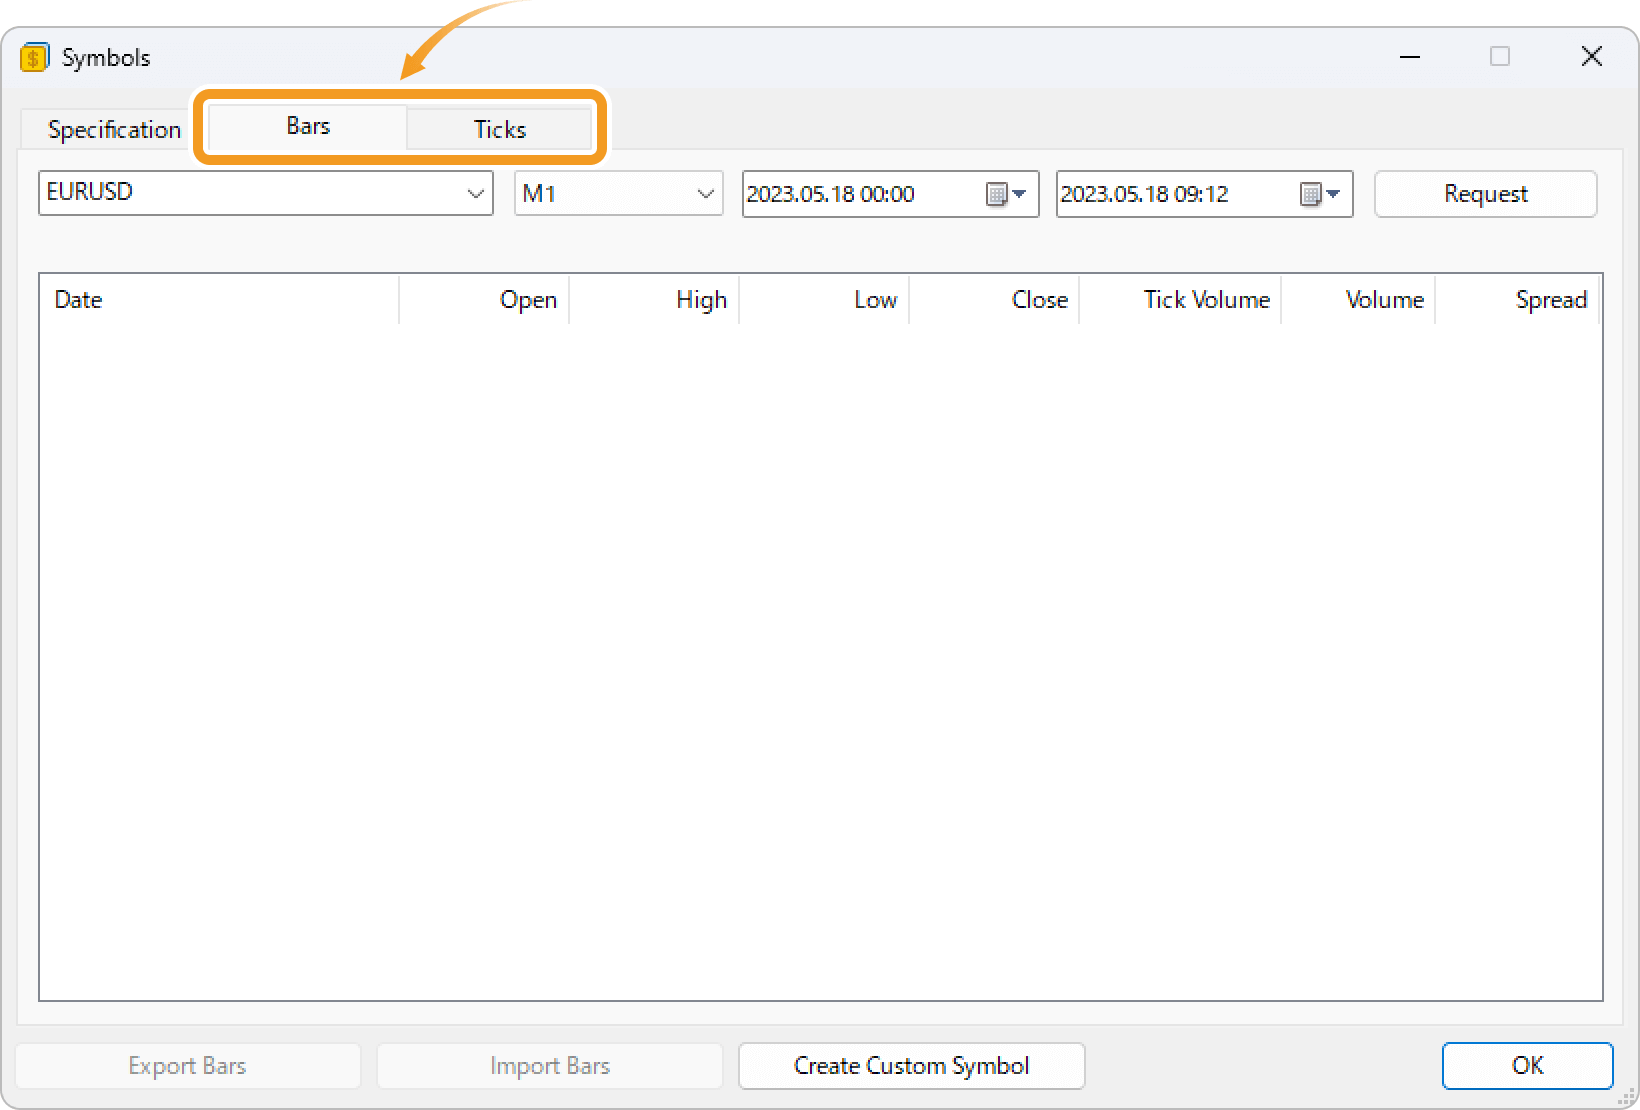
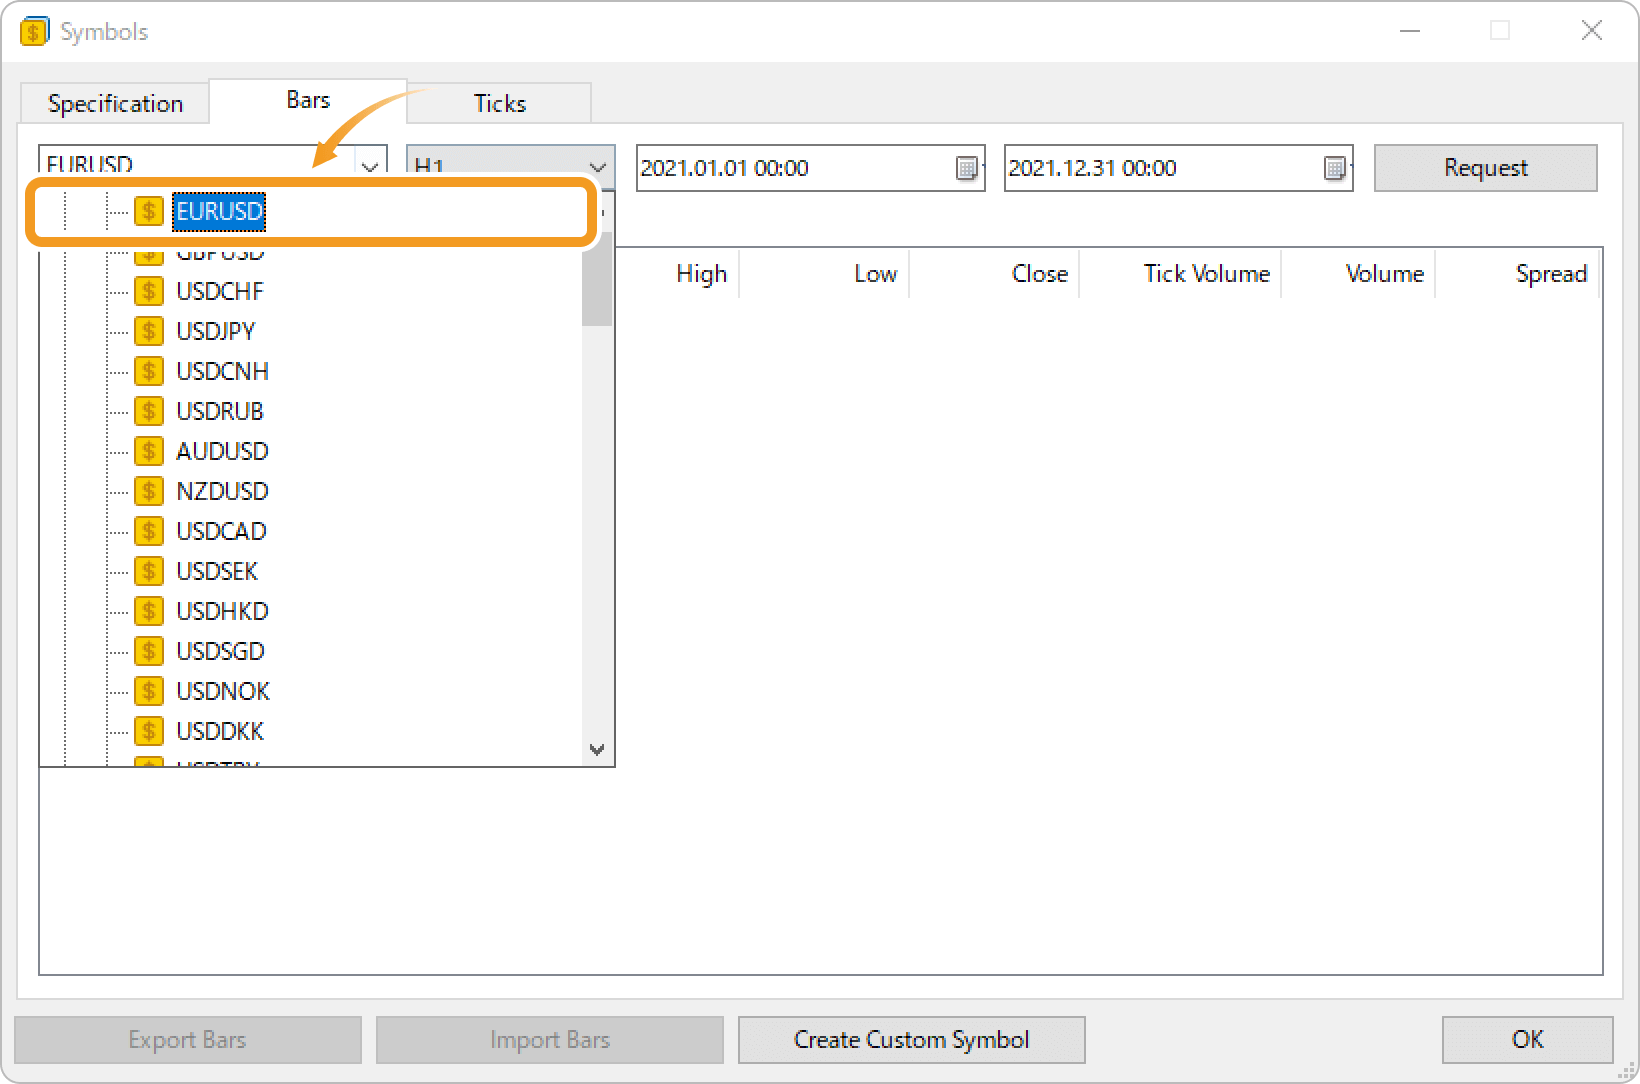
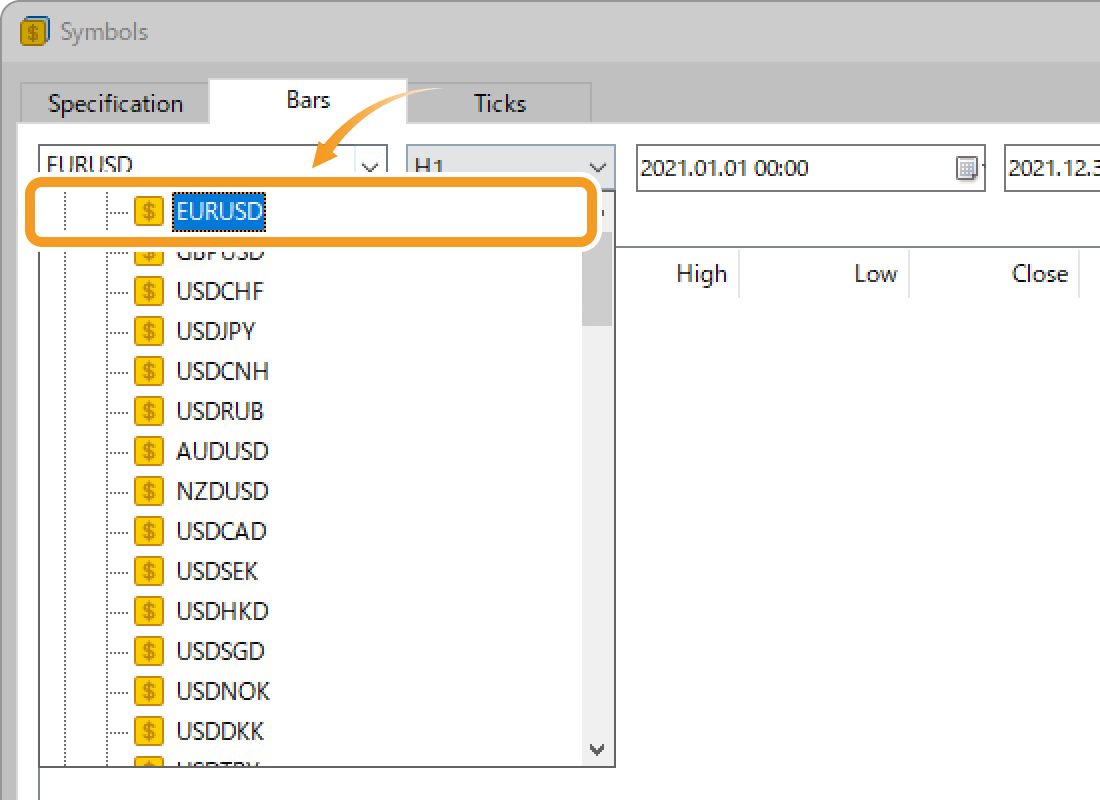
Select the symbol of the historical data to import.
Click "Create Custom Symbol".
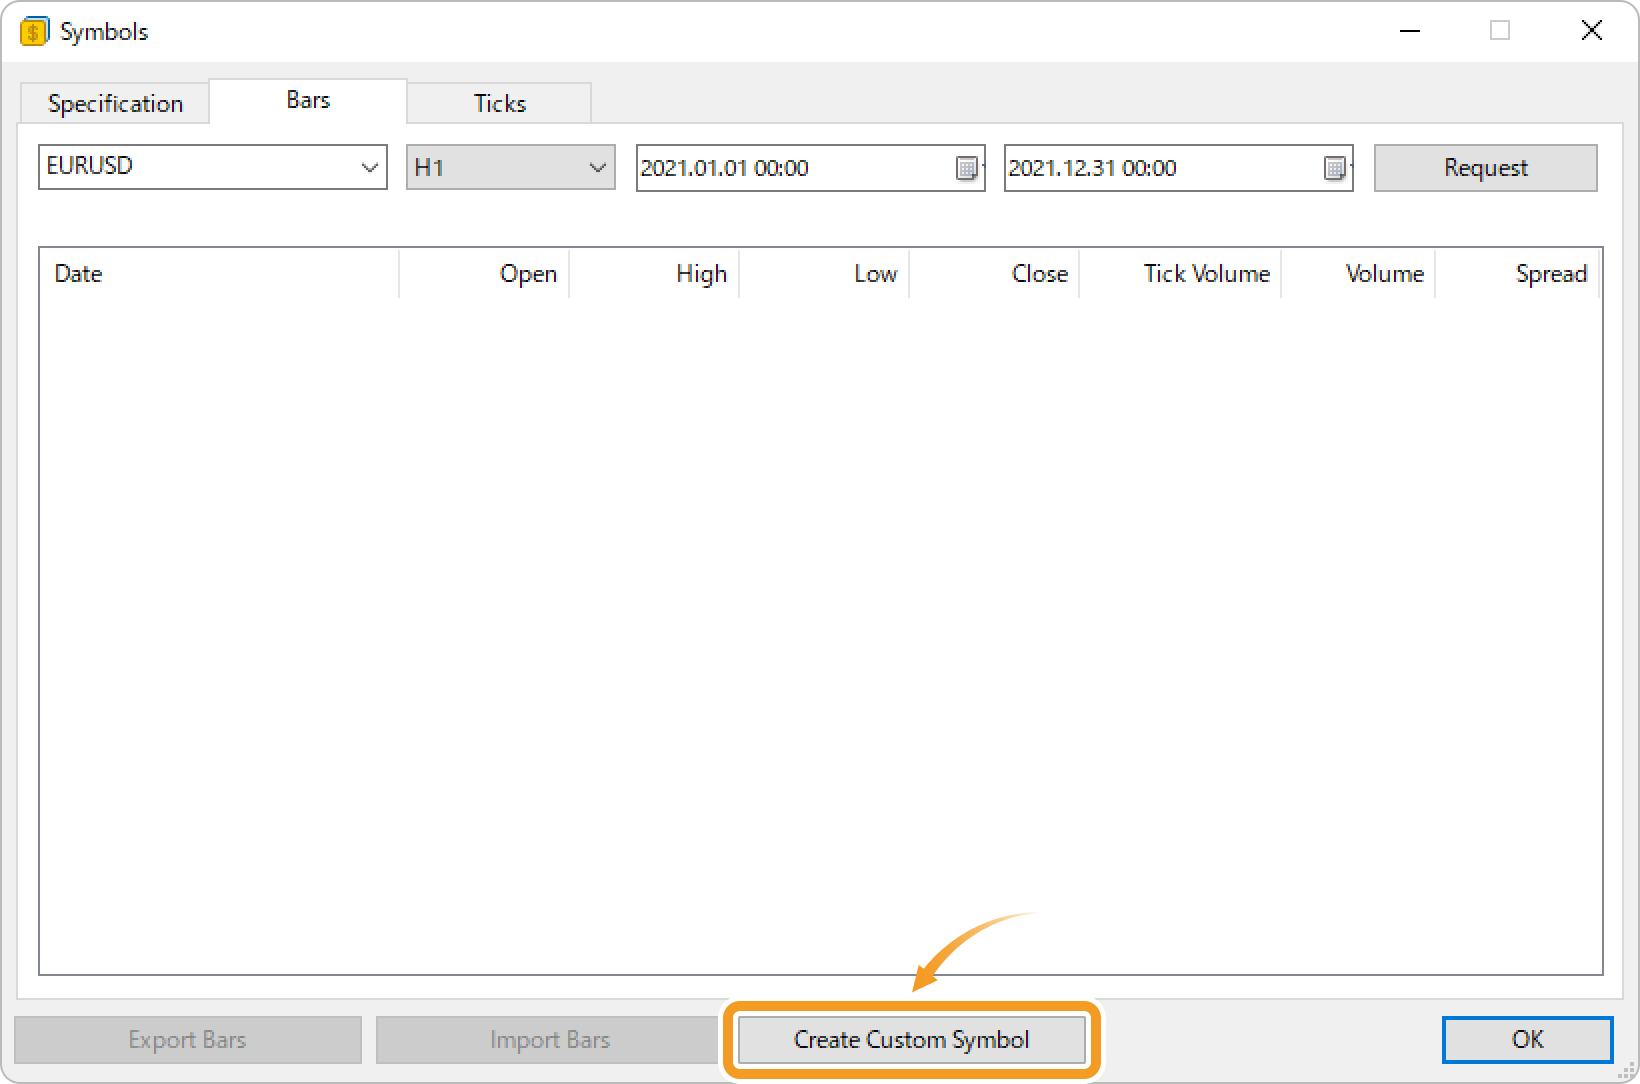
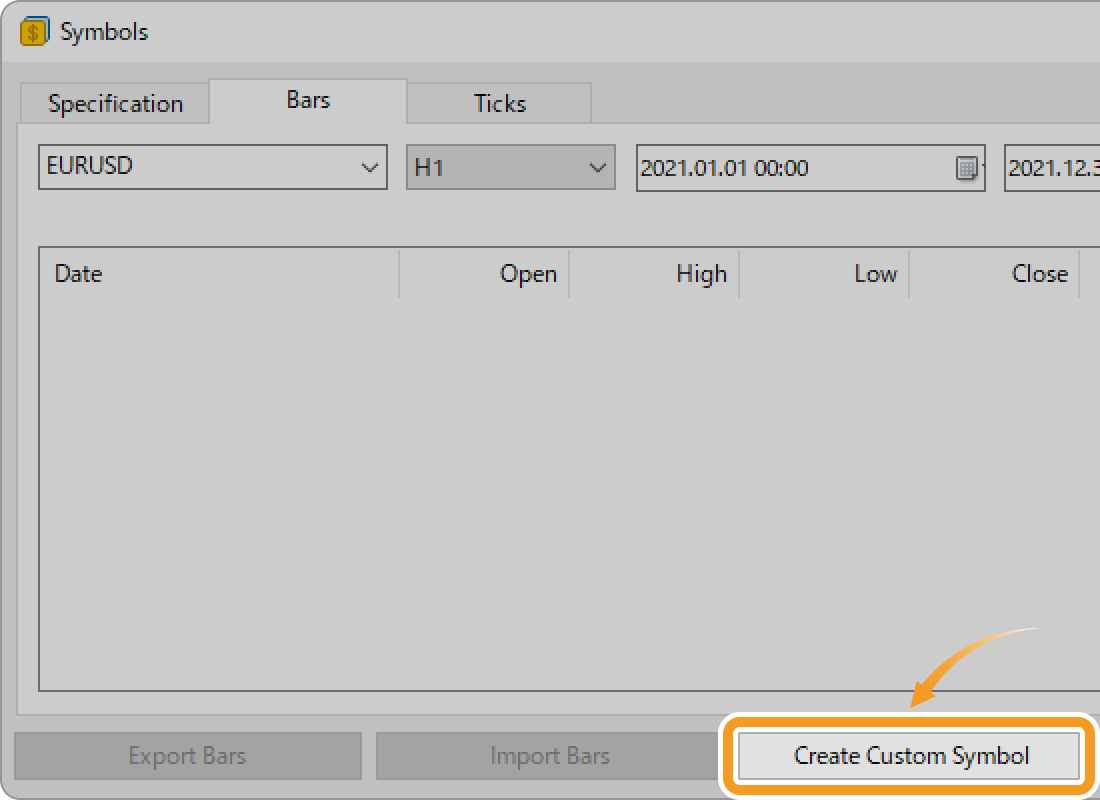
In MT5, you cannot delete or overwrite existing historical data. When importing historical data, you must first create a new custom symbol. You can save multiple symbols using the same settings by specifying the importing data in the "Copy from" field when creating a custom symbol.
Related article: Create custom symbol
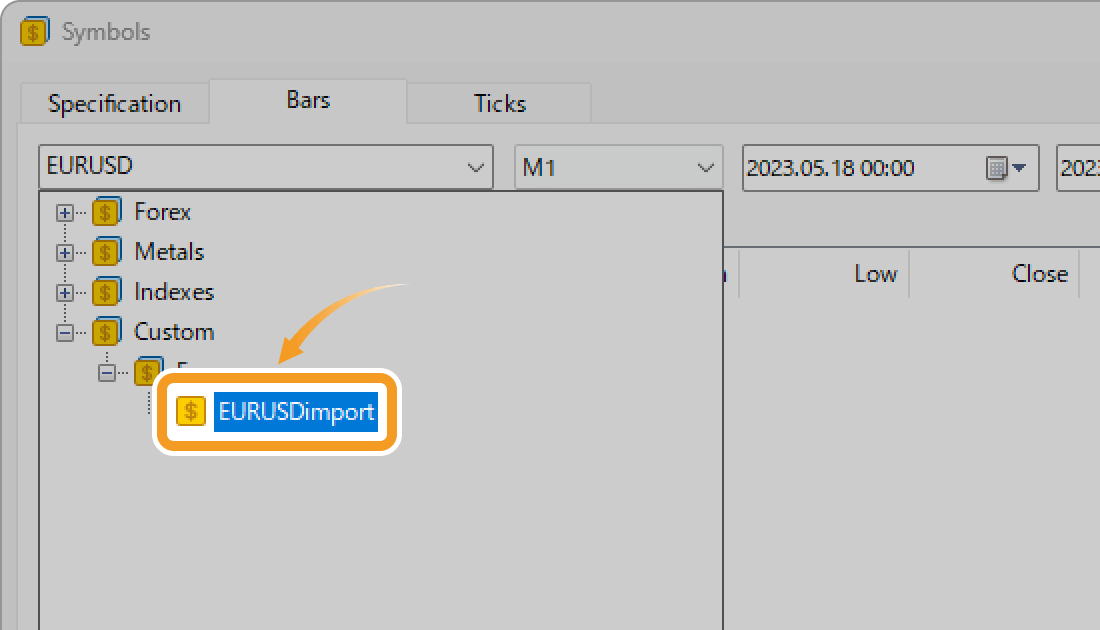
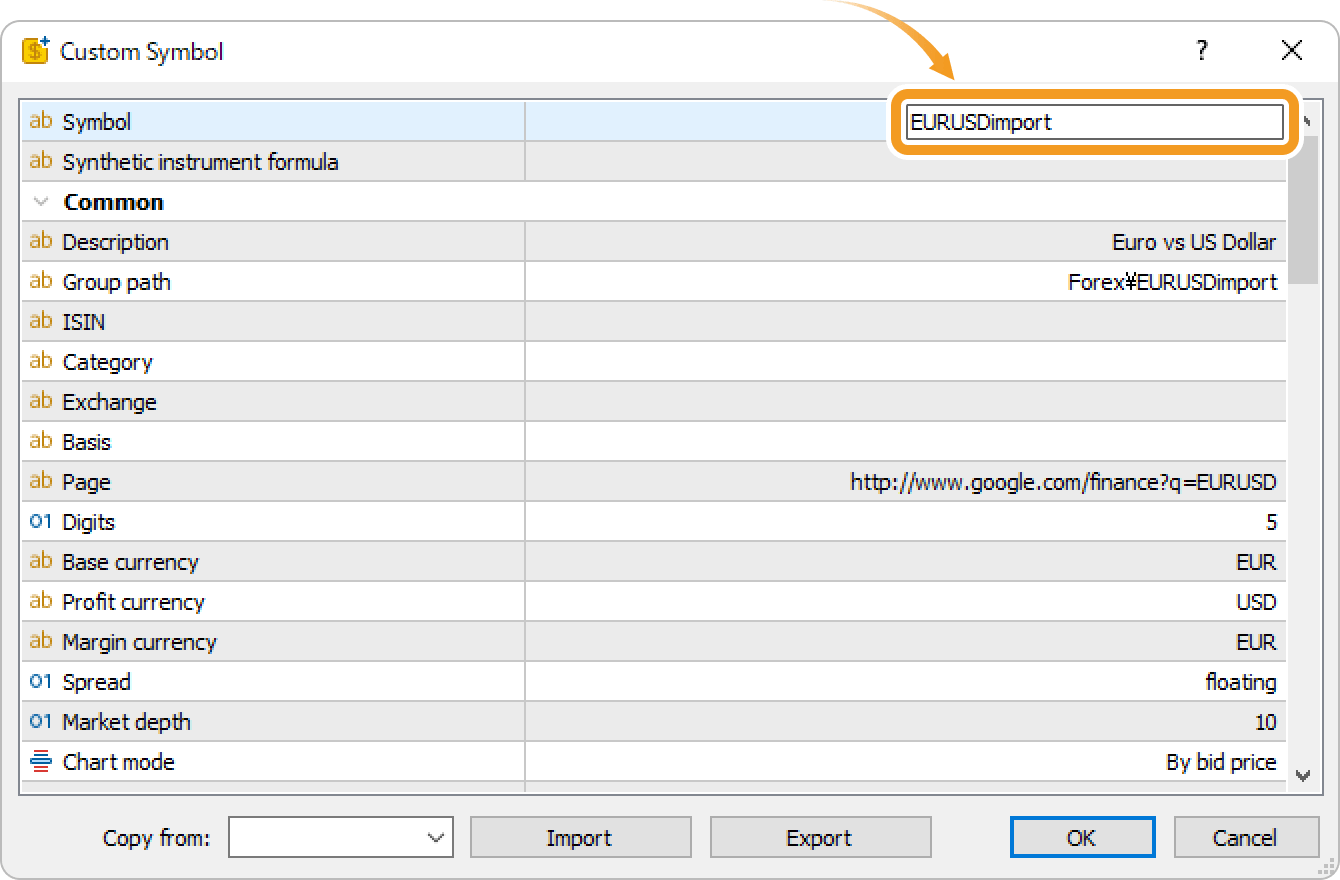
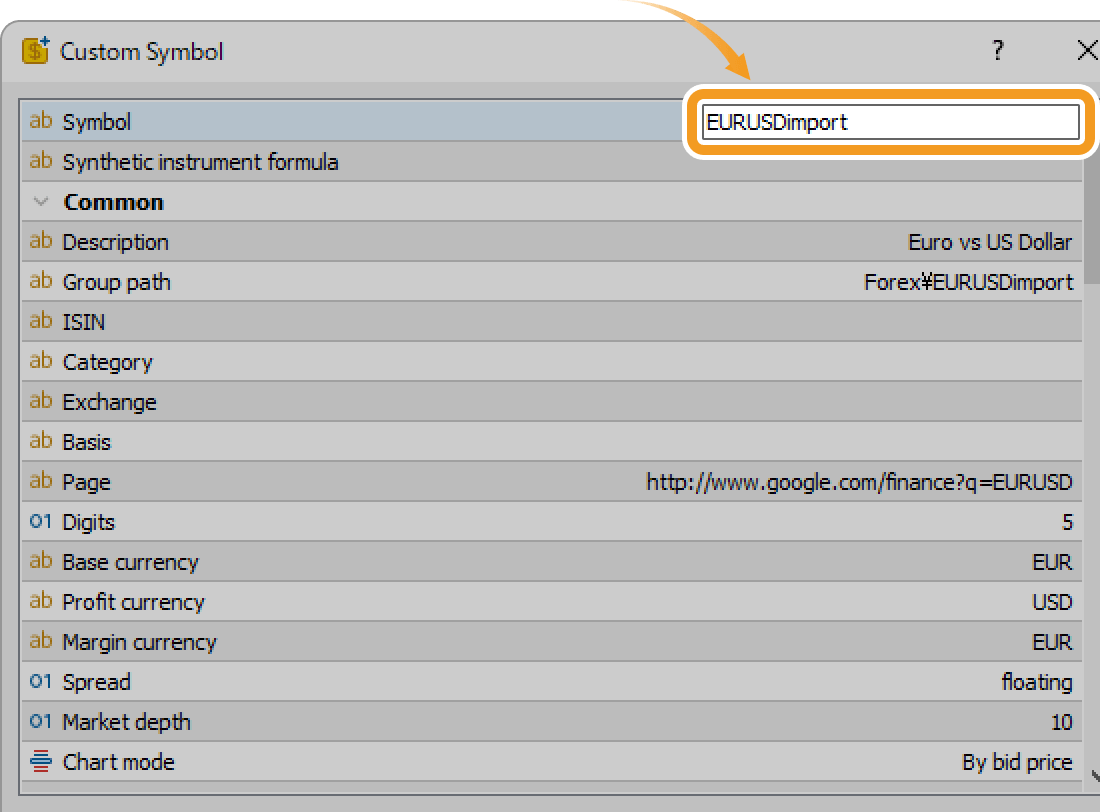
In the custom symbol window, double-click the symbol name. Set a symbol name different from the existing ones, as well as any other details if necessary, and click "OK".
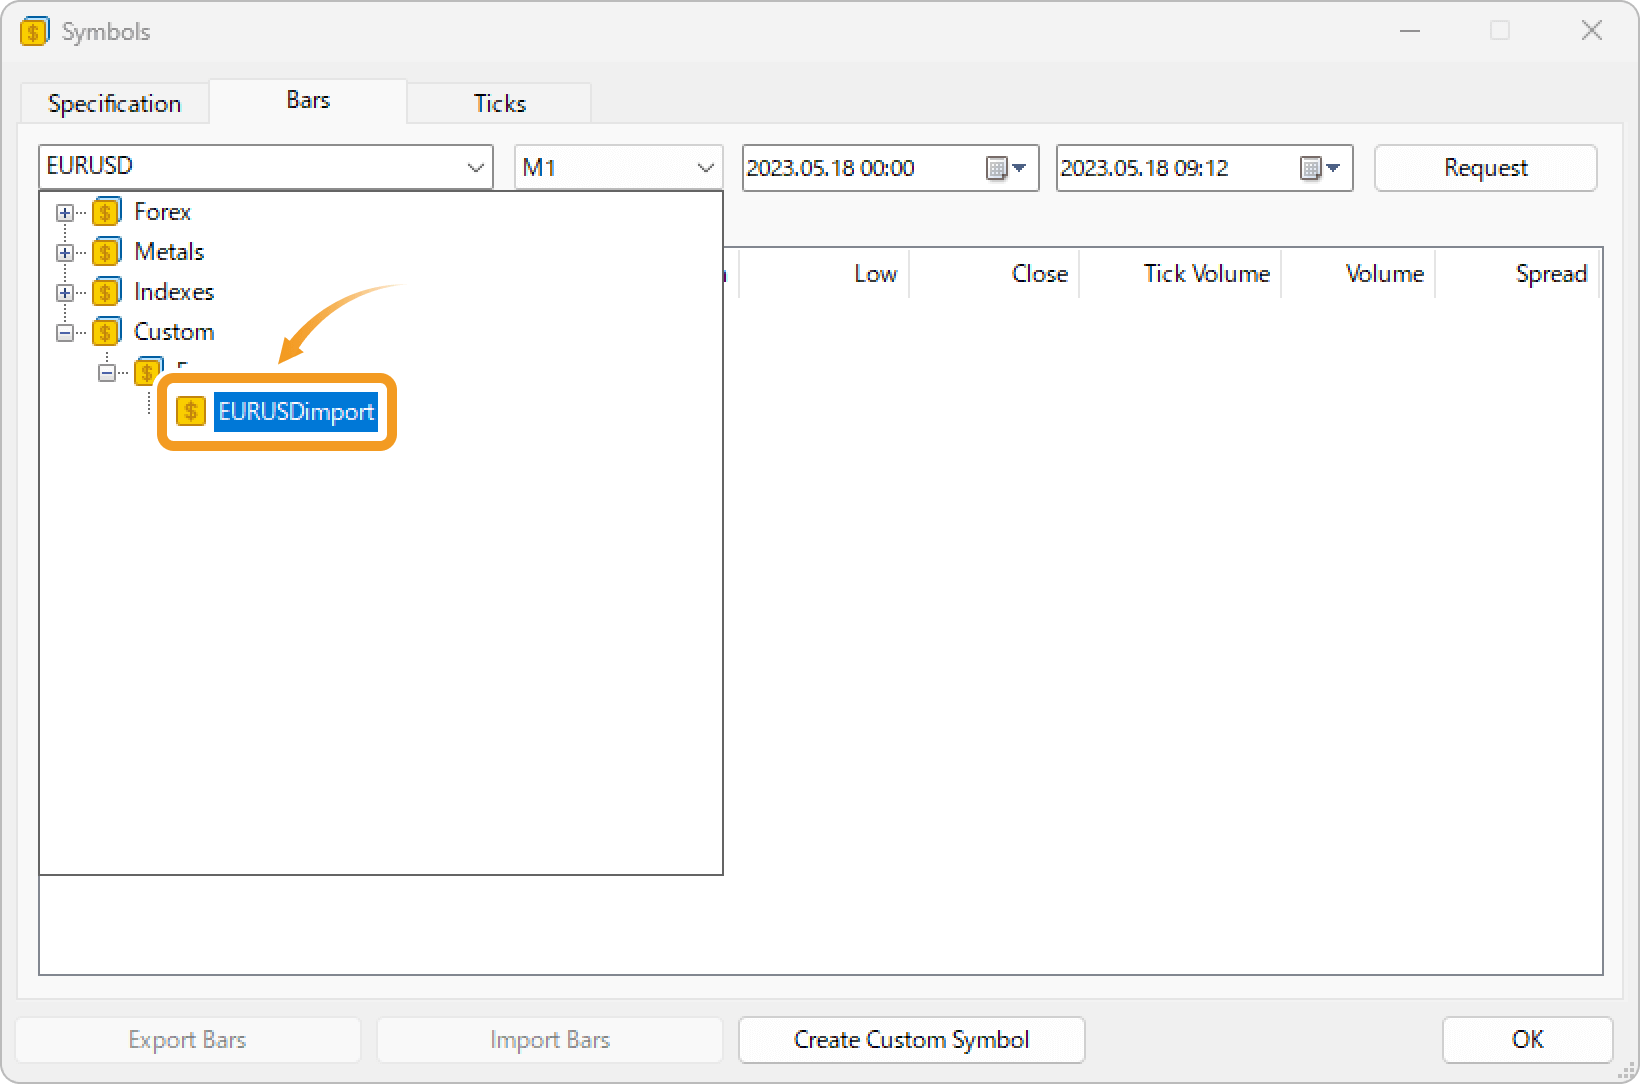
Select the symbol name you have set and click "Import Bars/Ticks". Your symbol name will be shown under "Custom".
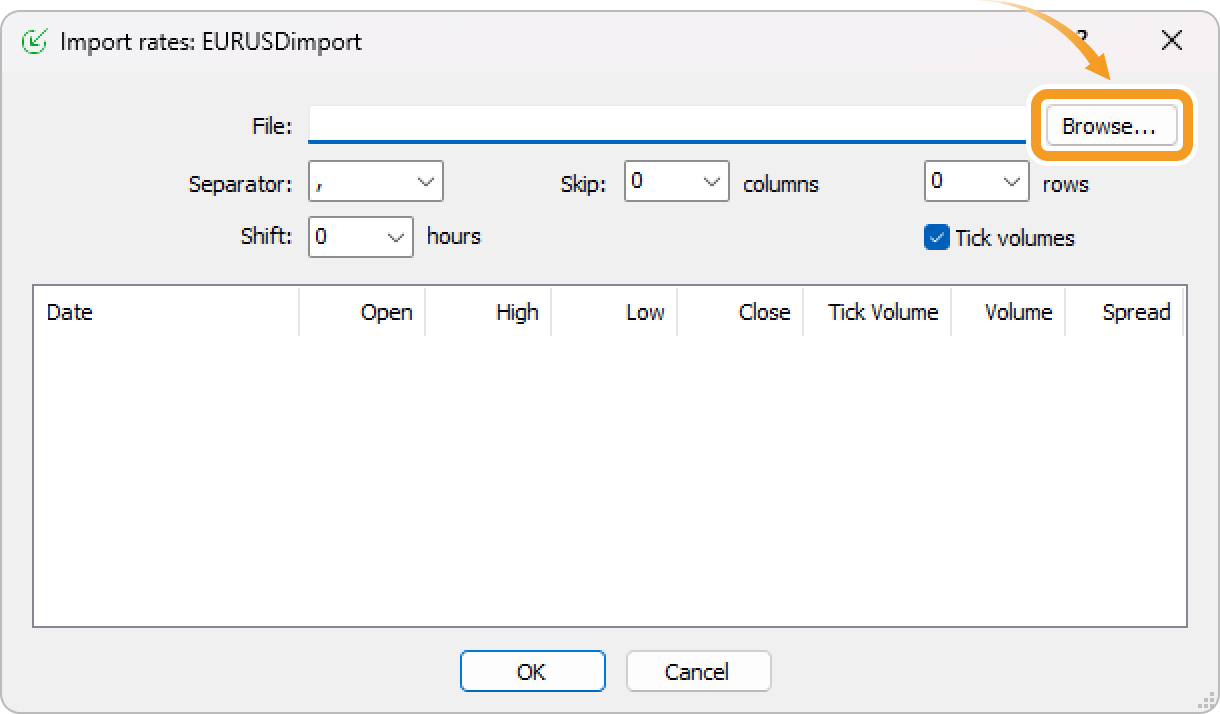
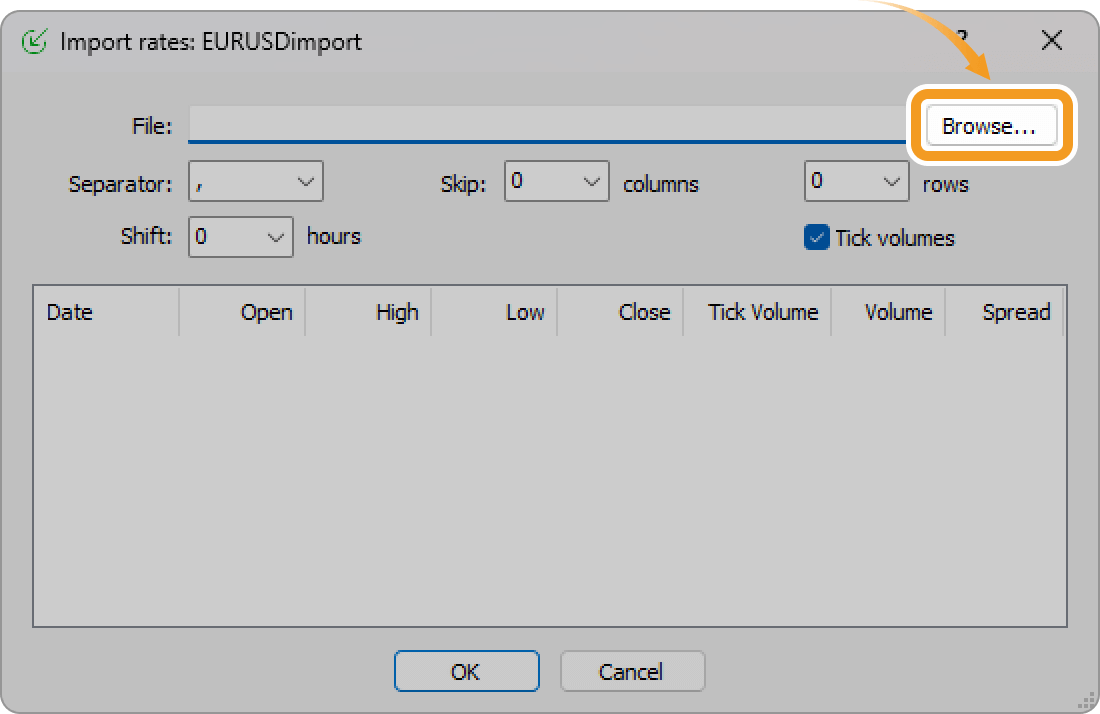
Click the "Browse" button.
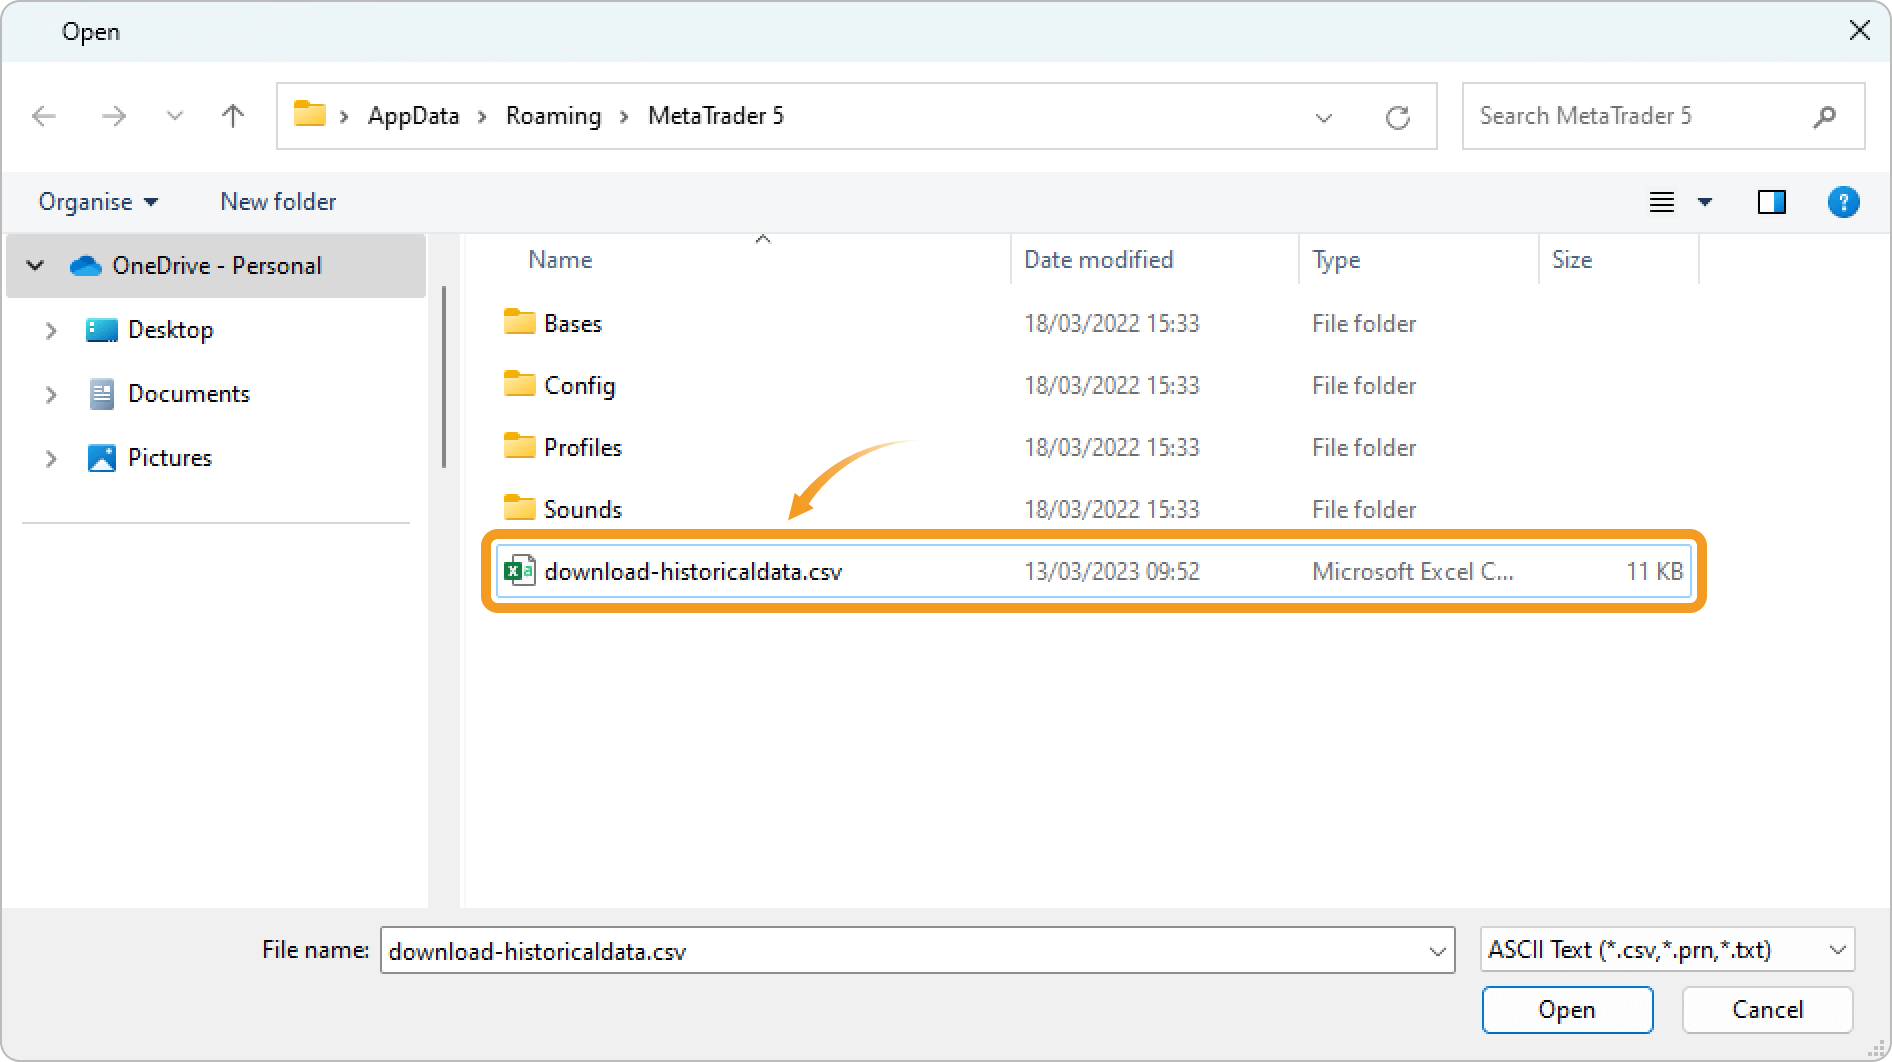
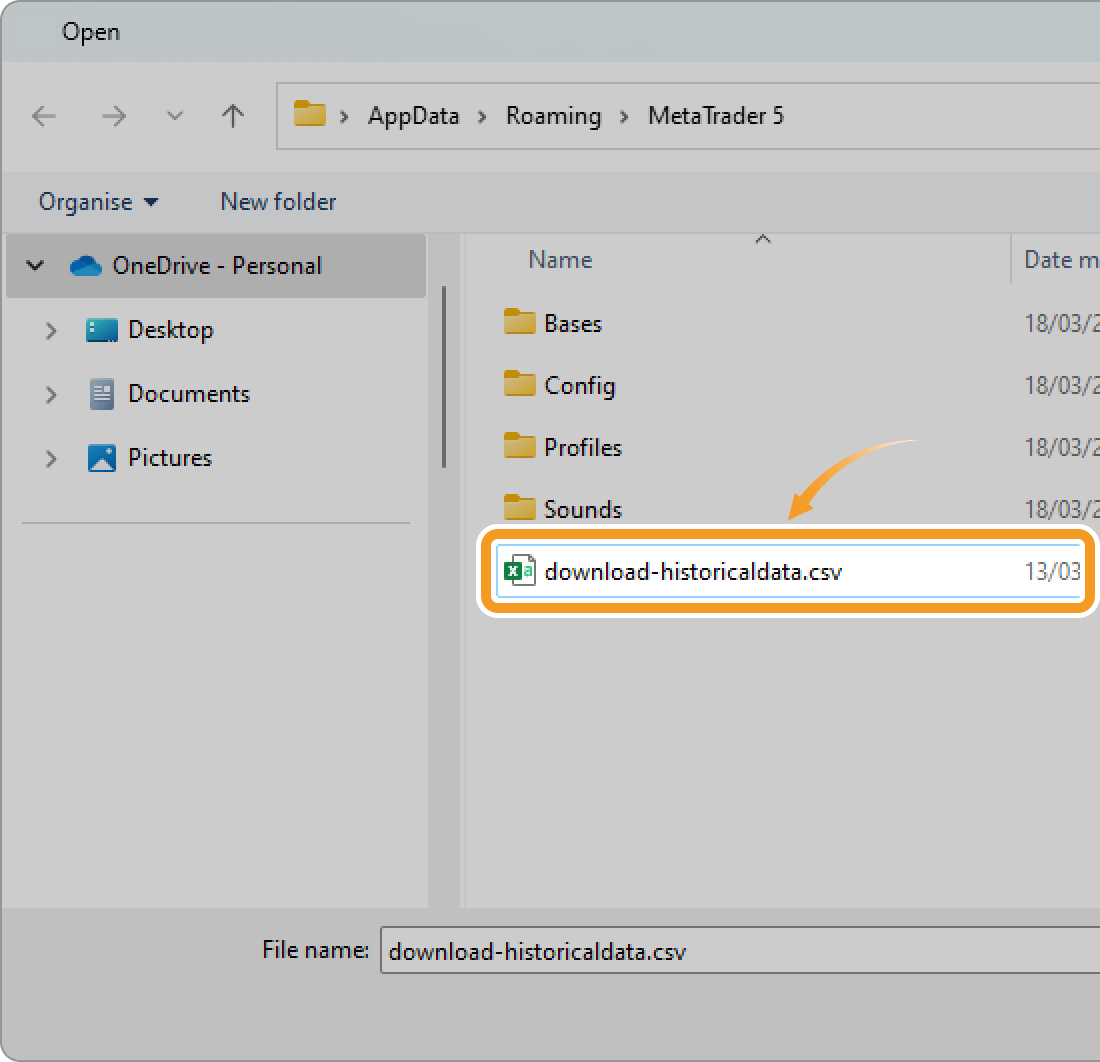
Choose the historical data file to import. If you can't find the file, change the file type to "All Files" in the lower right so that all file formats will be shown. Available files are csv and hst.
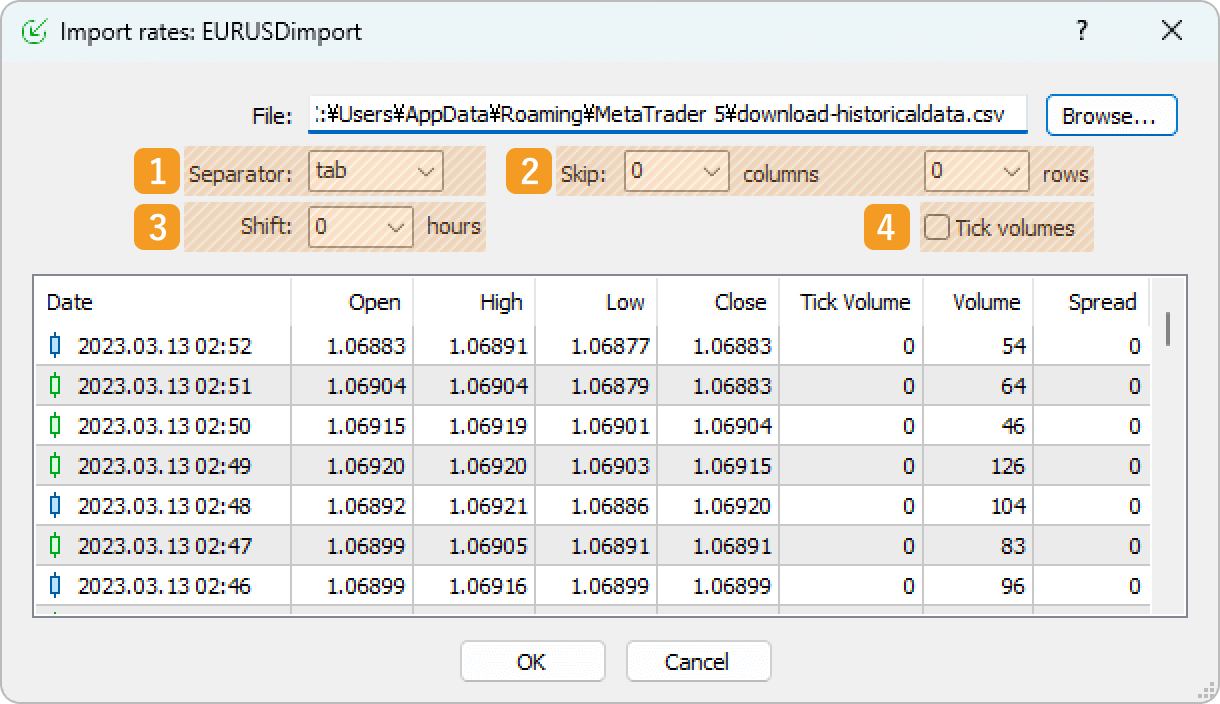
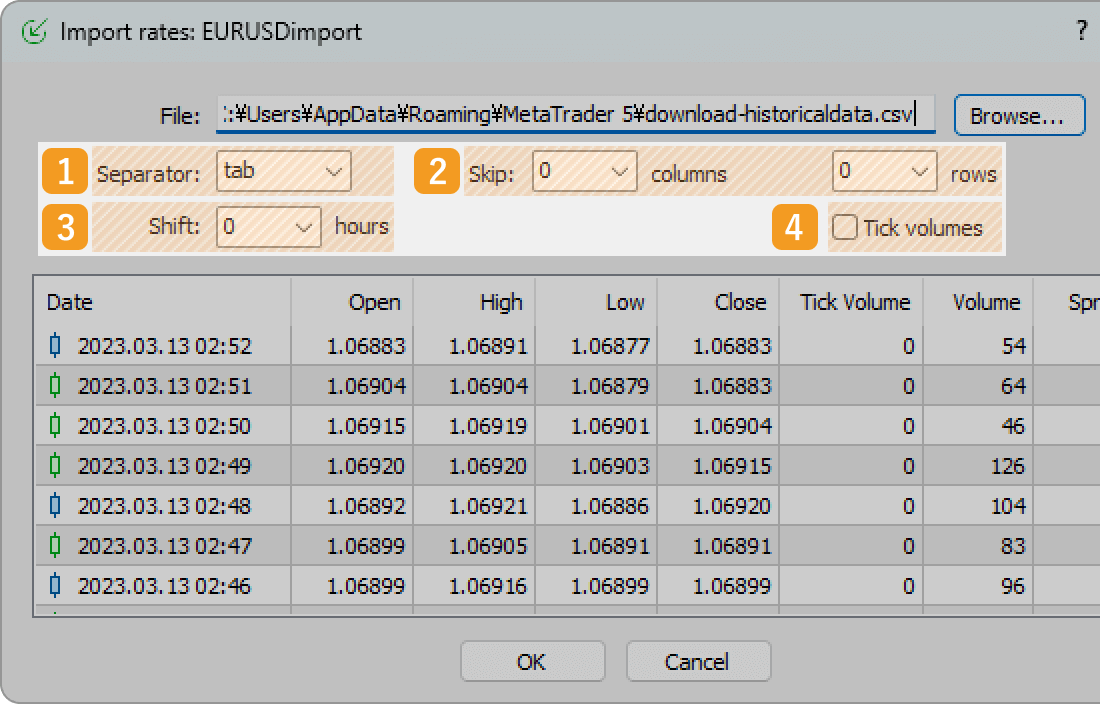
Configure the details of historical data to import. Click "OK" and historical data will be imported.
|
Number |
Item name |
Descriptions |
|---|---|---|
|
1 |
Separator |
Specify the character that separates each item in the data. |
|
2 |
Skip |
Specify the number of rows and columns you want to skip when importing historical data. For example, if you set "rows" to 1000, the first 1,000 rows of the selected historical data will be excluded from the import process. |
|
3 |
Shift |
Shift the historical data by set hours. |
|
4 |
Tick volumes |
Check this box when the historical data has tick volumes. |
Was this article helpful?
0 out of 0 people found this article helpful.
Thank you for your feedback.