Display arrows and other objects
EA, indicators & objects (PC)
EA, indicators & objects (PC)

This article was :
published
updated
On MetaTrader4 (MT4) / MetaTrader5 (MT5), you can display objects such as arrows on charts. MT5 offers 11 types of objects, while MT4 has 8 types available in the menu. Additional objects can also be selected from the list.
Here we will look at how to display and set up these objects on MT4/MT5.
Switch between MT4/MT5 tabs to check the steps for each.
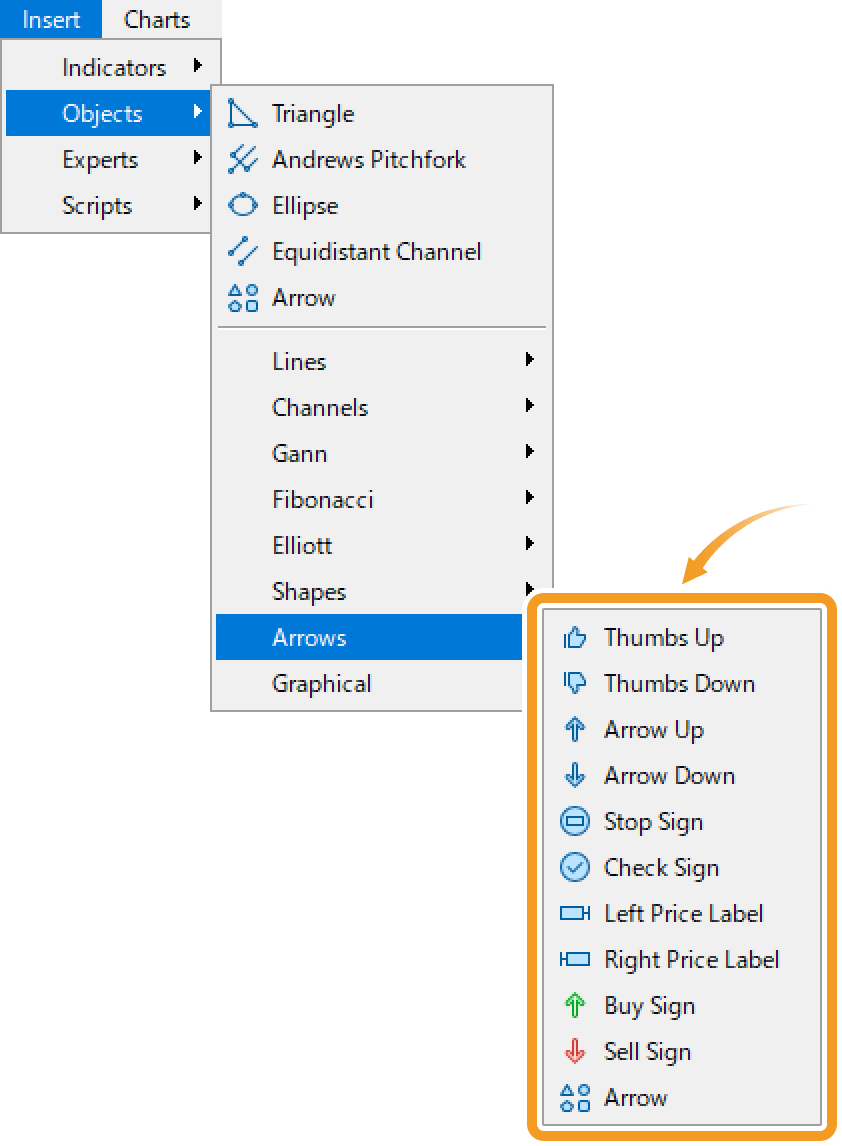
Click "Insert" in the menu. Hover the pointer over "Arrows" and select an object.
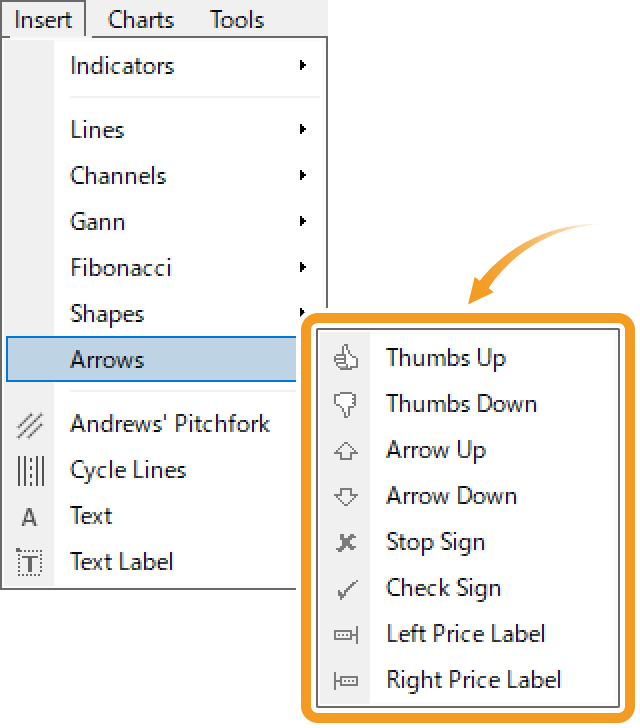
Thumbs Up/Down


Highlight a specific part of the chart with a thumbs-up/thumbs-down object.
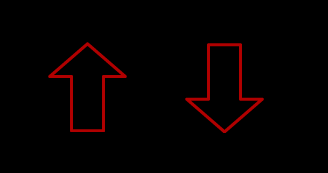
Up/Down Arrow
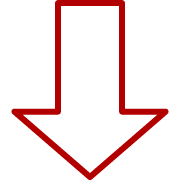

Highlight a specific part of the chart with an upward/downward arrow.
Stop/Check Sign


Highlight a specific part of the chart with an X mark or check mark.
Left/Right Price Label

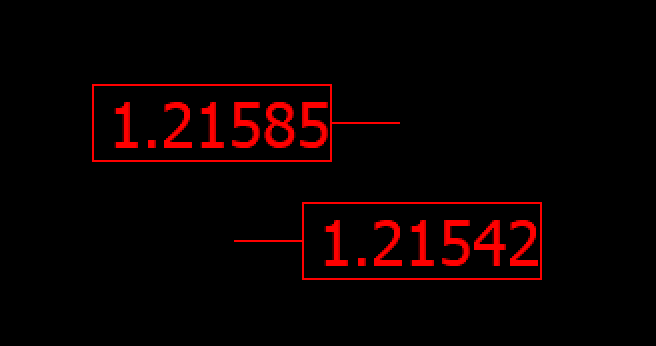
Show a price using a price label on the left/right side.
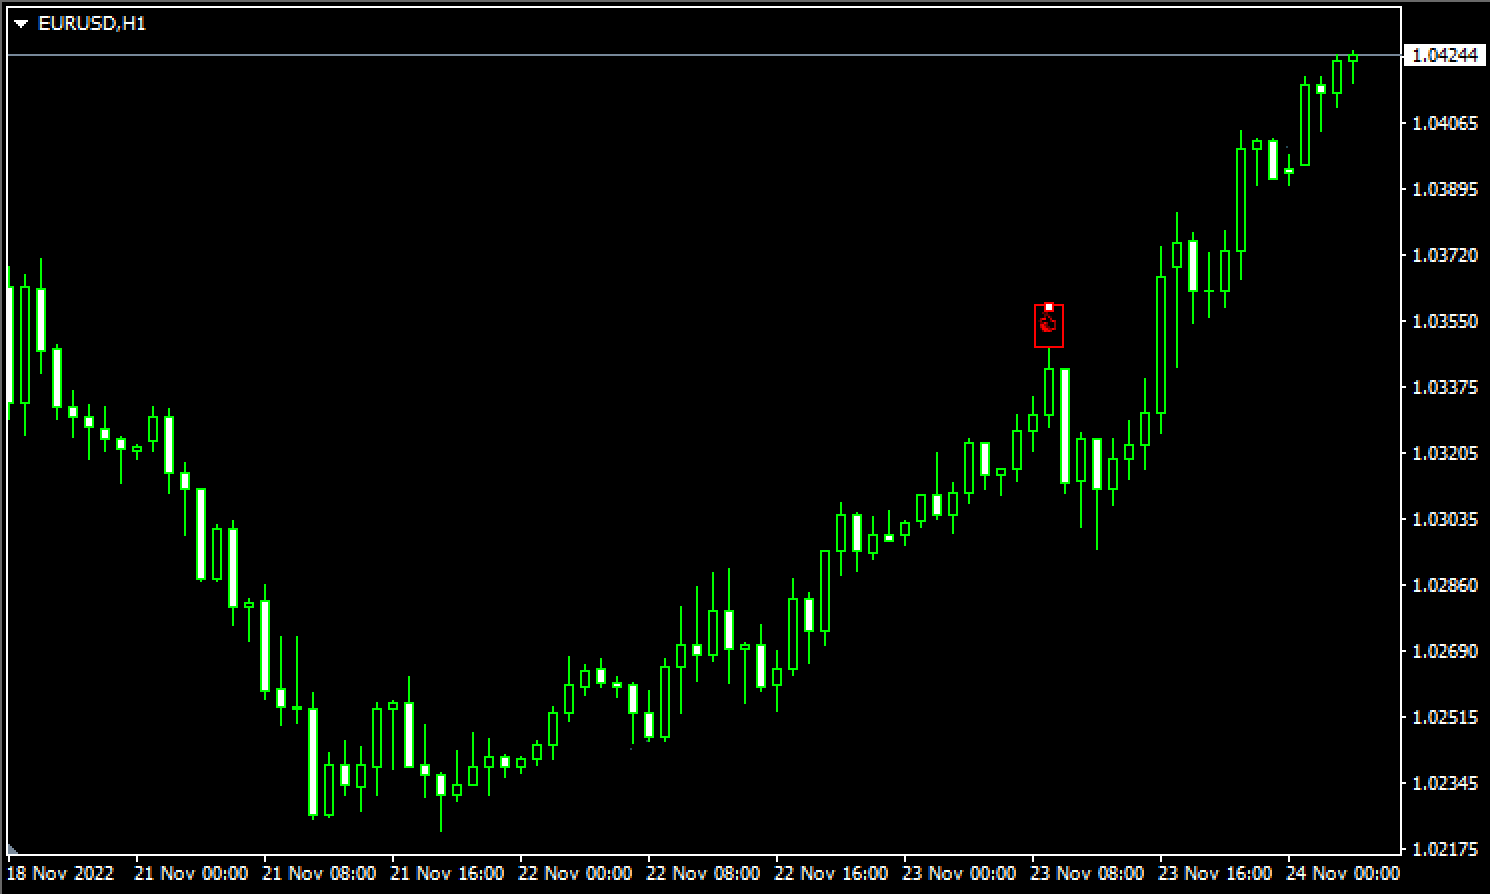
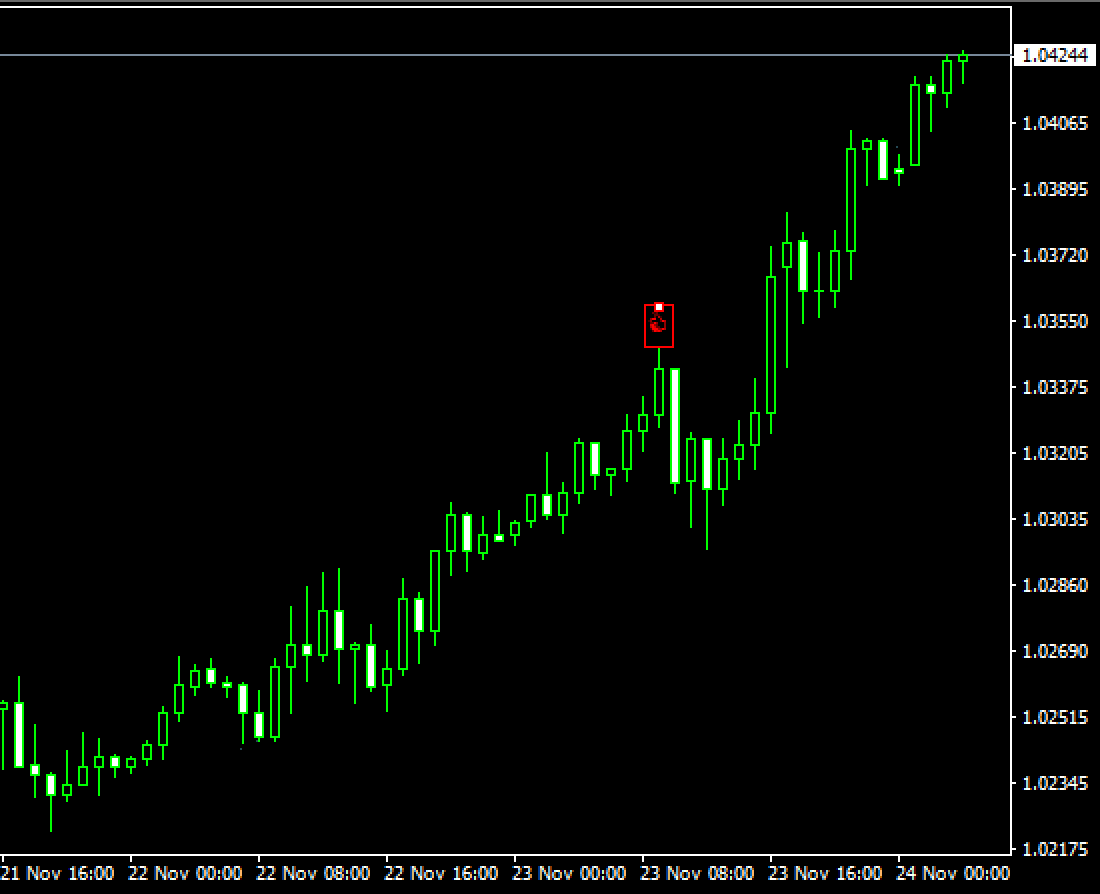
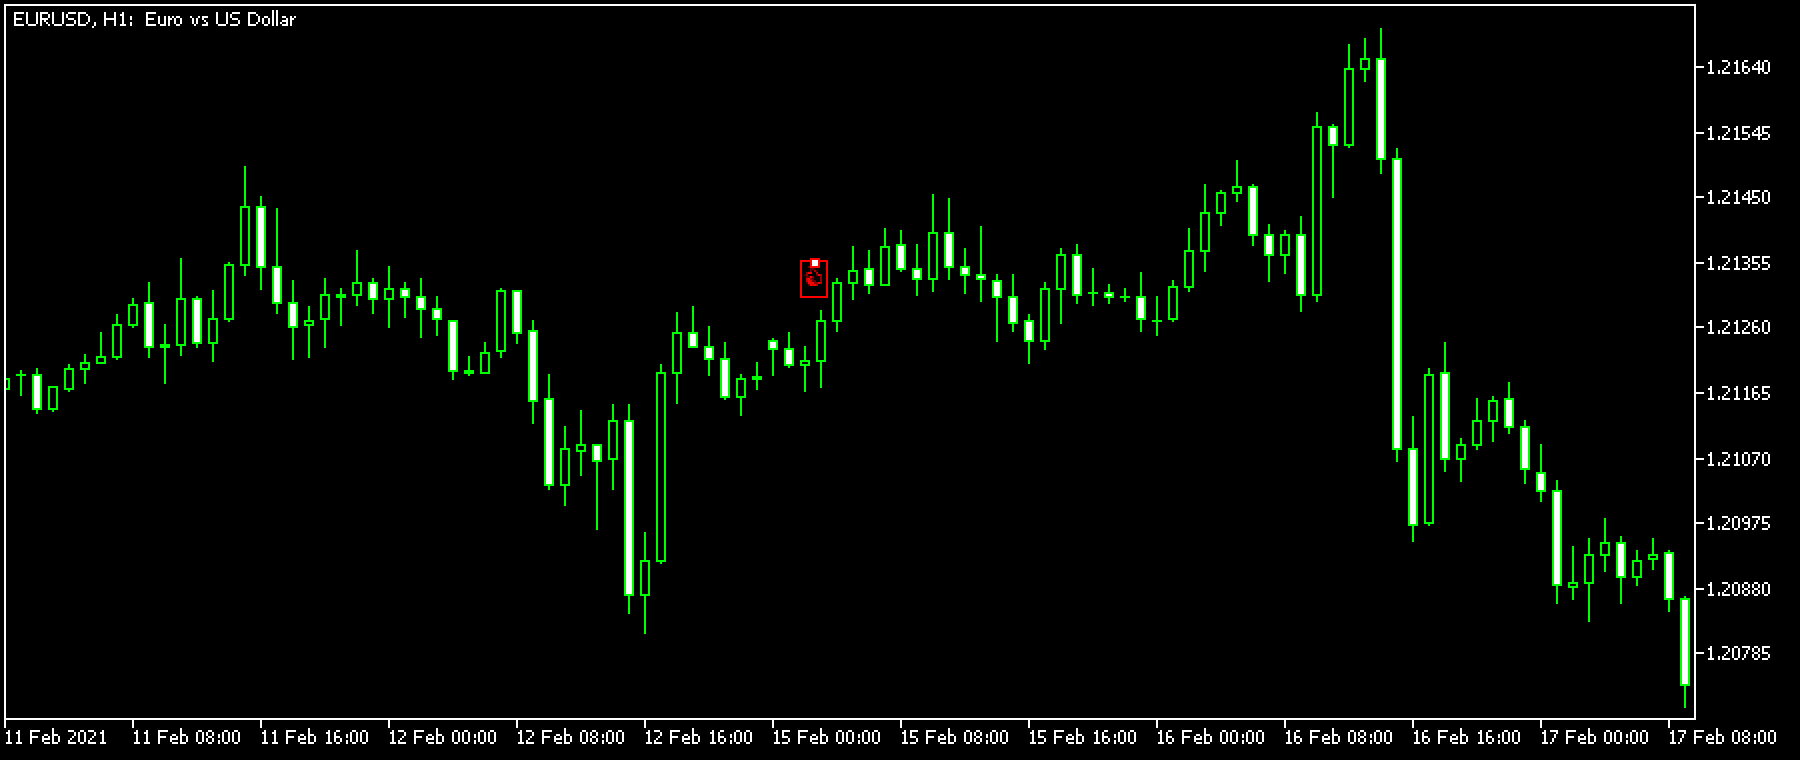
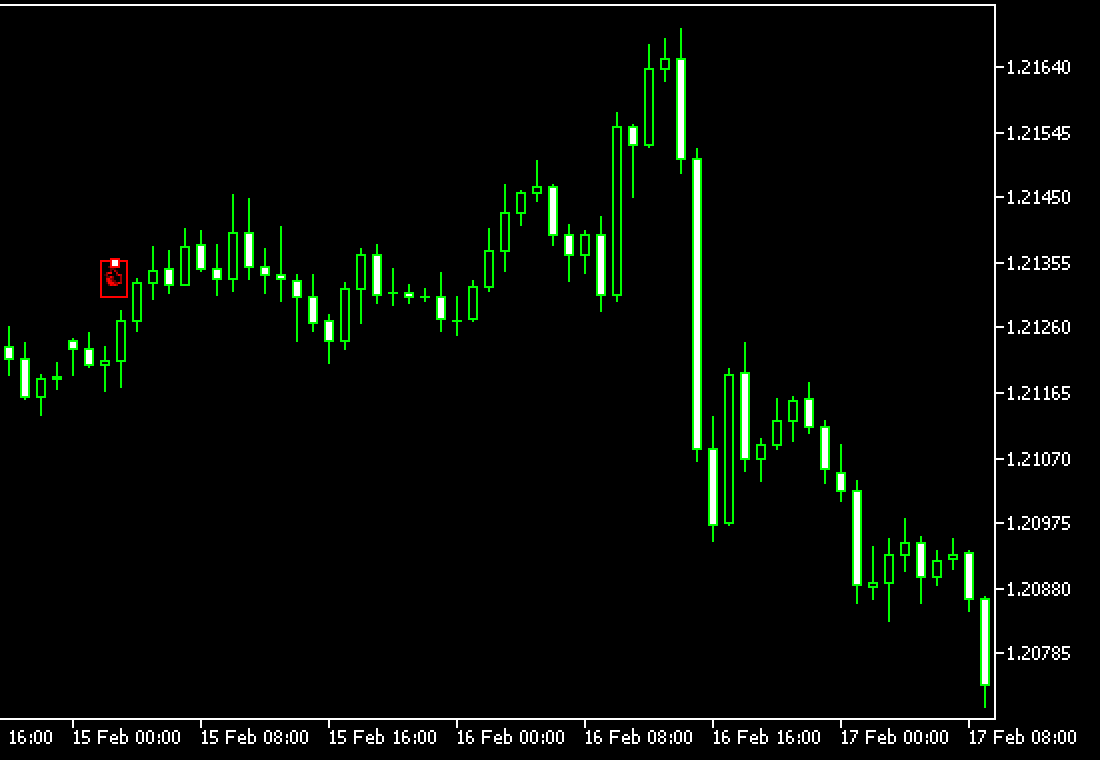
Click where you want to place the object on the chart. If you want to adjust the position of the object, make sure a white dot is being displayed on the object and move it as necessary. If you cannot see the white dot, double-click near the object to display it.
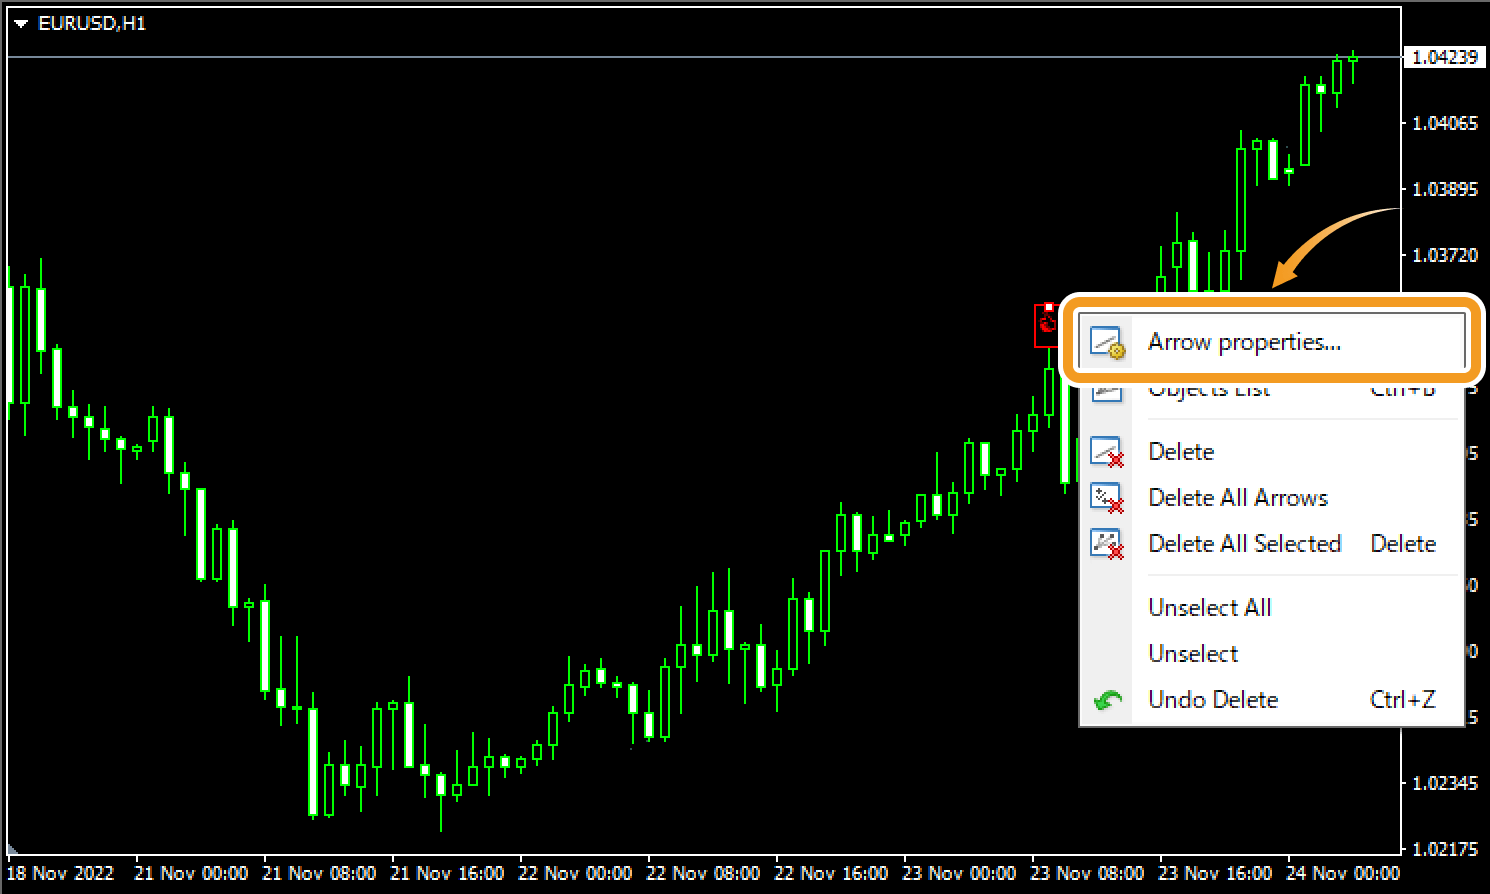
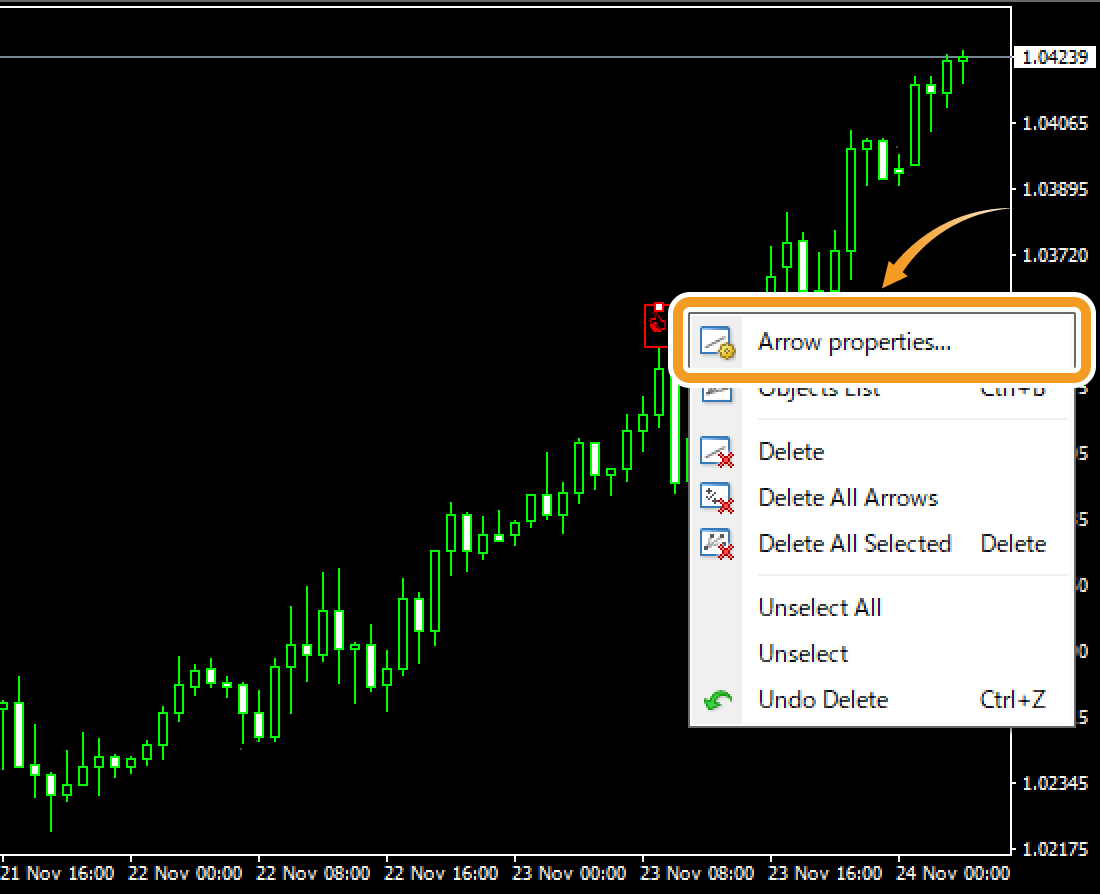
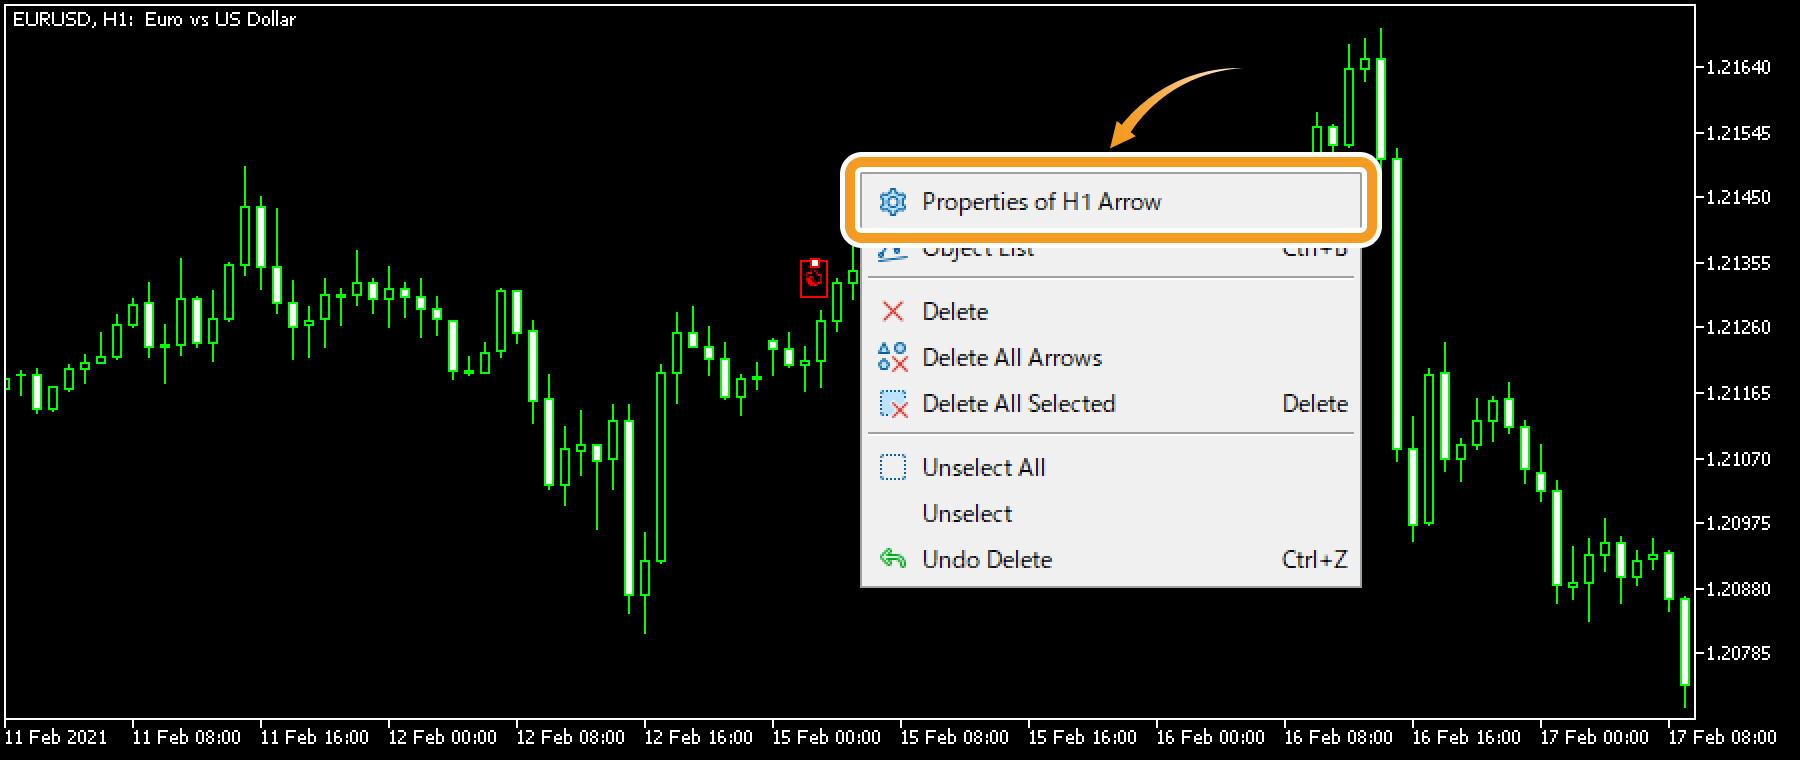
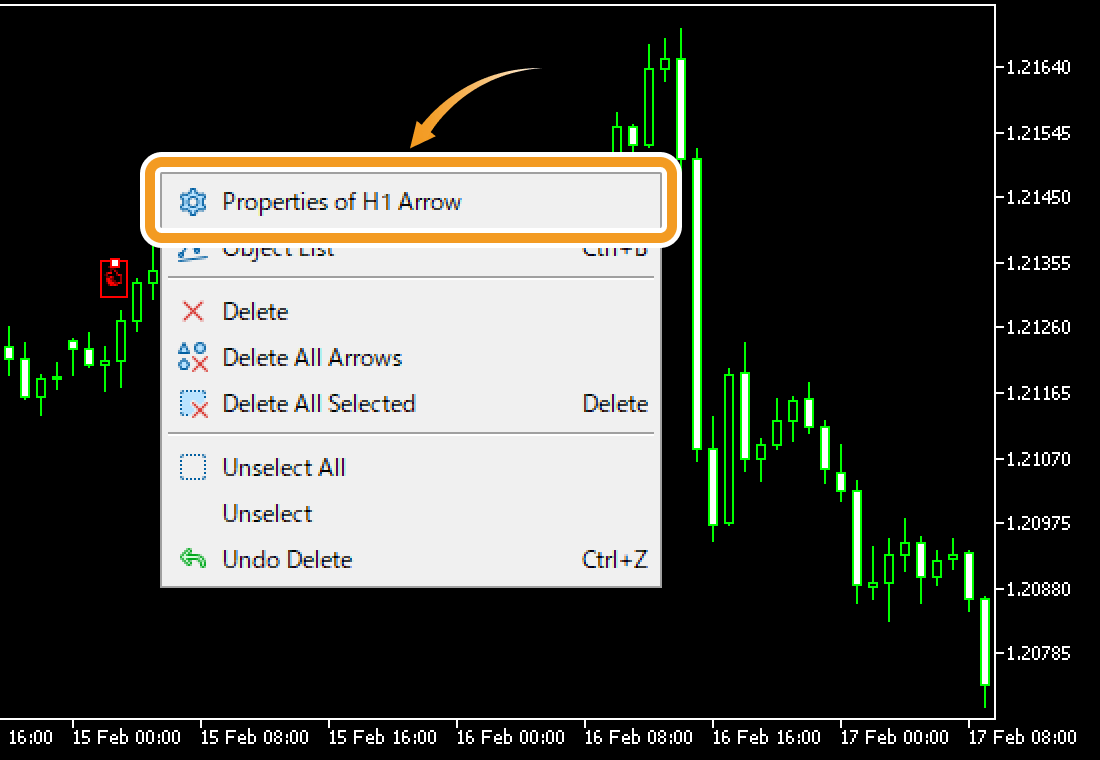
To modify the object settings, right-click near the object and select "(object name) properties...".
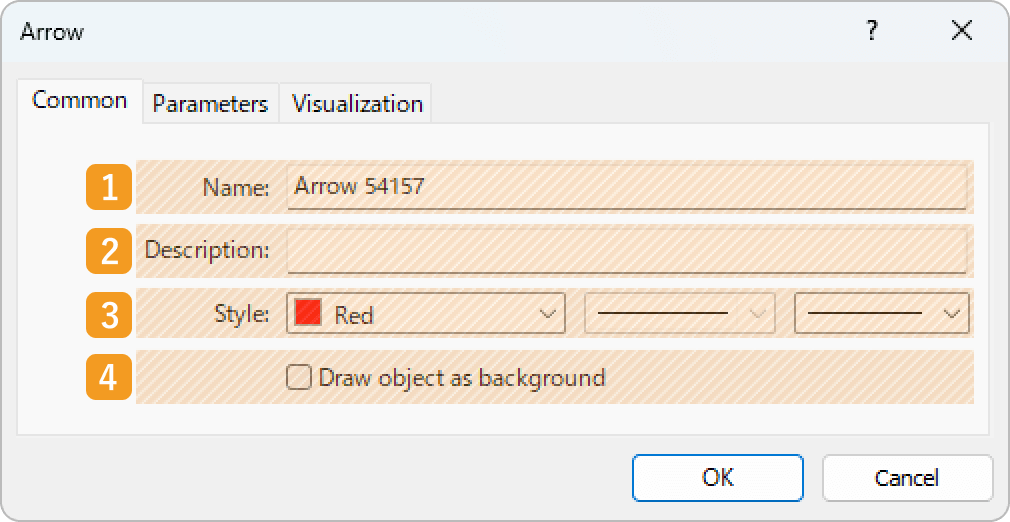
On the "Properties" window, edit the parameters in the "Common", "Parameters", and "Visualization" tabs and click "OK".
|
Number |
Item name |
Descriptions |
|---|---|---|
|
1 |
Name |
Name the object. |
|
2 |
Description |
The description of the object can be displayed on the chart. Related article: Show or hide items on chart |
|
3 |
Style |
Set the color, line type, and line thickness for the object. |
|
4 |
Draw object as background |
Check this box if you want to place the object behind the chart. |
|
Number |
Item name |
Descriptions |
|---|---|---|
|
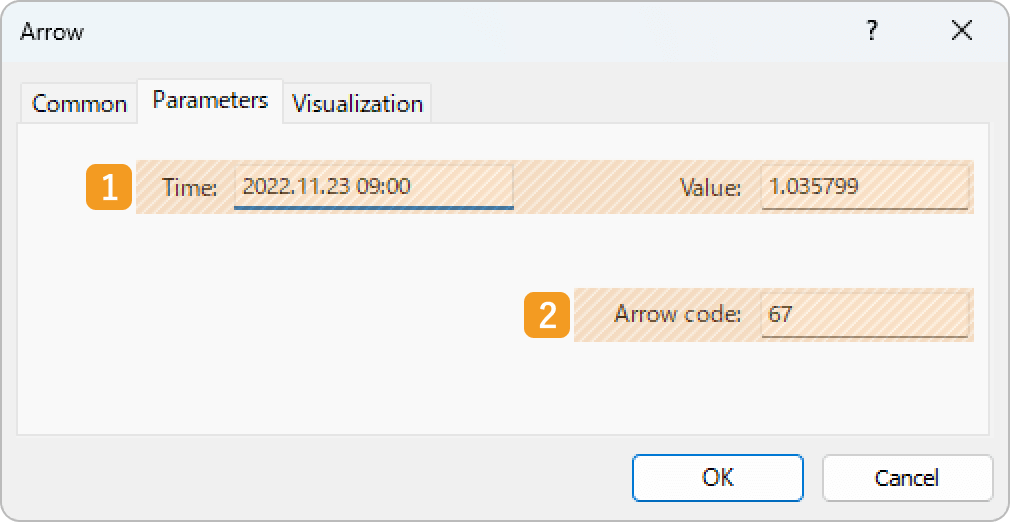
1 |
Date |
Specify the object position by date, time, and price. |
|
2 |
Arrow code |
Select from 224 objects by typing a code between 32 and 255.
Related article: List of arrow codes
|
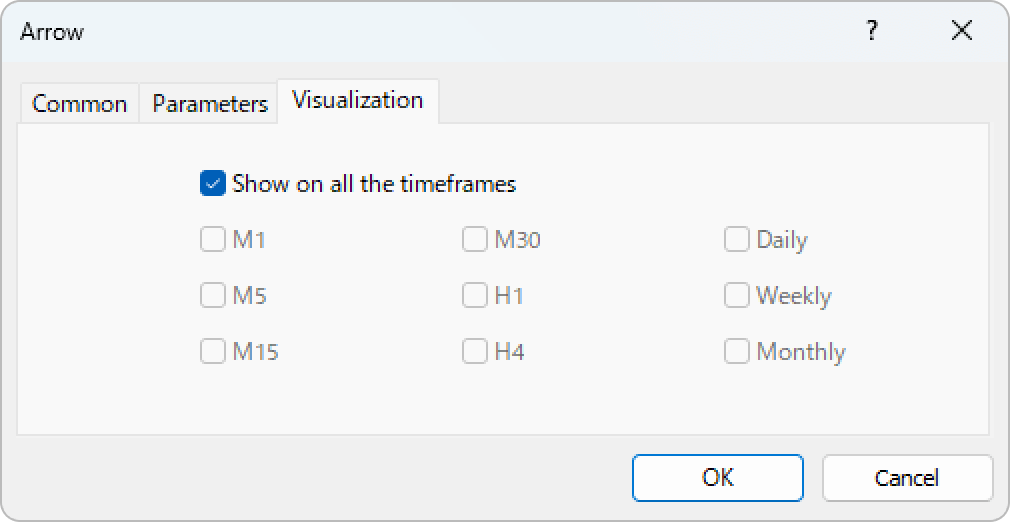
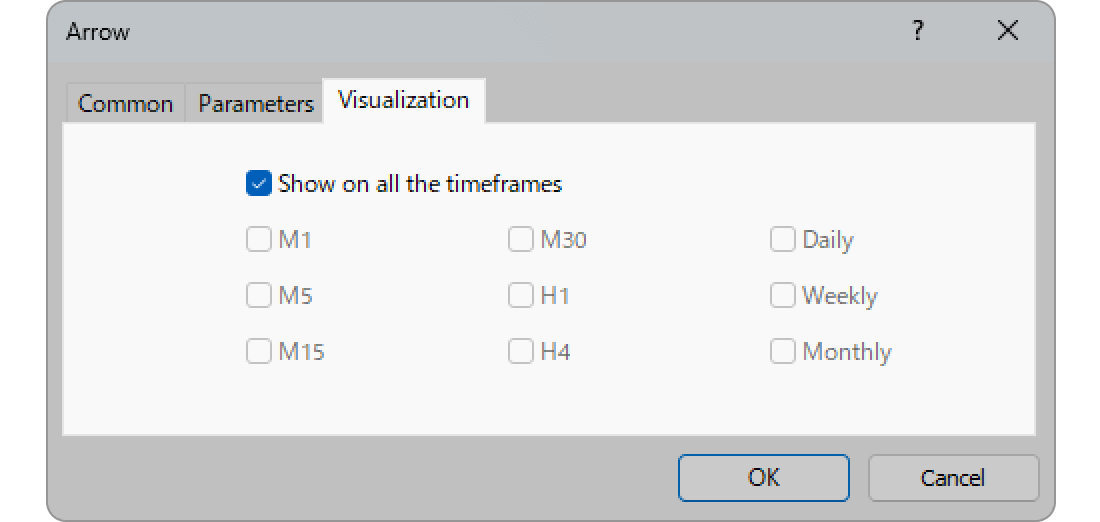
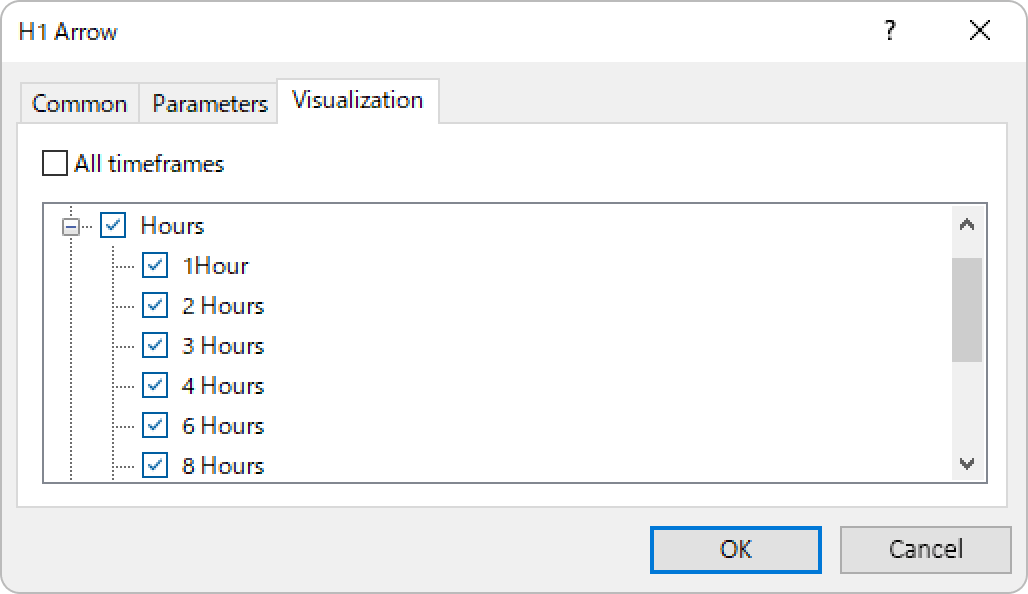
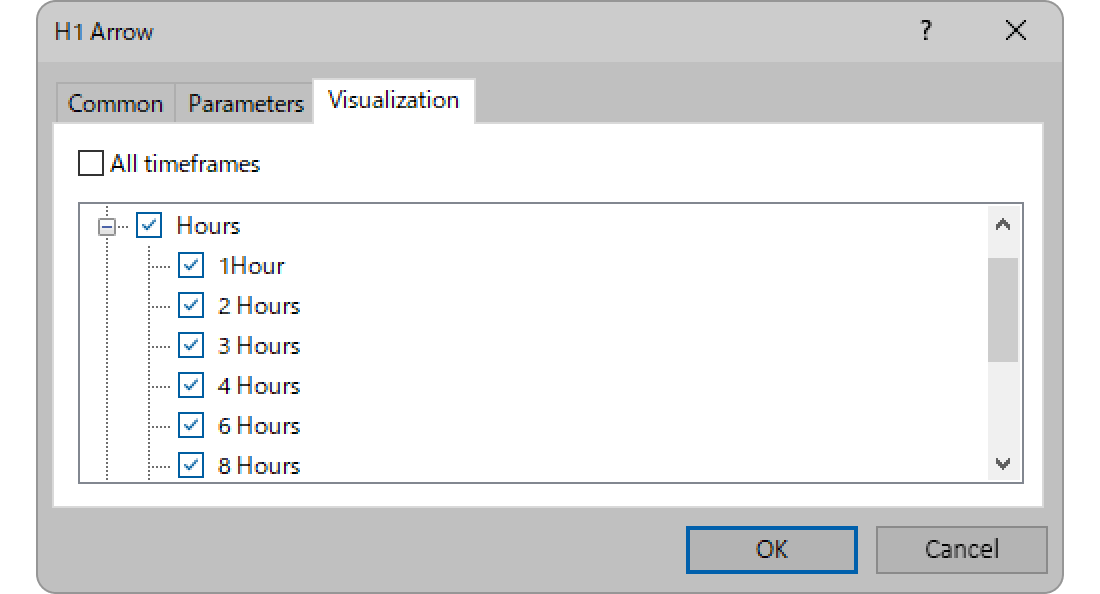
On the "Visualization" tab, you can specify the timeframes to use the object with.
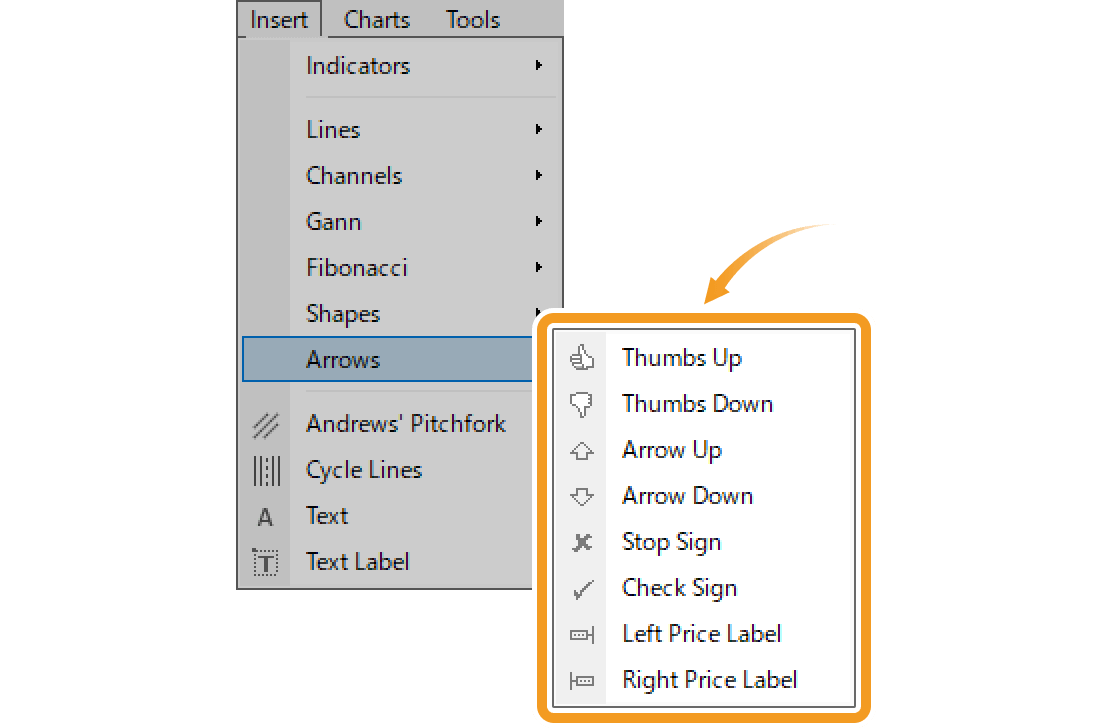
Click "Insert" in the menu. Hover the pointer over "Objects" > "Arrows" and select an object.
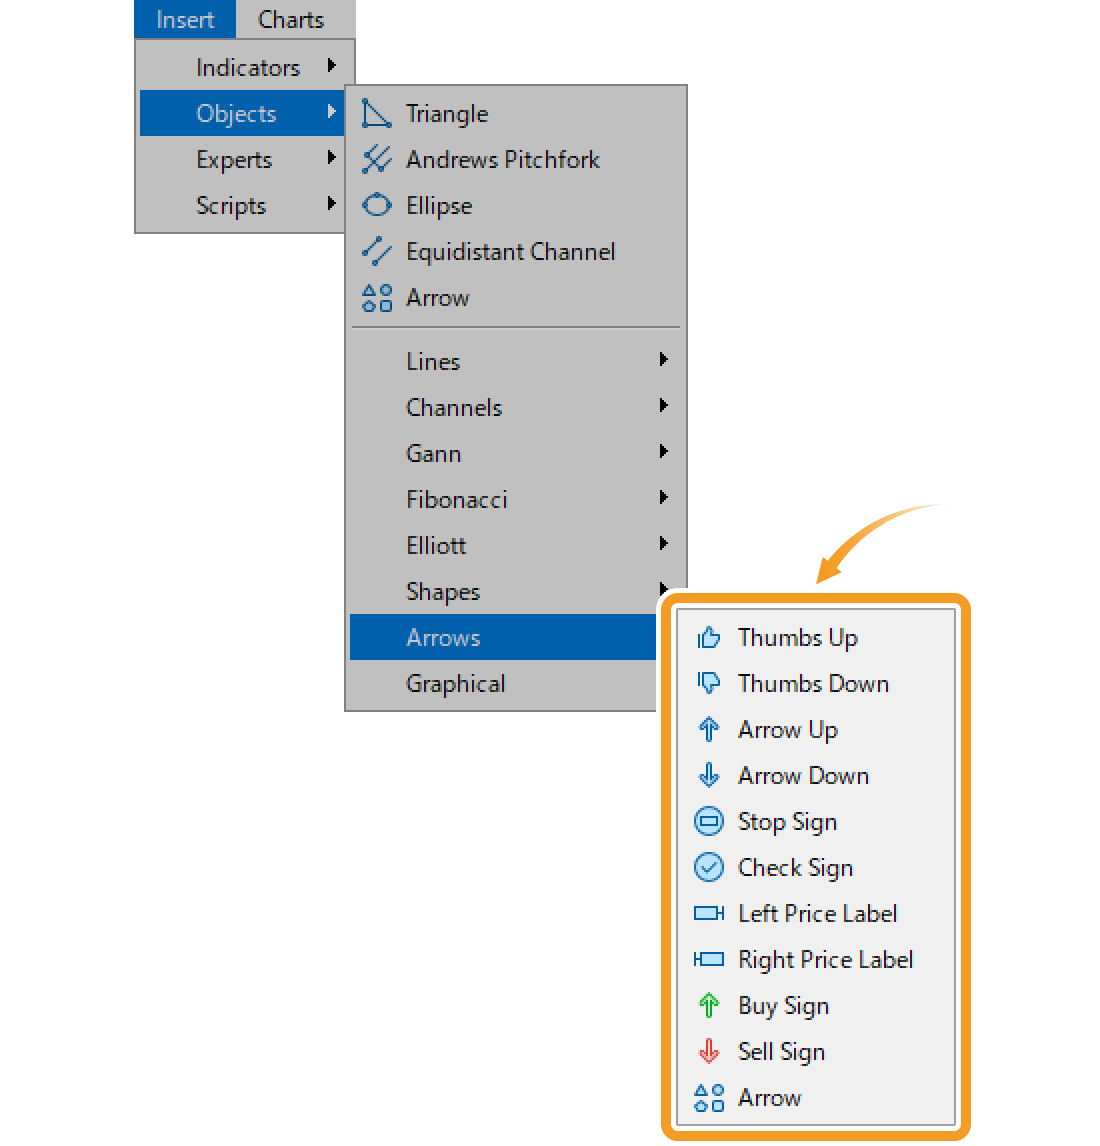
Thumbs Up/Down

Highlight a specific part of the chart with a thumbs-up/thumbs-down object.
Up/Down Arrow
Highlight a specific part of the chart with an upward/downward arrow.
Stop/Check Sign

Highlight a specific part of the chart with an X mark or check mark.
Left/Right Price Label

Show a price using a price label on the left/right side.
Buy/Sell Sign

Draw a blue upward arrow or a red downward arrow to indicate a buy/sell sign.
Click where you want to place the object on the chart. If you want to adjust the position of the object, make sure a white dot is being displayed on the object and move it as necessary. If you cannot see the white dot, double-click near the object to display it.
To modify the object settings, right-click near the object and select "Properties of (object name)".
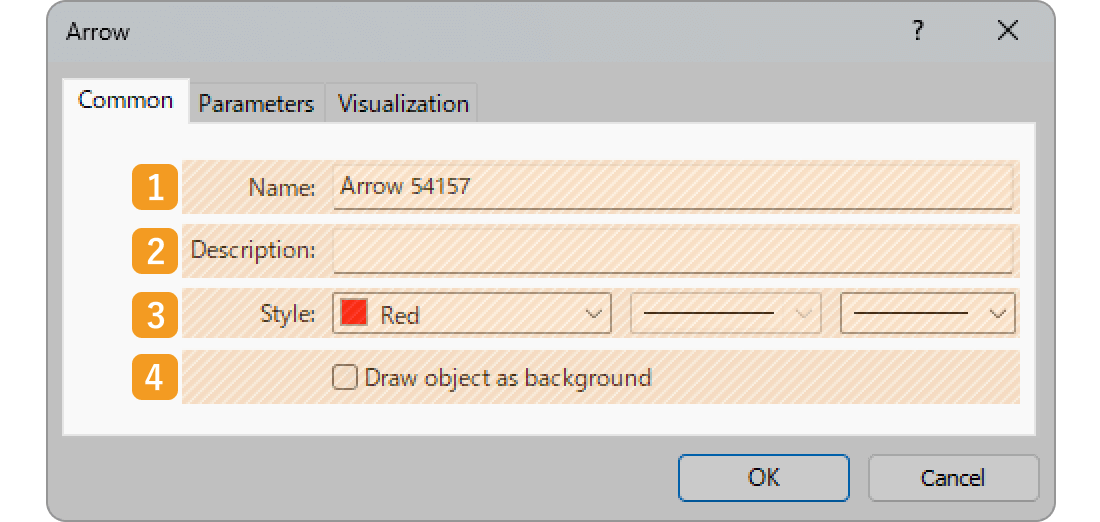
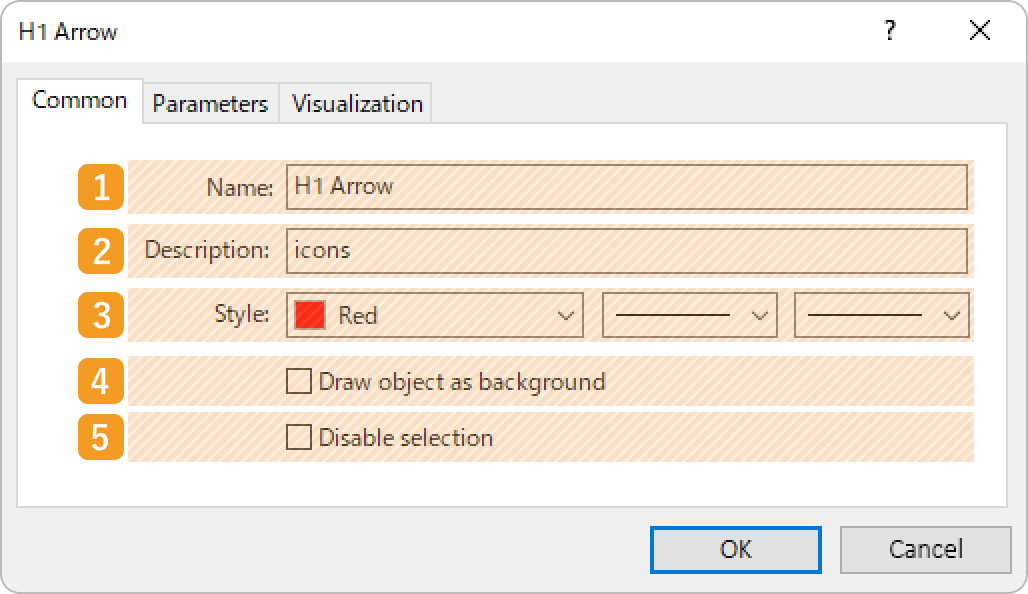
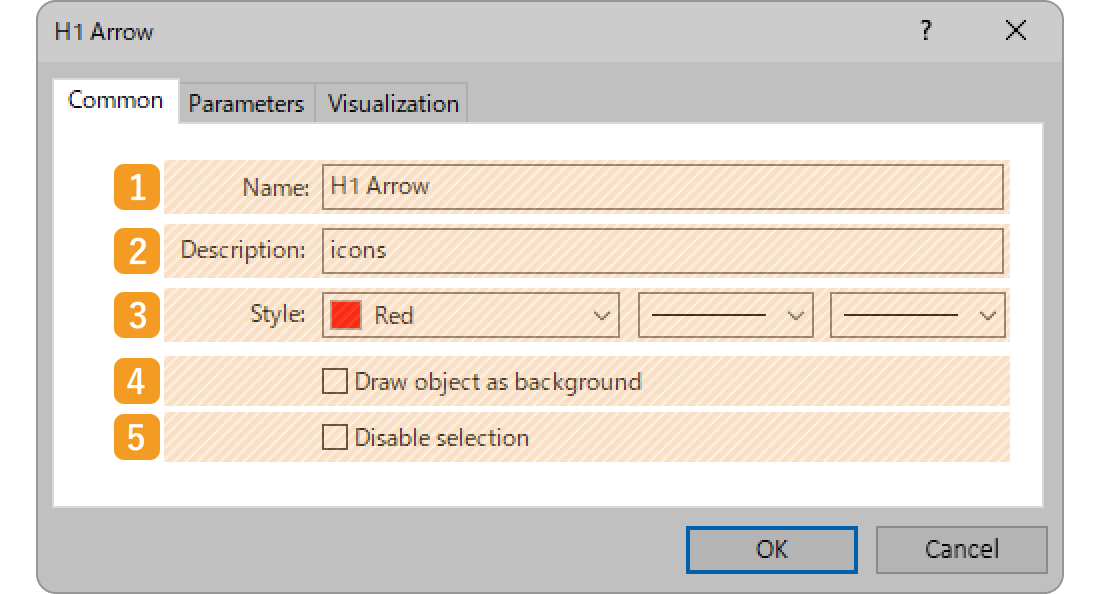
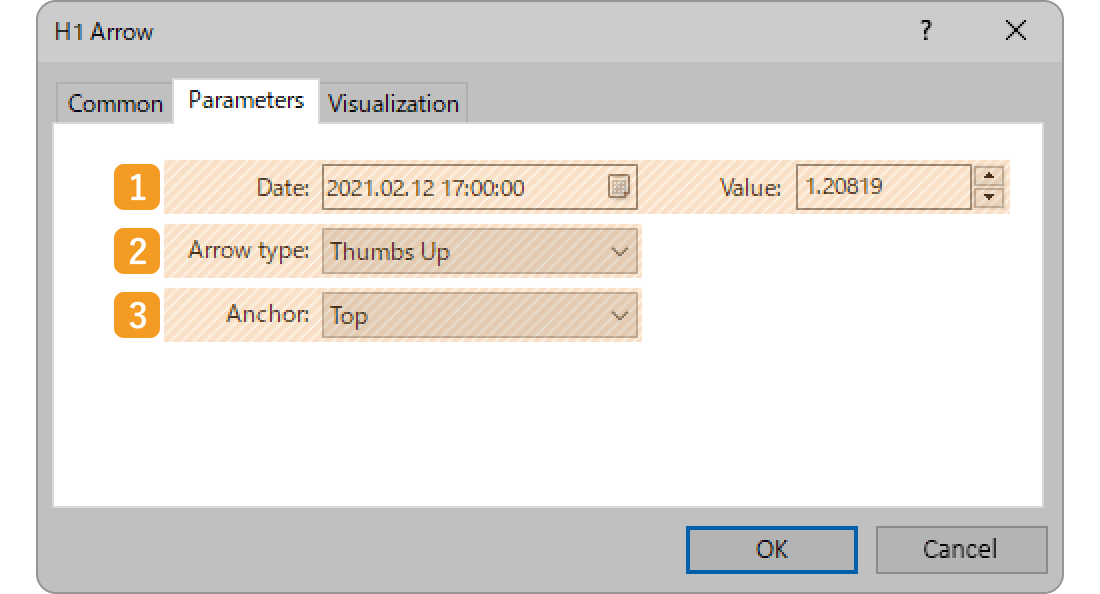
On the "Properties" window, edit the parameters in the "Common", "Parameters", and "Visualization" tabs and click "OK".
|
Number |
Item name |
Descriptions |
|---|---|---|
|
1 |
Name |
Name the object. |
|
2 |
Description |
The description of the object can be displayed on the chart. Related article: Show or hide items on chart |
|
3 |
Style |
Set the color, line type, and line thickness for the object. |
|
4 |
Draw object |
Check this box if you want to place the object behind the chart. |
|
5 |
Disable selection |
Check this box if you want to disable the editing of the object. |
|
Number |
Item name |
Descriptions |
|---|---|---|
|
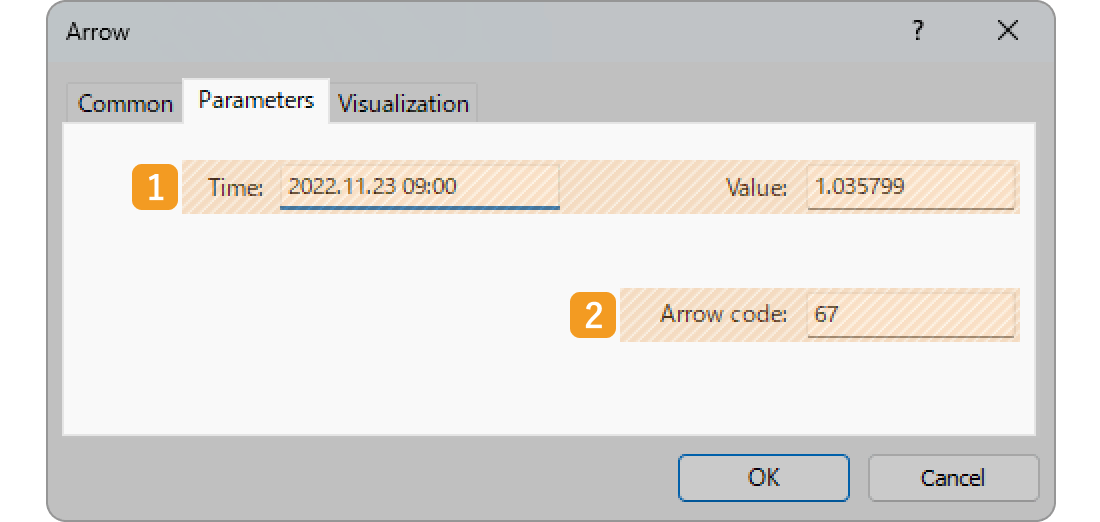
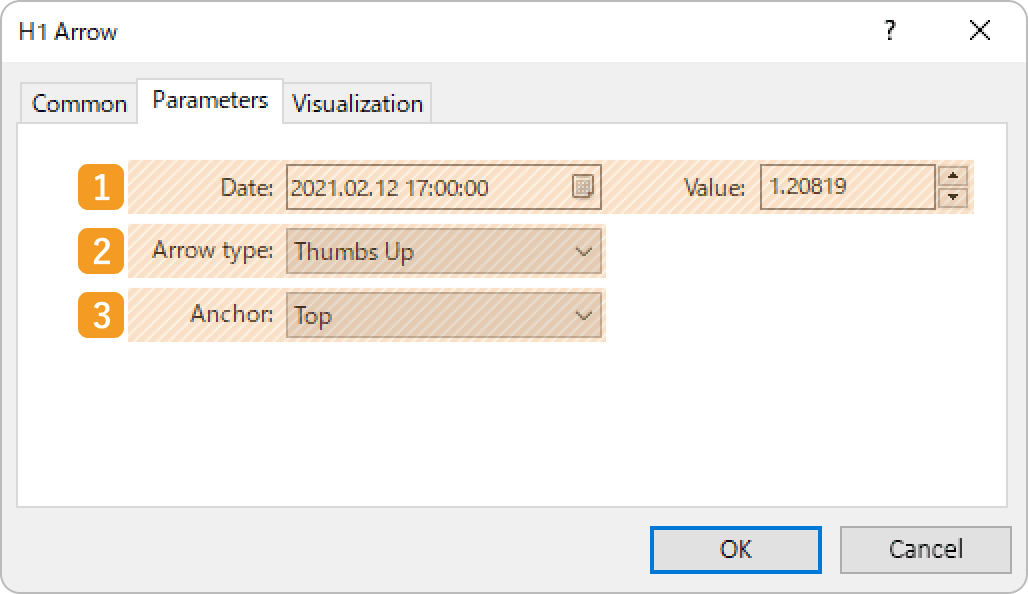
1 |
Date |
Specify the object position by date, time, and price. |
|
2 |
Arrow type |
Select the object type. Thumbs Up Thumbs Down Arrow Up: Upward arrow Arrow Down: Downward arrow Stop Sign Check Sign Left Price Label Right Price Label Buy: Buy sign Sell: Sell sign Other: Select from other objects |
|
3 |
Anchor |
Specify the position of white dots displayed when editing the object. |
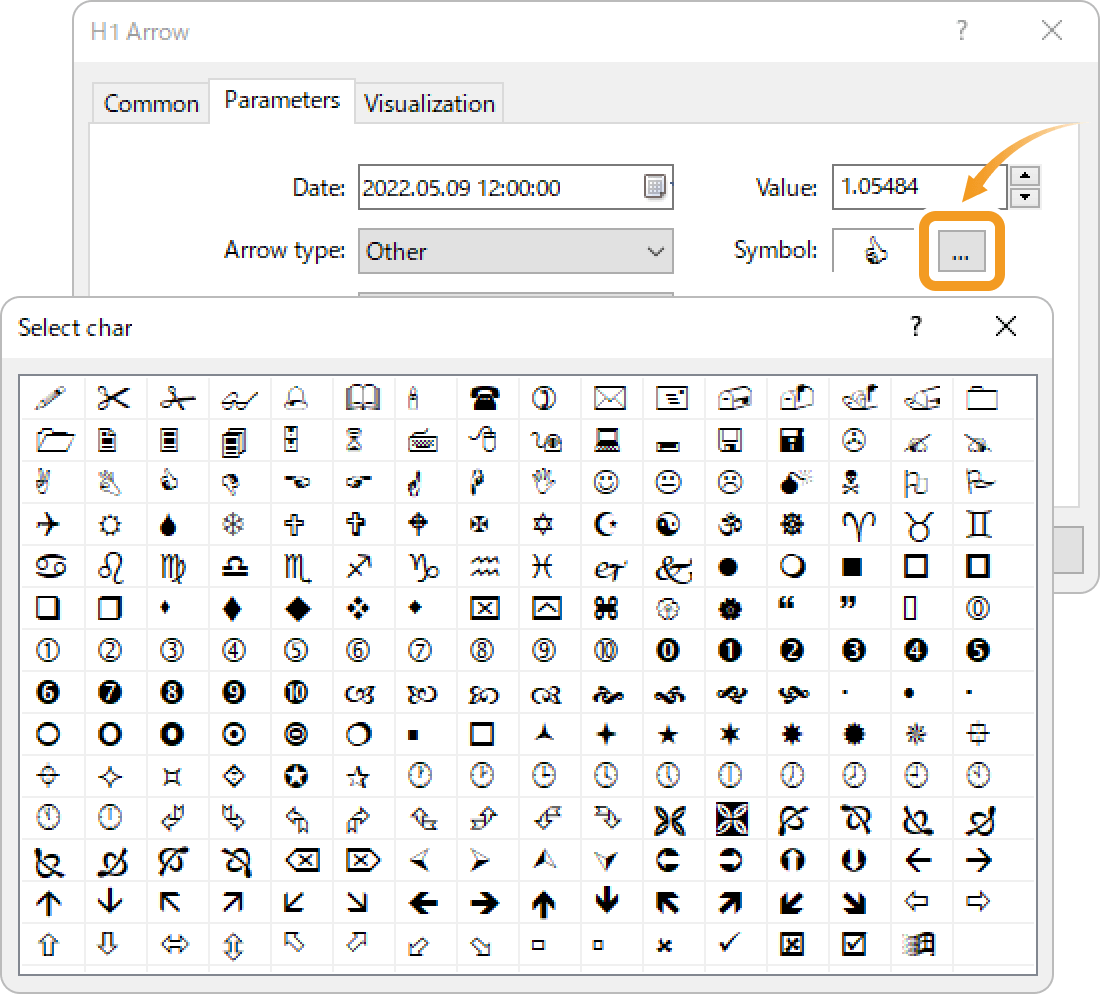
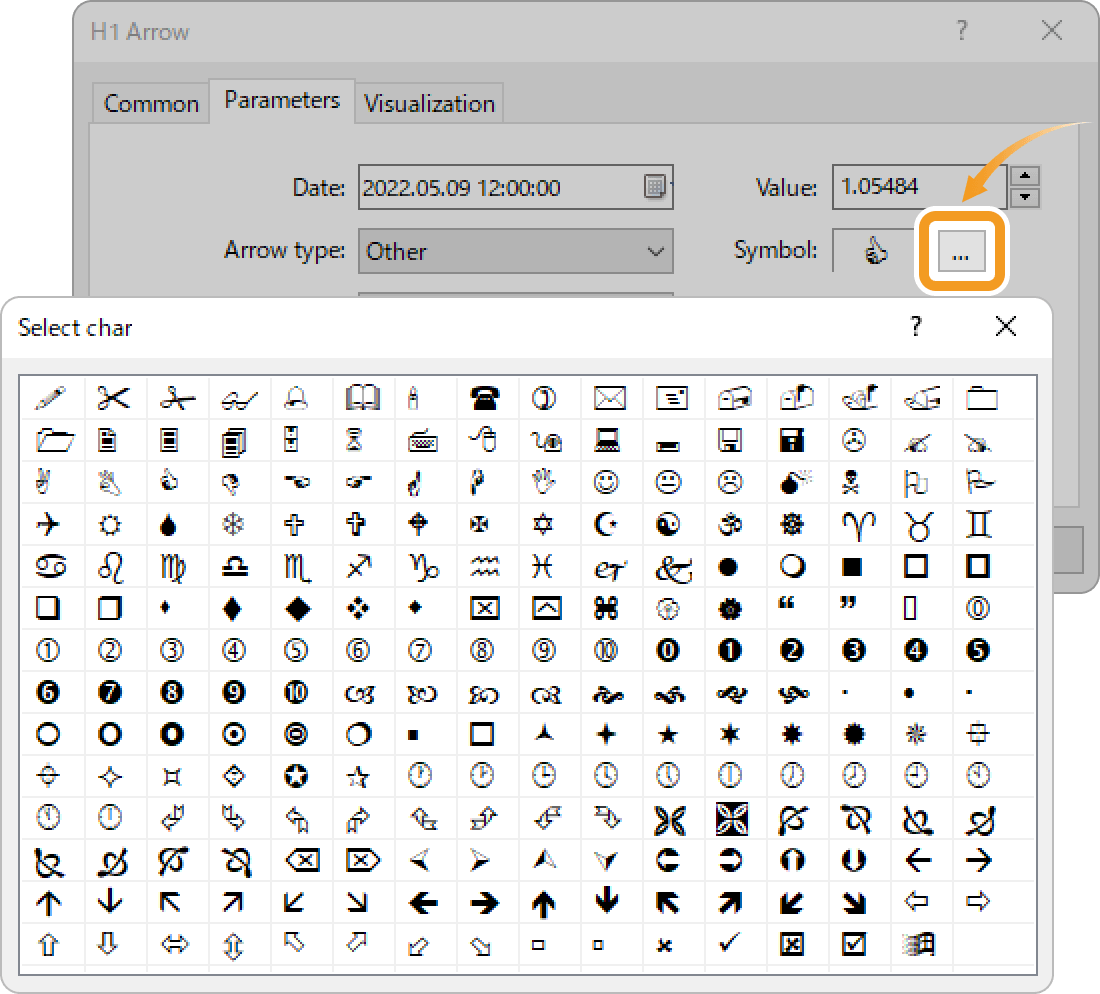
If you select "Other" for the "Arrow type", the "Symbol" field will appear with the "..." button. Click the "..." button and you can select a symbol from the list.
On the "Visualization" tab, you can specify the timeframes to use the object with.
Was this article helpful?
0 out of 0 people found this article helpful.
Thank you for your feedback.