Check your exposure
Accounts (PC)
Accounts (PC)

This article was :
published
updated
On MetaTrader4 (MT4) / MetaTrader5 (MT5), you can check your exposure (ratio of your assets vulnerable to price fluctuation risk). Check your portfolio by trade volume, ratio, and currency in the "Exposure" tab of the Terminal/Toolbox.
Here we will look at how to check your exposure on MT4/MT5.
Switch between MT4/MT5 tabs to check the steps for each.
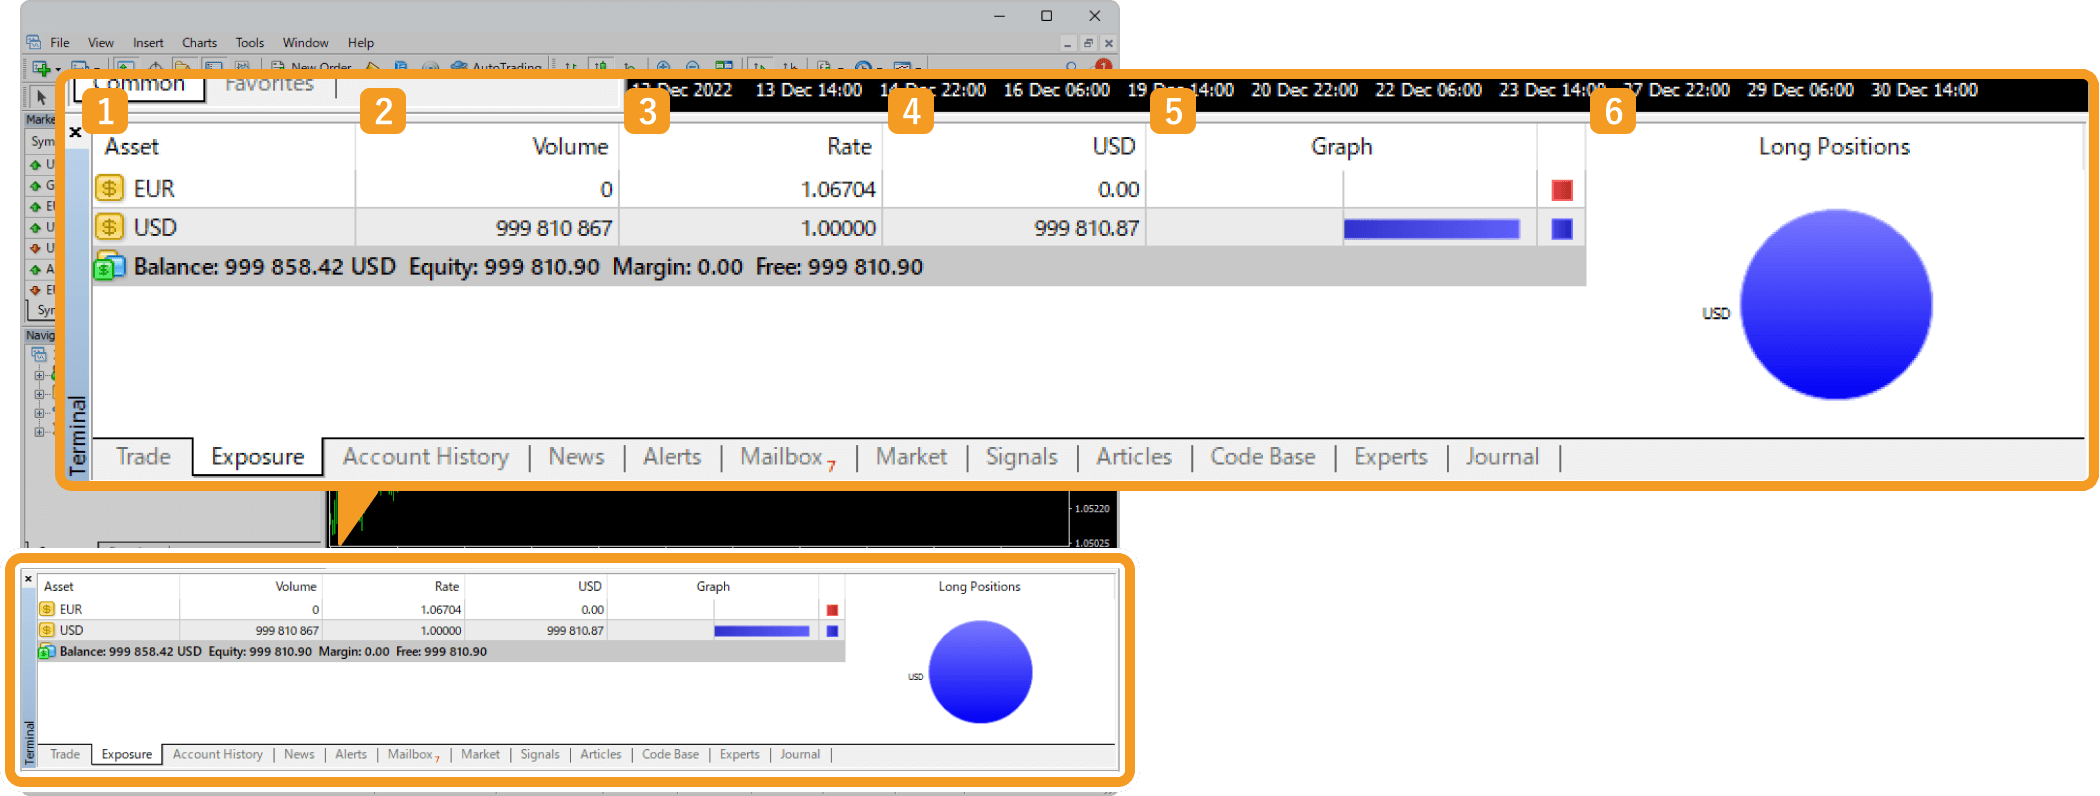
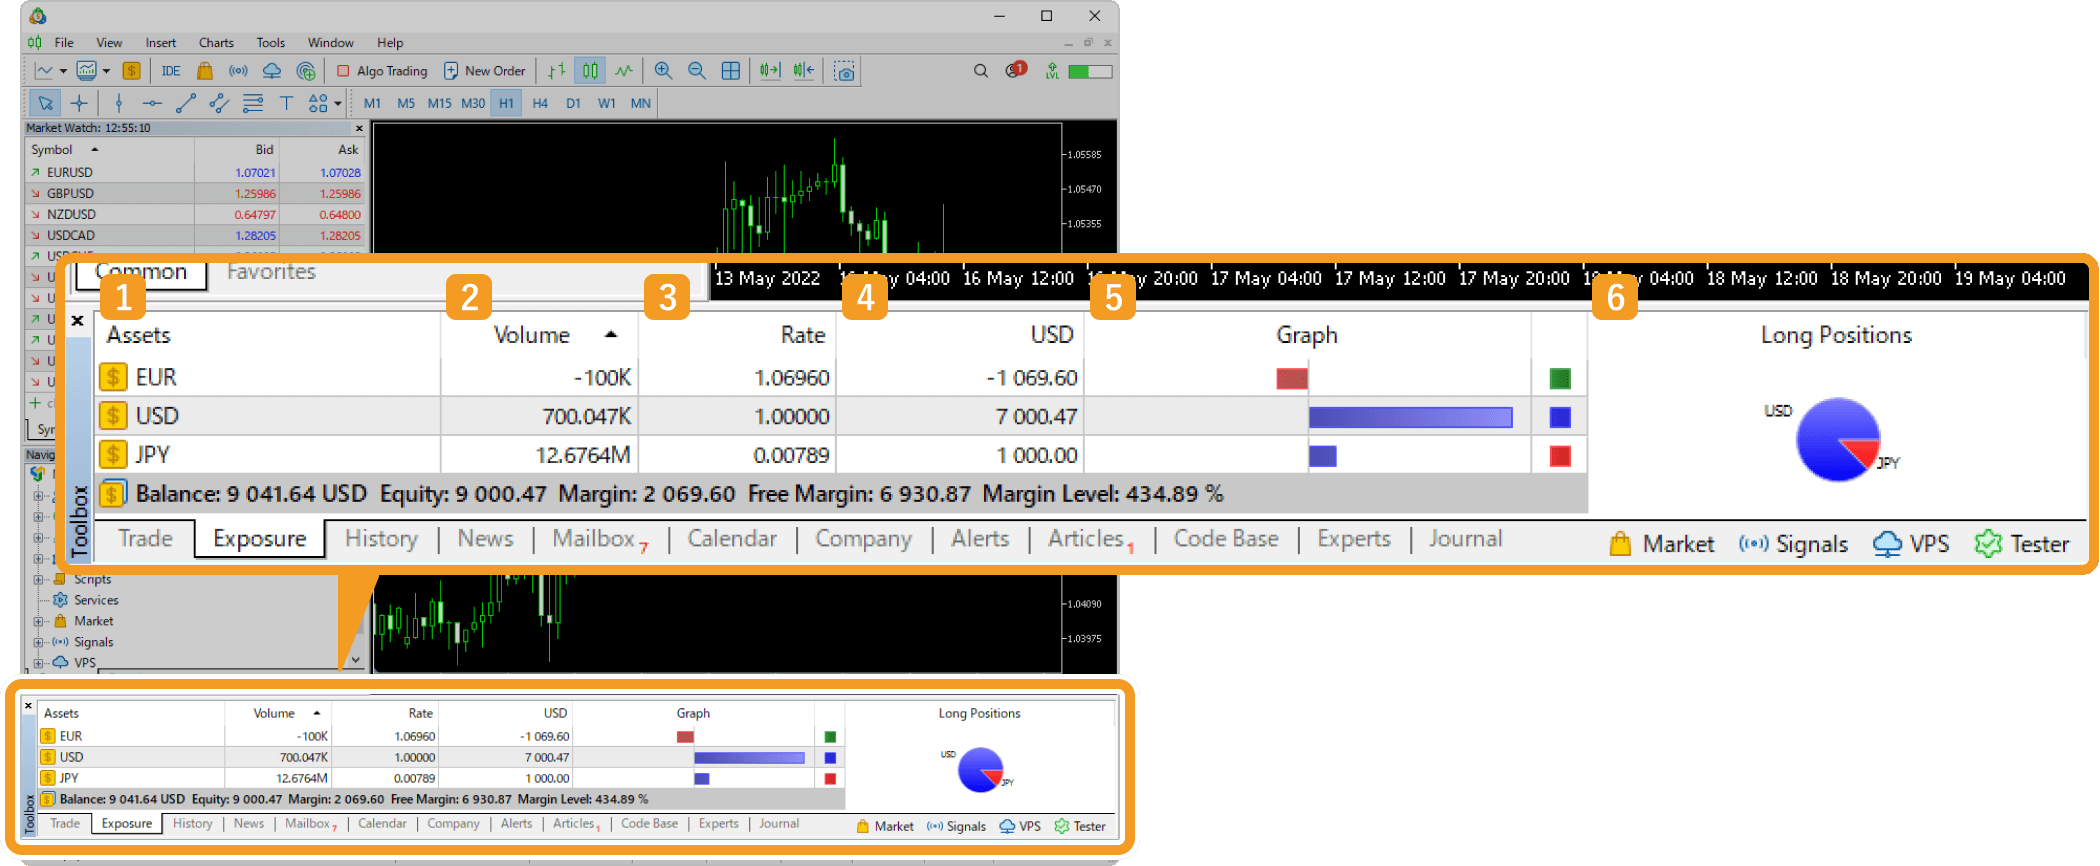
Click the "Exposure" tab in the Terminal. You can check your current exposure.
|
Number |
Item name |
Descriptions |
|---|---|---|
|
1 |
Asset |
The asset you are holding. |
|
2 |
Volume |
Trade volume in the base currency. |
|
3 |
Rate |
Rate of the asset to the currency of the account. |
|
4 |
Currency |
Amount of the asset exposed to fluctuation risk, expressed in the account's currency. |
|
5 |
Graph |
Amount of the asset exposed to fluctuation risk is shown as bar graphs in blue for long positions and in red for short positions. |
|
6 |
Pie chart |
Amount of the asset exposed to fluctuation risk is shown as a pie chart. It can be displayed in long or short positions. |
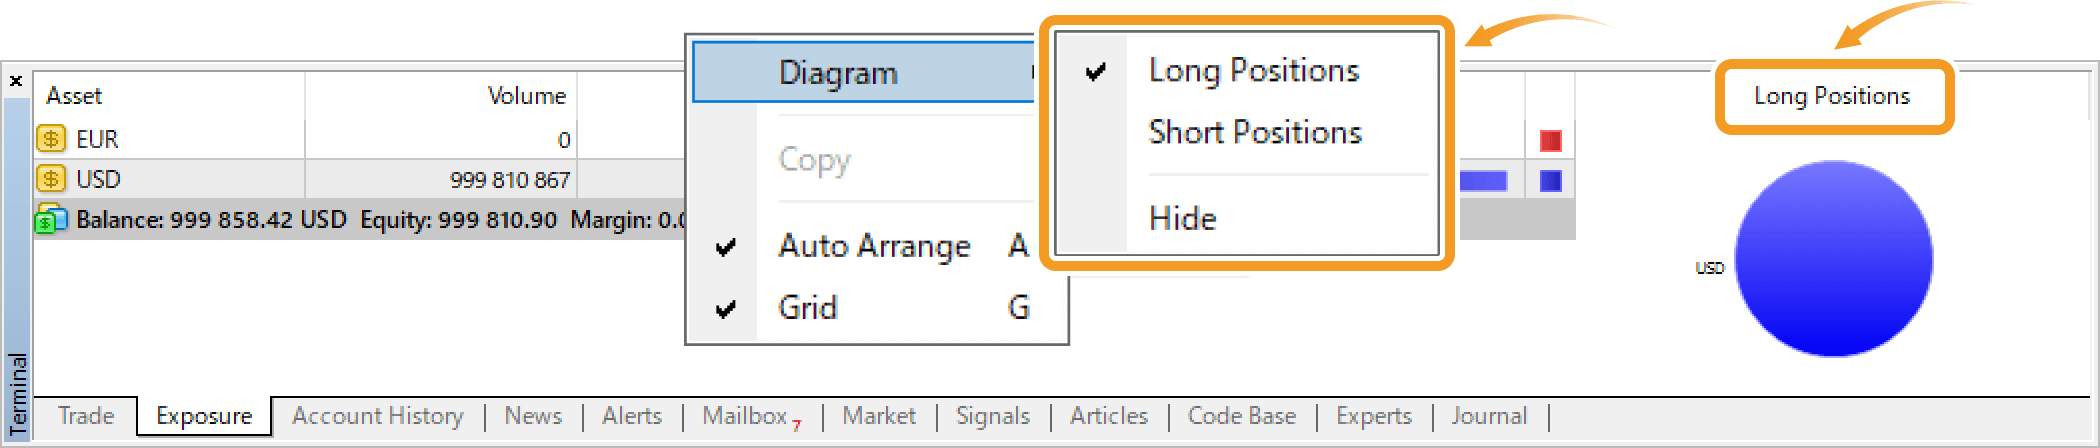
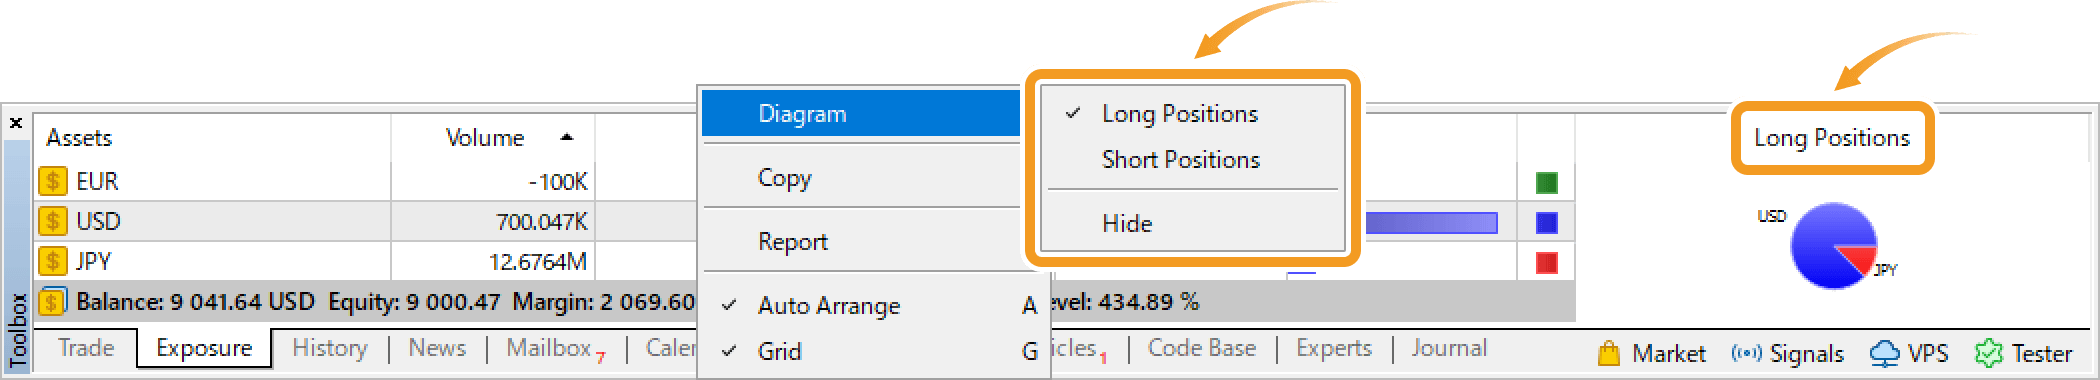
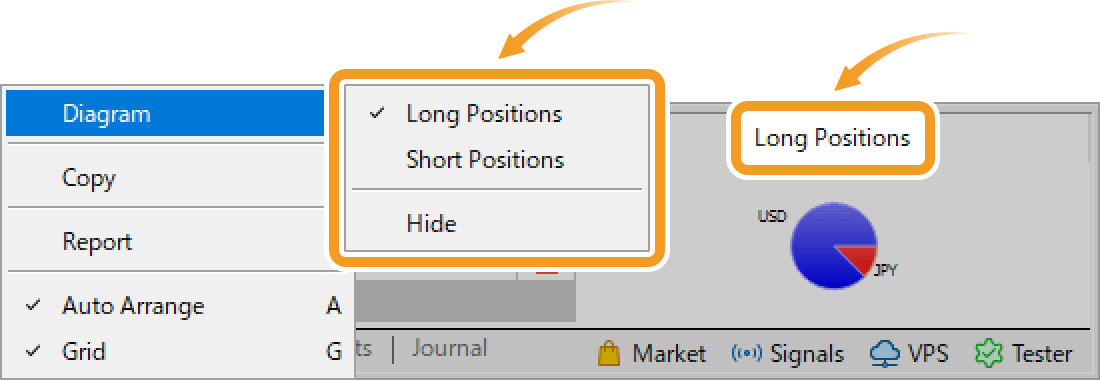
To switch the pie chart between long and short positions, right-click in the Toolbox, hover the pointer over "Diagram", and select the position you wish to show. To hide the chart, select "Hide".
You can also switch between them by clicking the "Long Positions" label above the chart.
The option to export exposure reports is a new feature on MT5. On MT4, the report can't be exported.
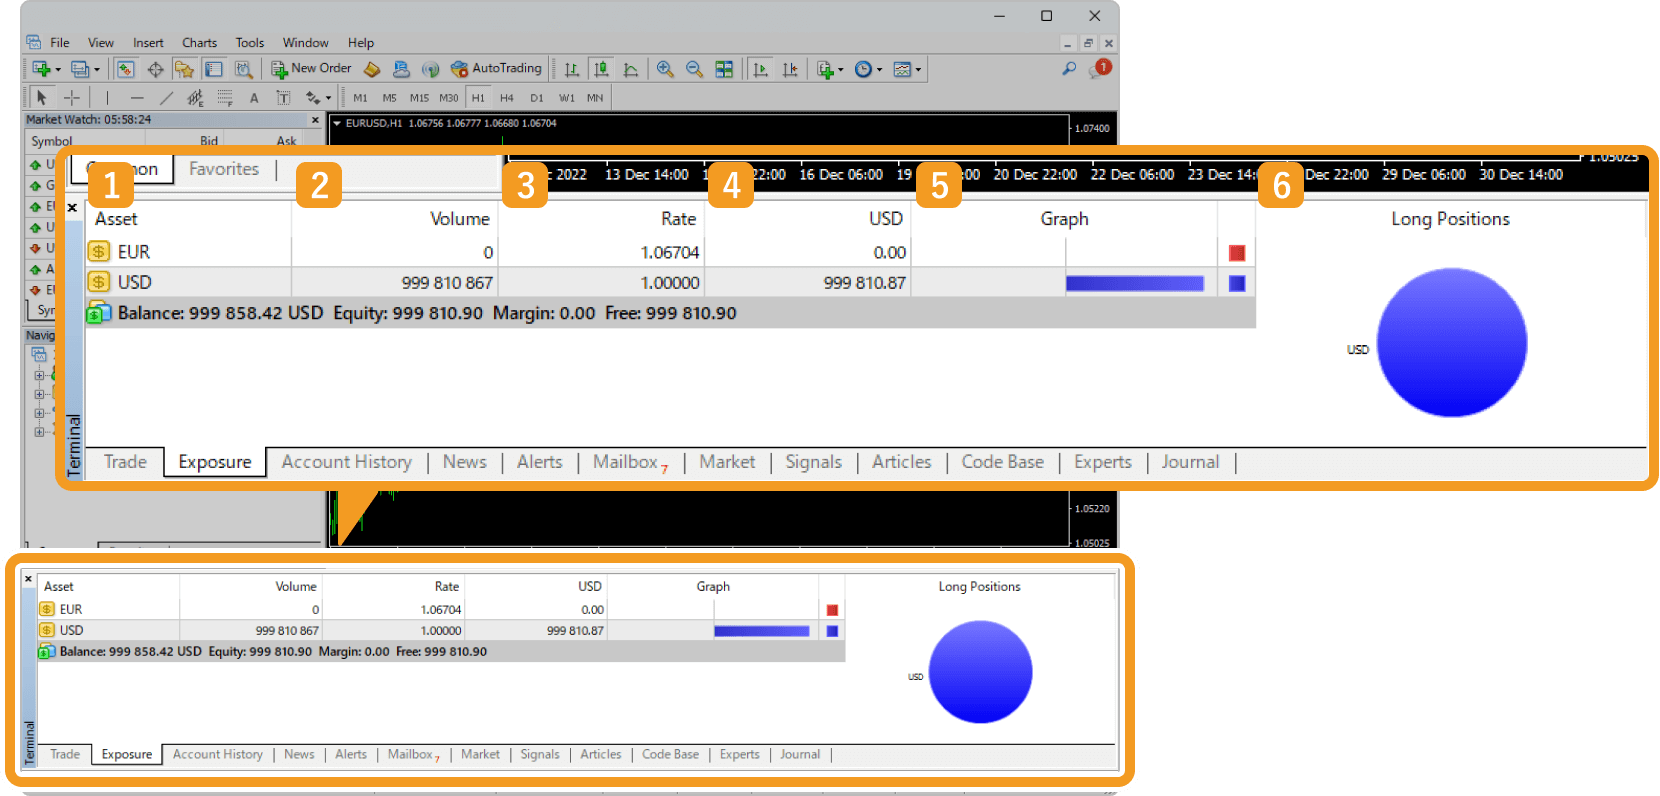
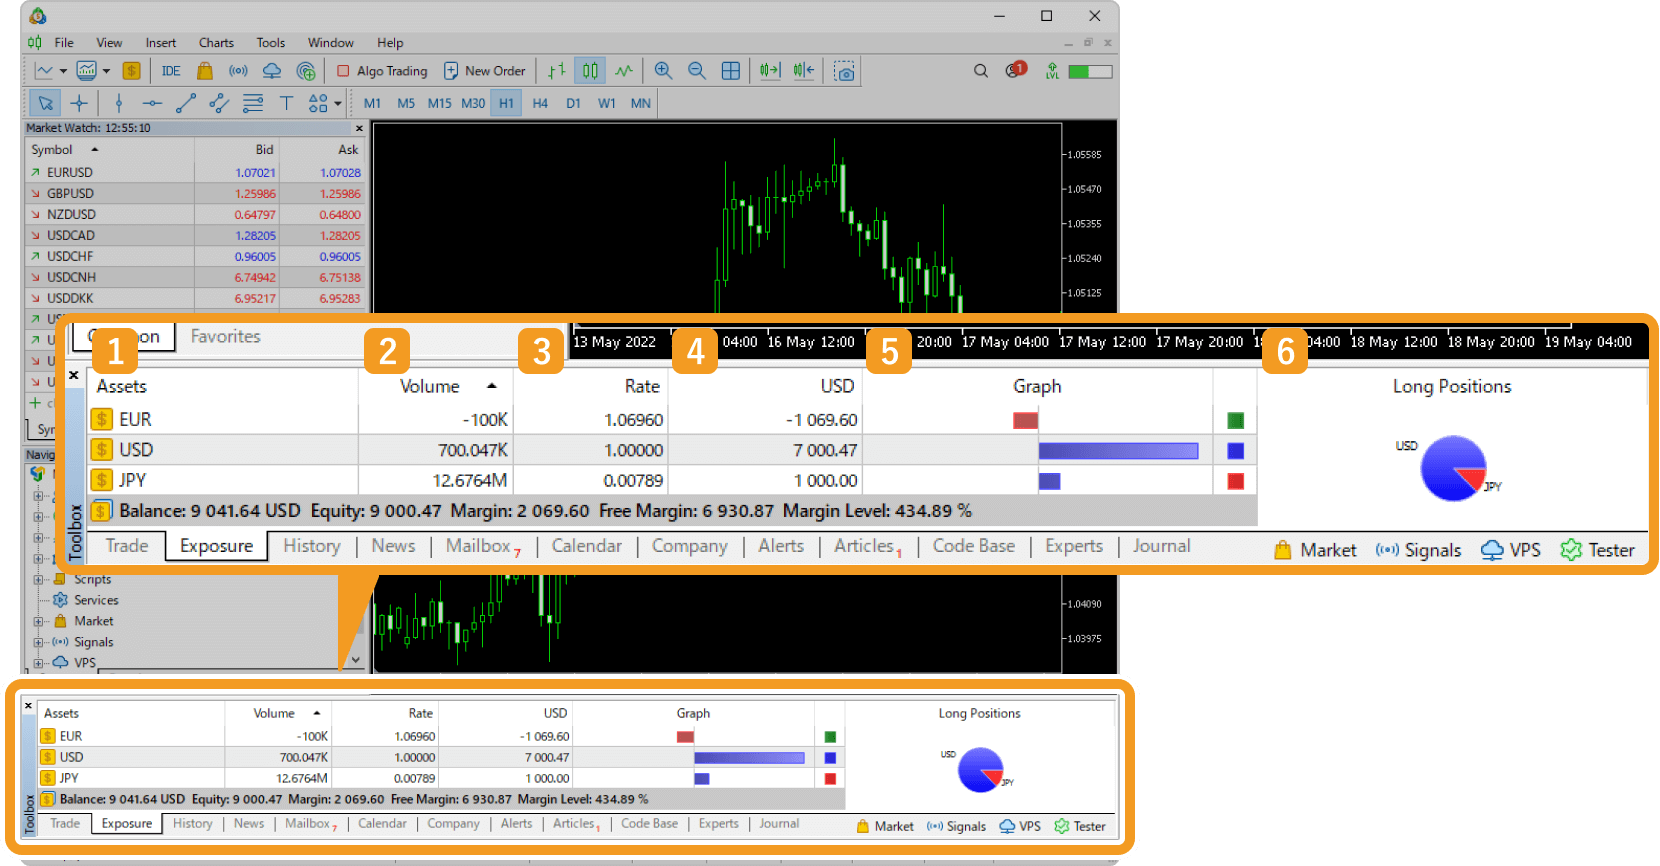
Click the "Exposure" tab in the Toolbox. You can check your current exposure.
|
Number |
Item name |
Descriptions |
|---|---|---|
|
1 |
Assets |
Assets you are holding. |
|
2 |
Volume |
Trade volume in the base currency. |
|
3 |
Rate |
Rate of the asset to the currency of the account. |
|
4 |
Currency |
Amount of the asset exposed to fluctuation risk, expressed in the account's currency. |
|
5 |
Graph |
Amount of the asset exposed to fluctuation risk is shown as bar graphs in blue for long positions and in red for short positions. |
|
6 |
Pie chart |
Amount of the asset exposed to fluctuation risk is shown as a pie chart. It can be displayed in long or short positions. |
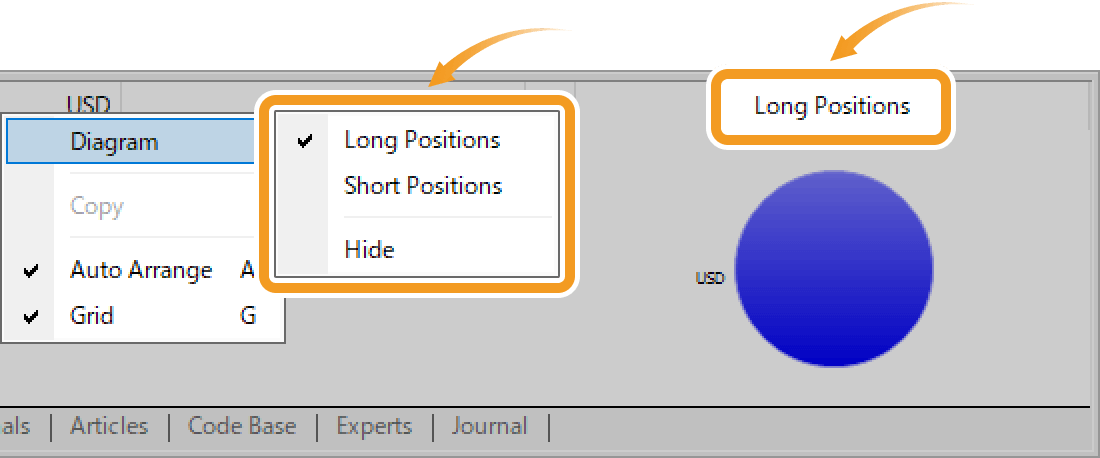
To switch the pie chart between long and short positions, right-click in the Toolbox, hover the pointer over "Diagram", and select the position you wish to show. To hide the chart, select "Hide".
You can also switch between them by clicking the "Long Positions" label above the chart.
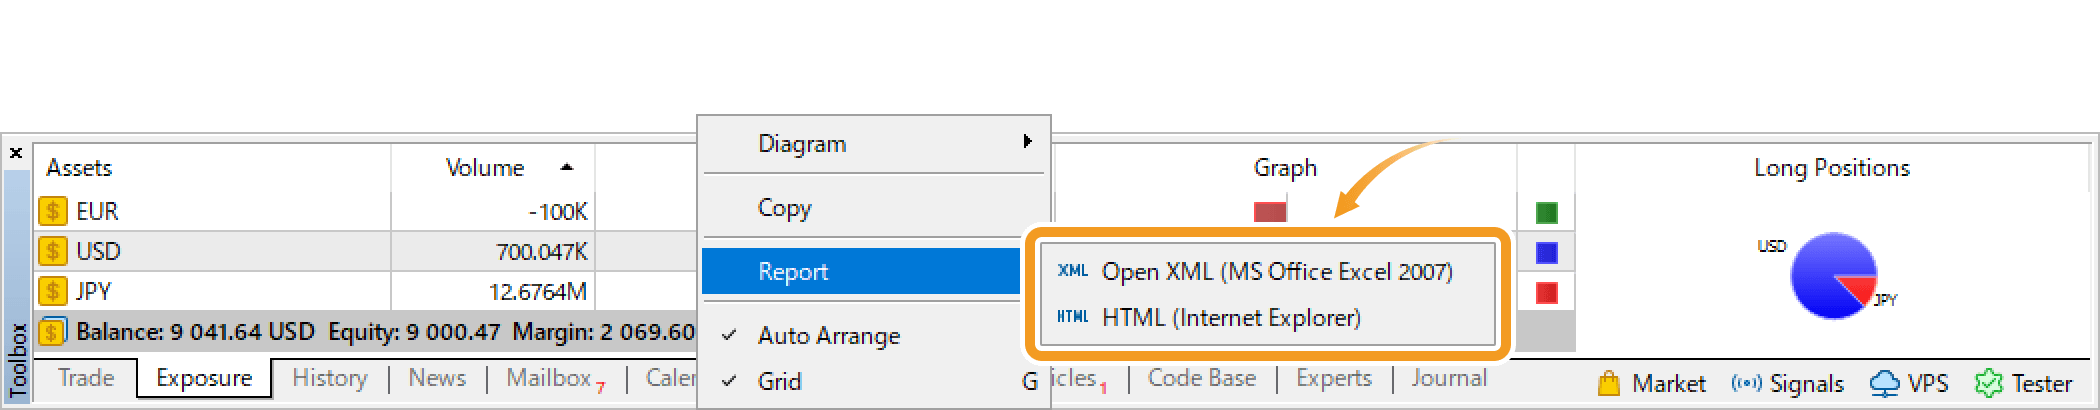
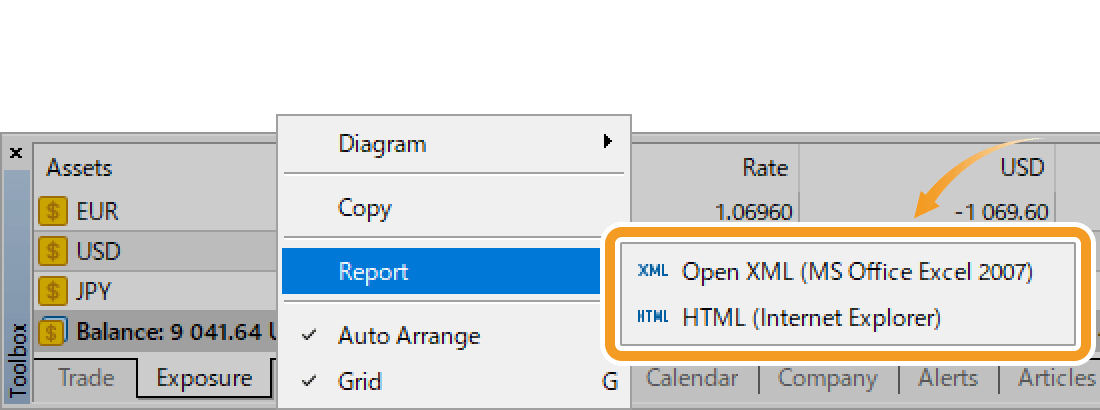
To create an exposure report, right-click in the toolbox, hover the pointer over "Report" and select the file format (HTML or XLSX).
Was this article helpful?
0 out of 0 people found this article helpful.
Thank you for your feedback.