MT4/MT5: Draw rectangle
EA, indicators & objects (Mobile & tablet)
EA, indicators & objects (Mobile & tablet)

This article was :
published
updated
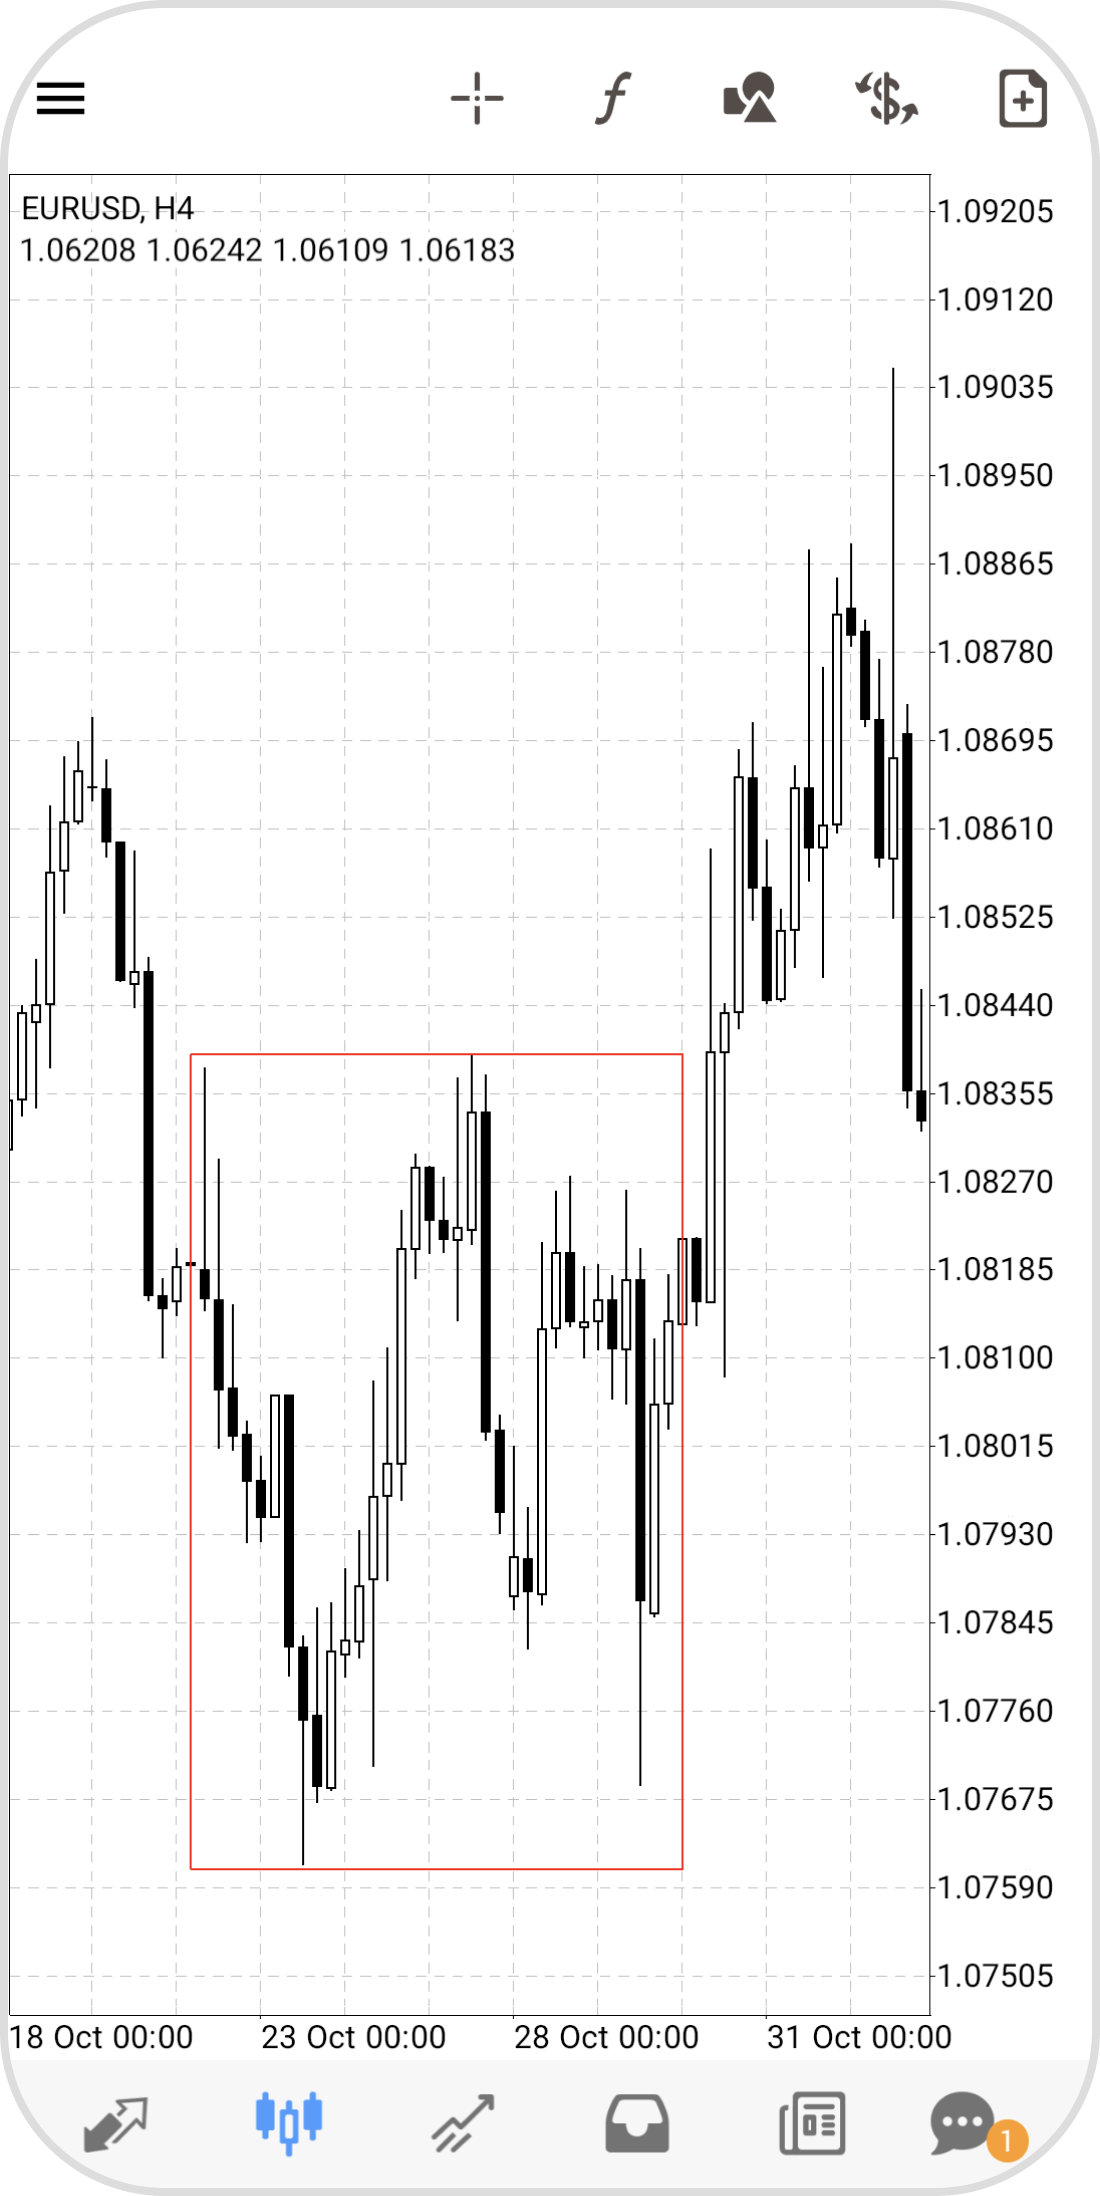
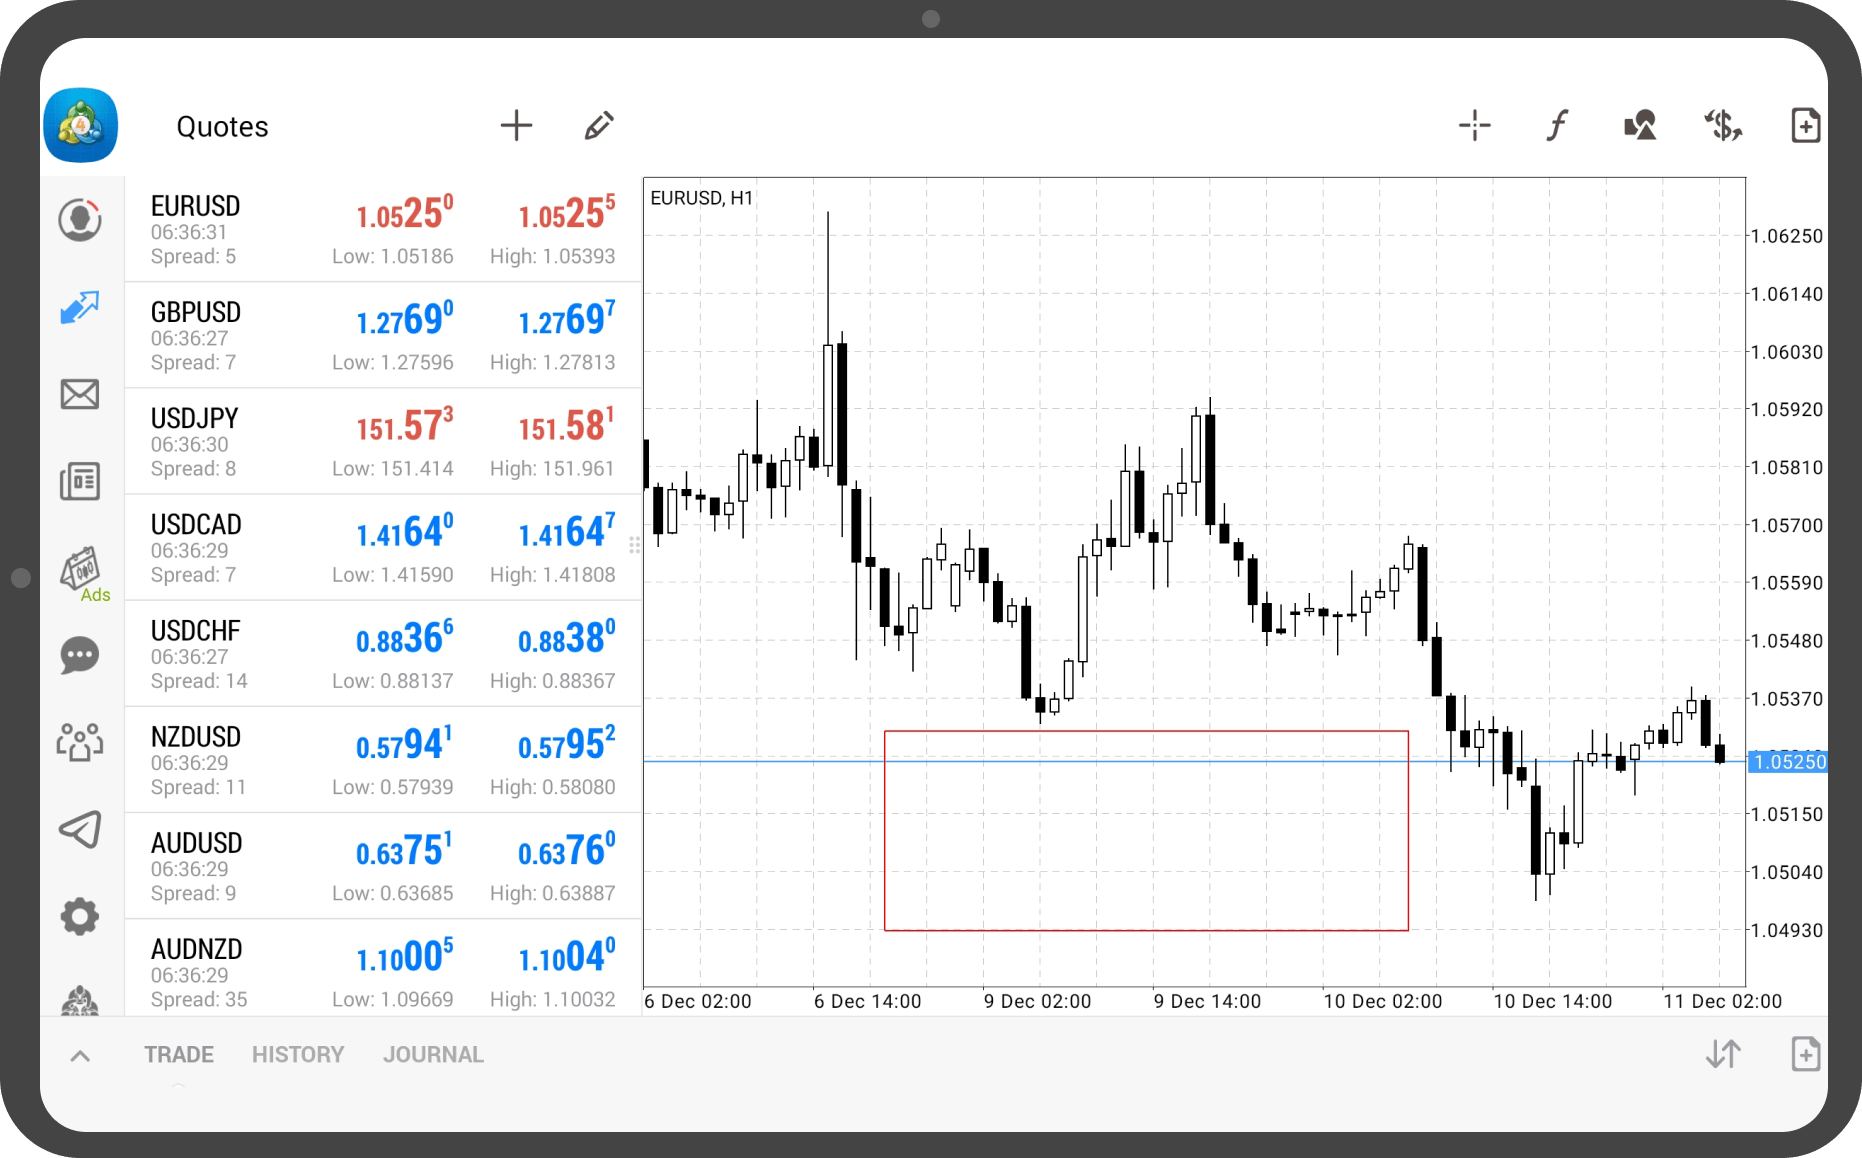
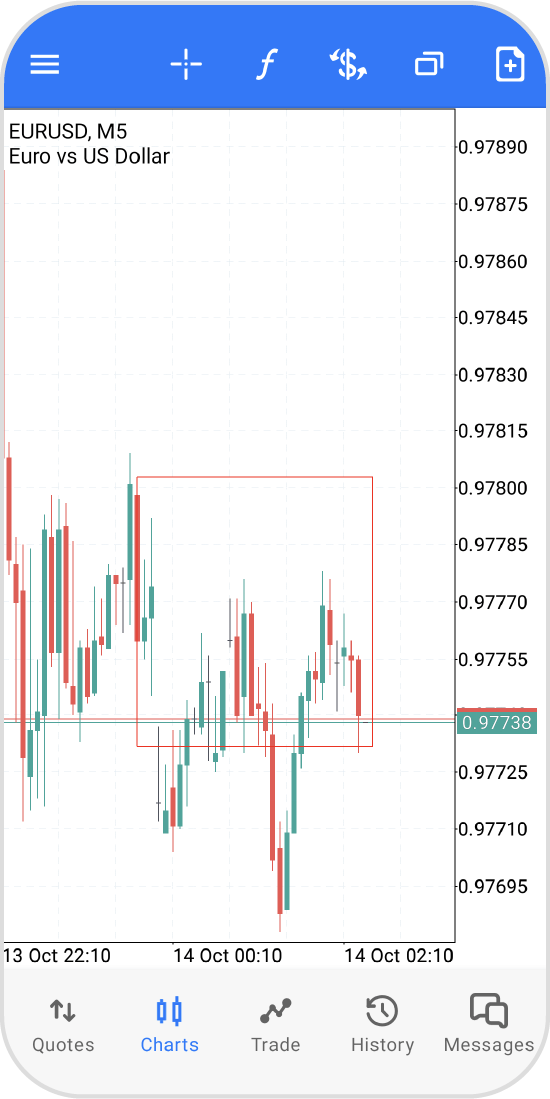
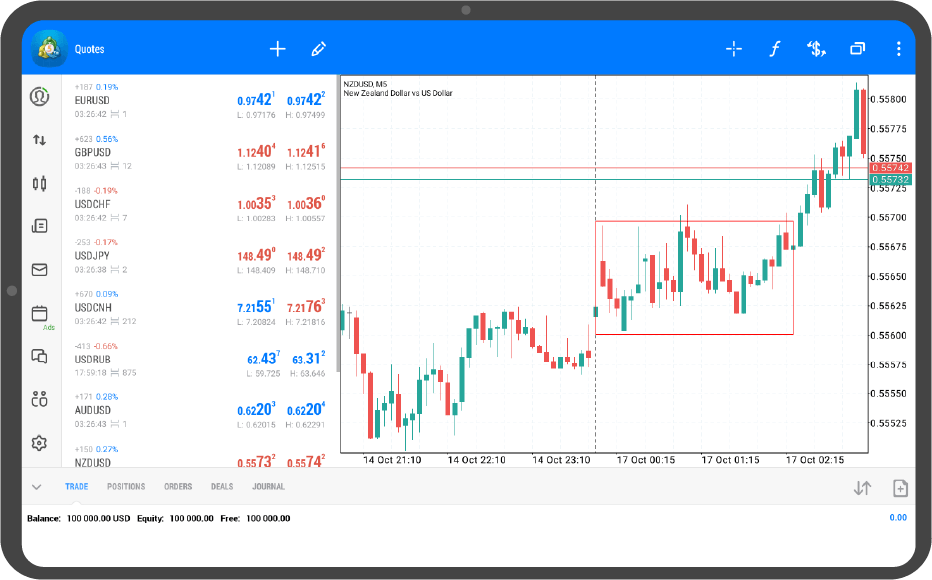
Here we'll look over the steps on how to display a rectangle on the chart in MetaTrader4 (MT4) / MetaTrader5 (MT5) app for Android and iOS mobile devices. On MT4/MT5, you can display 3 types of shapes on the chart, a rectangle, a triangle, and an ellipse. The color and shape of the rectangle can be changed to help identify the highest and lowest levels of the range-bound market.
| Related article: | Draw triangle |
| Draw ellipse |
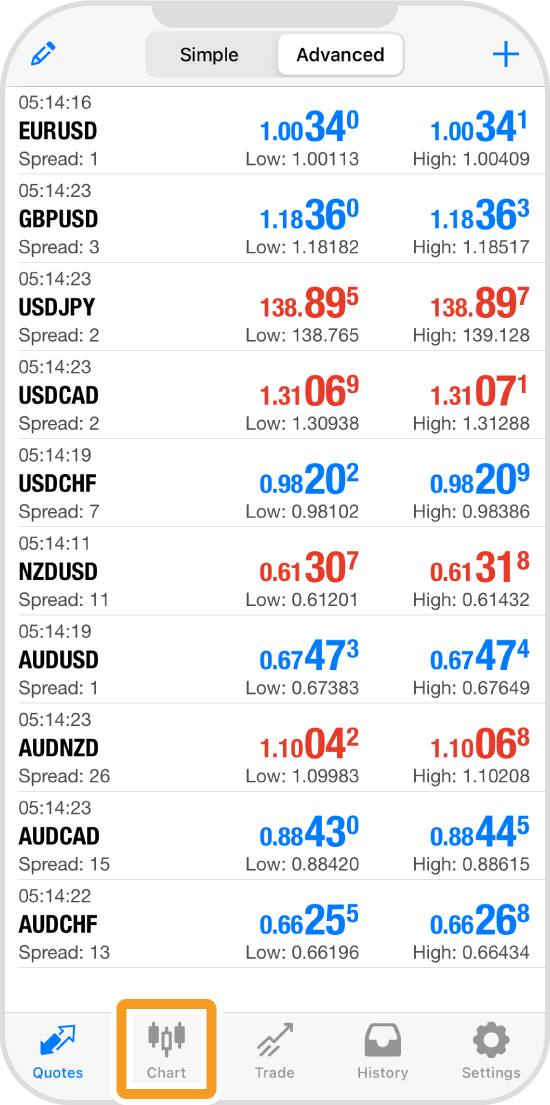
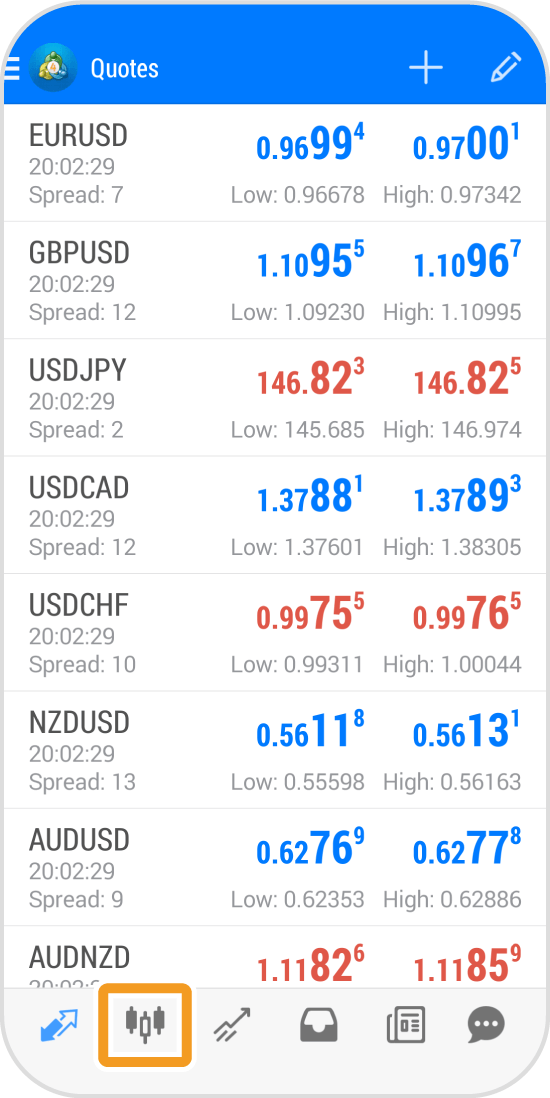
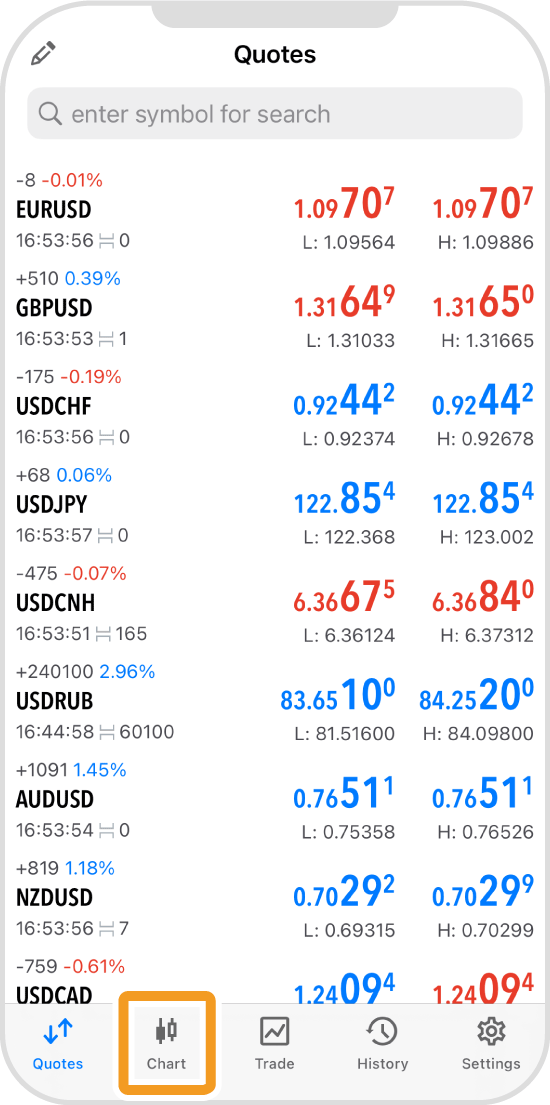
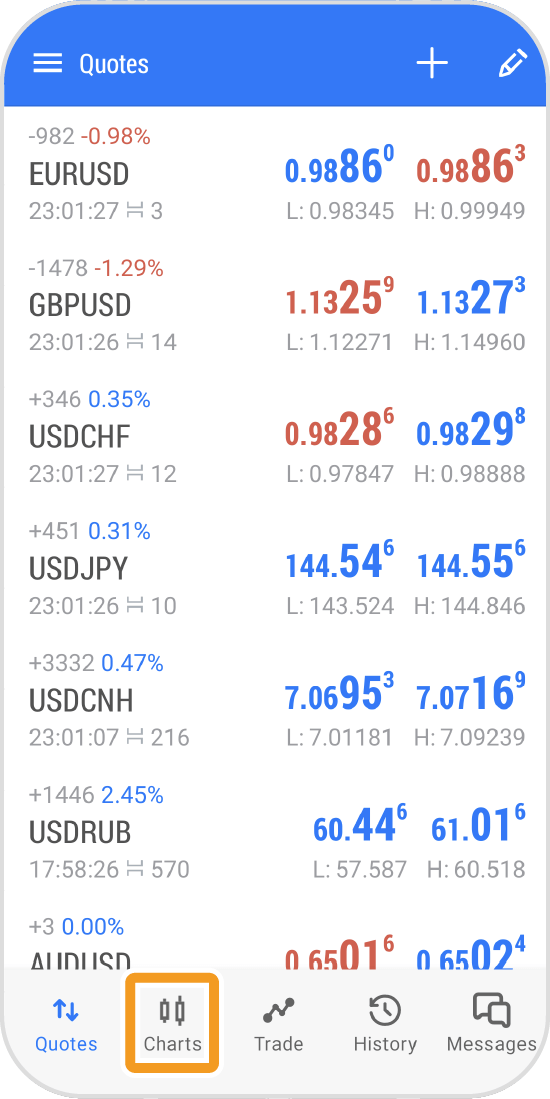
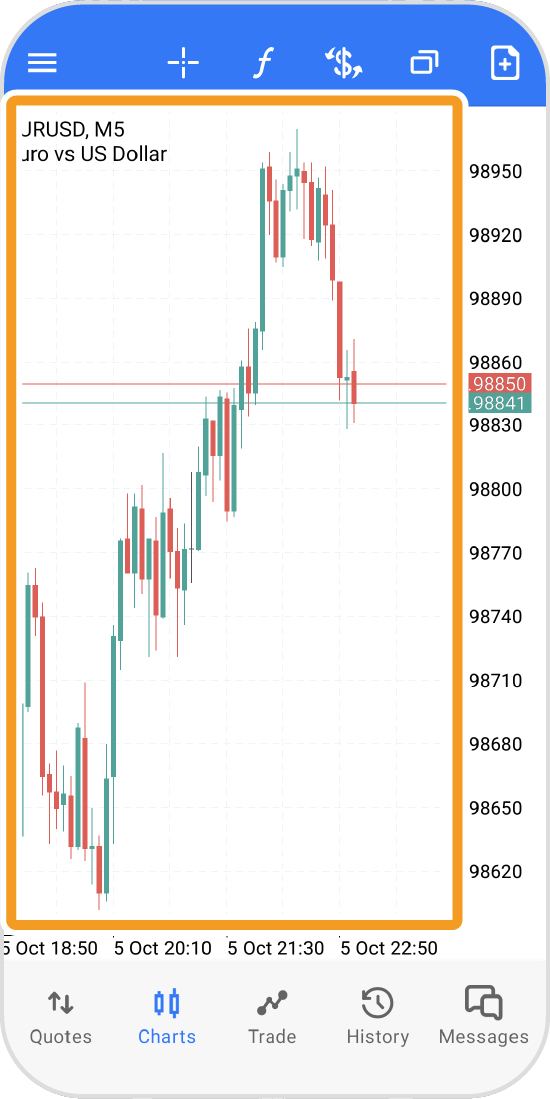
Tap "Chart" on the bottom navigation bar.
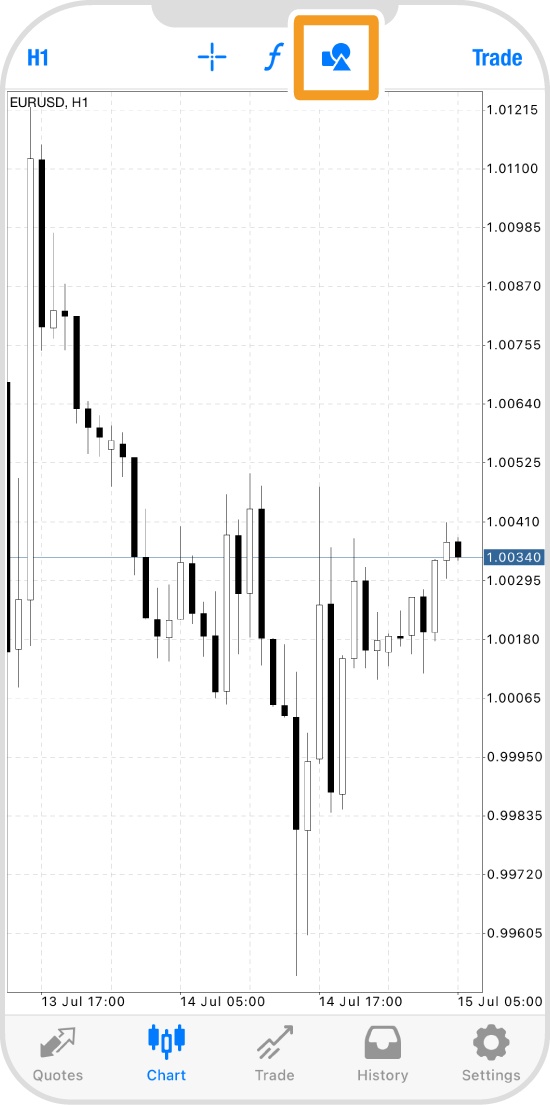
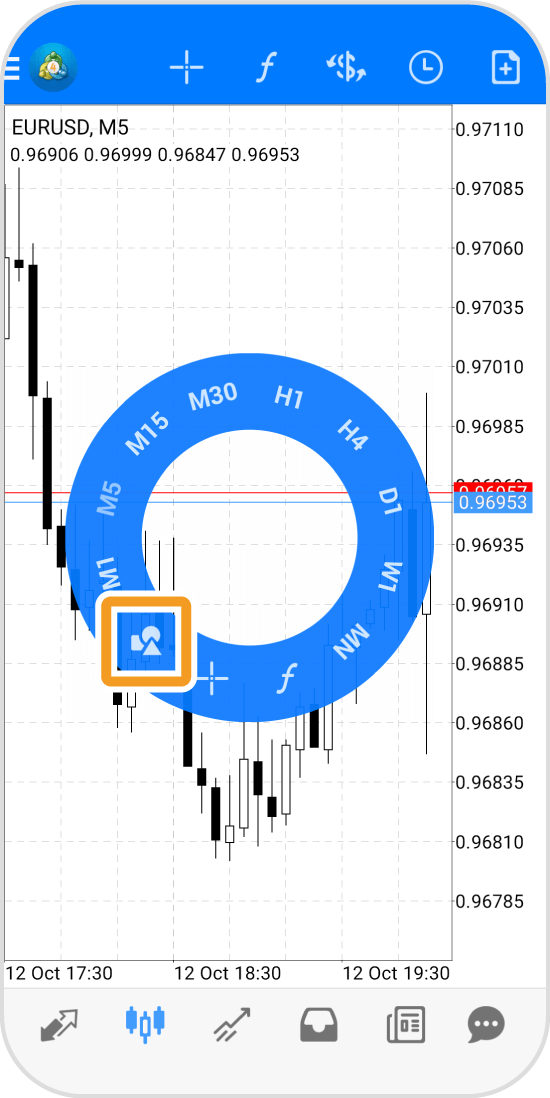
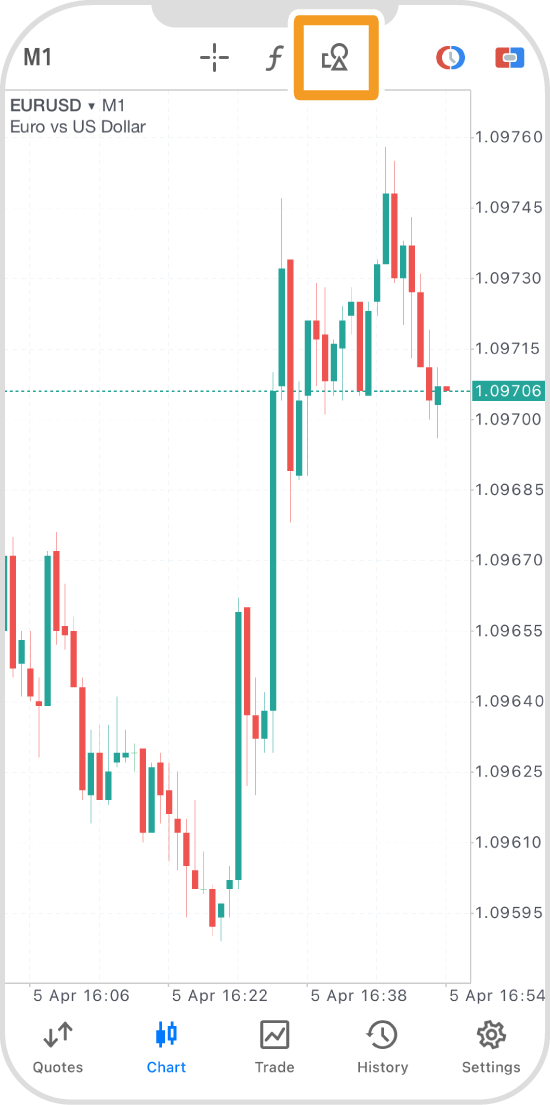
Tap the "Objects" icon at the top.
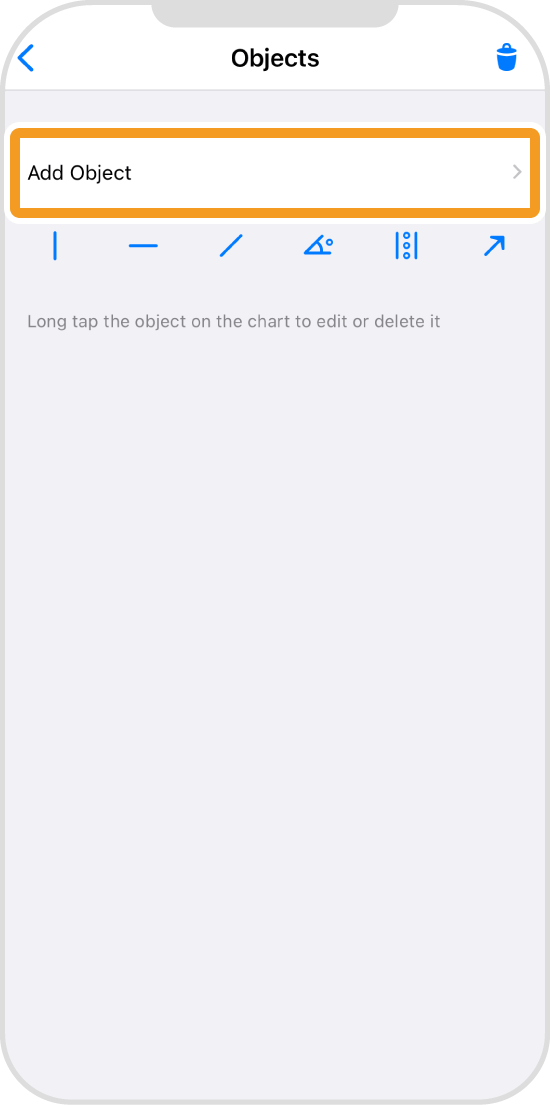
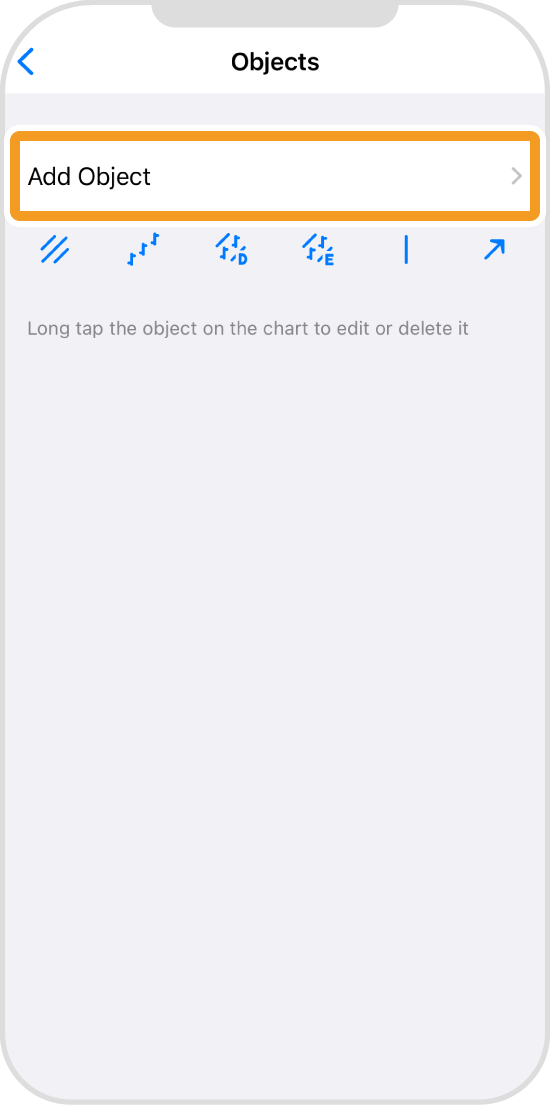
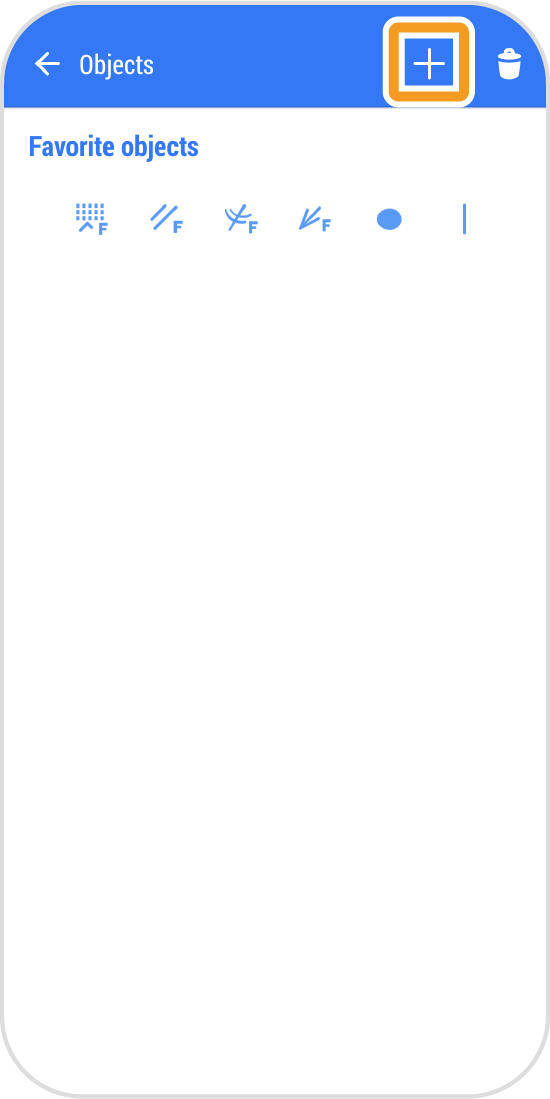
Tap "Add Object".
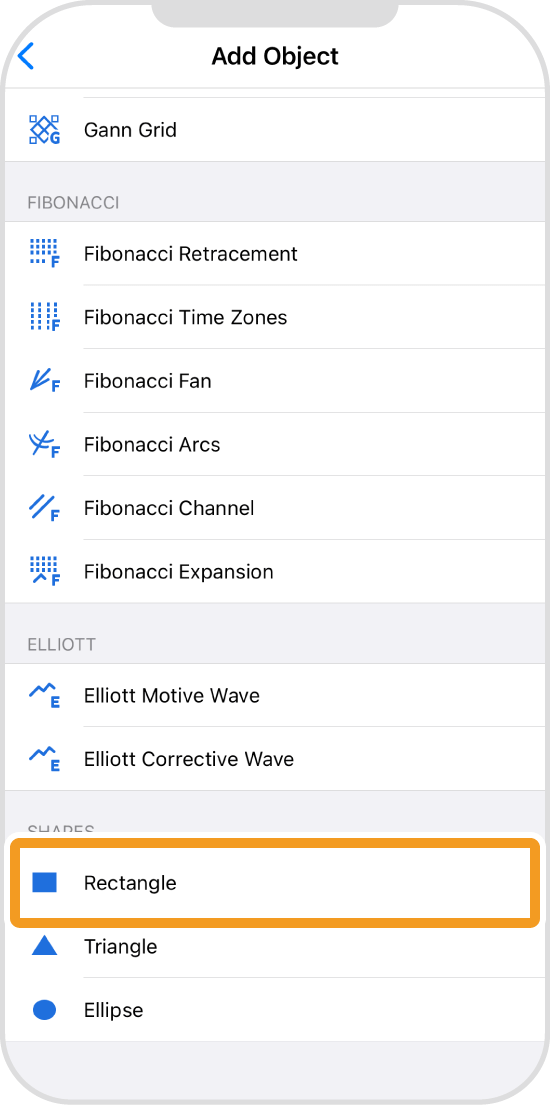
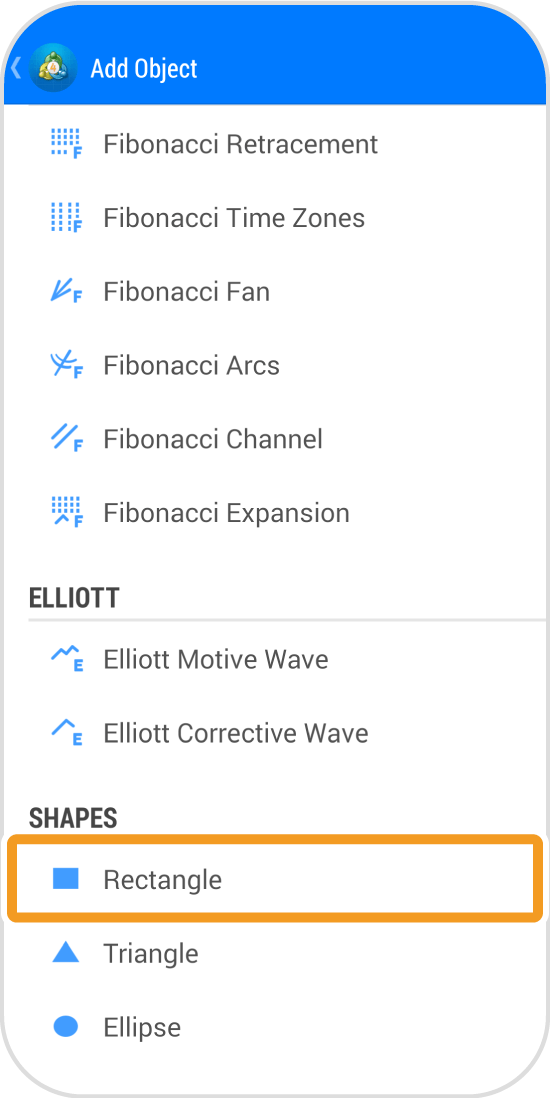
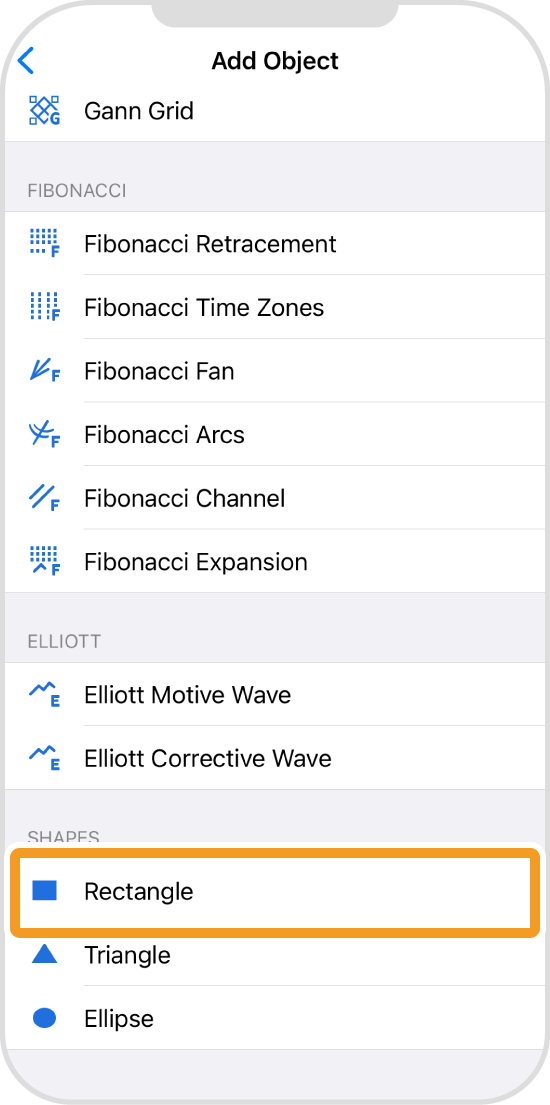
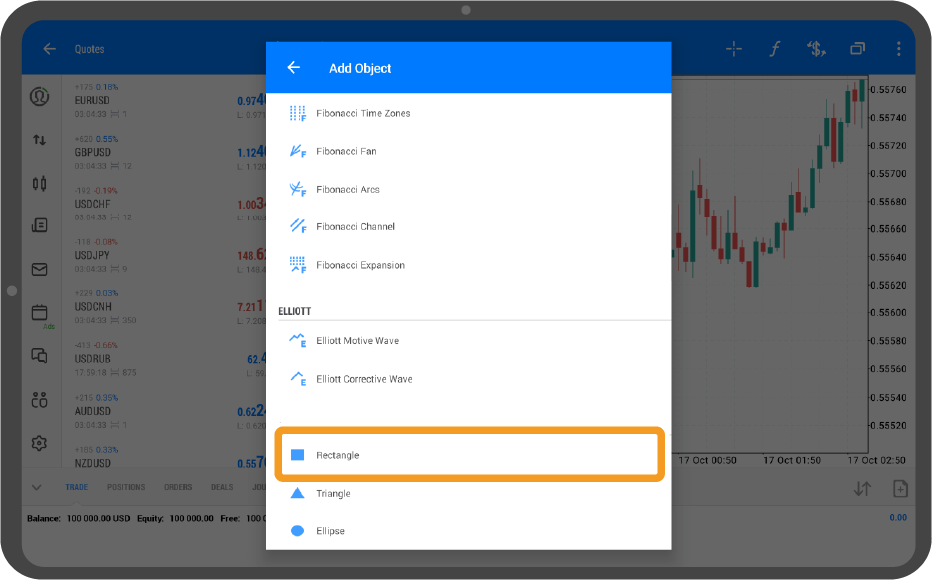
Tap "Rectangle".
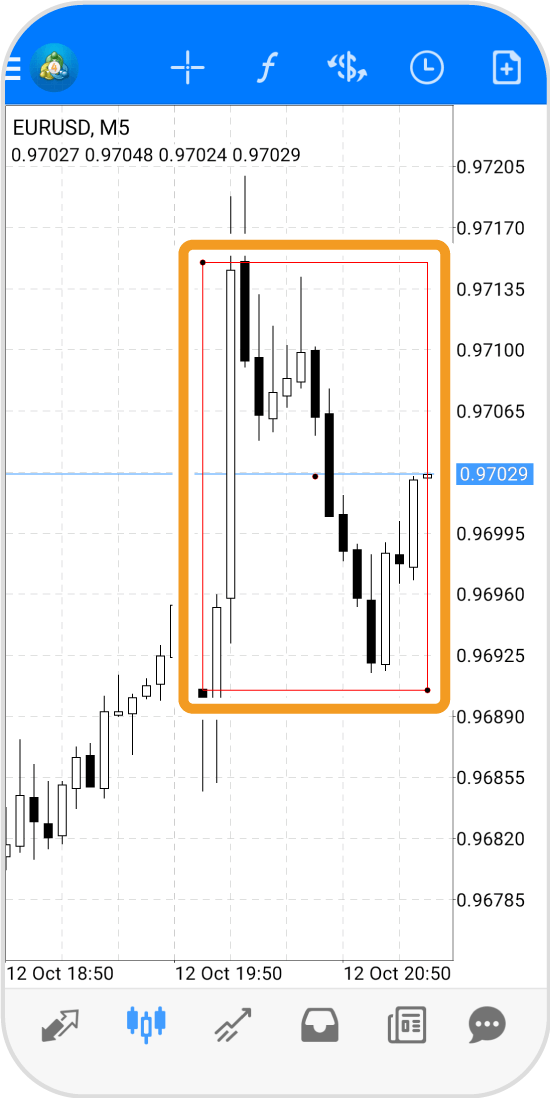
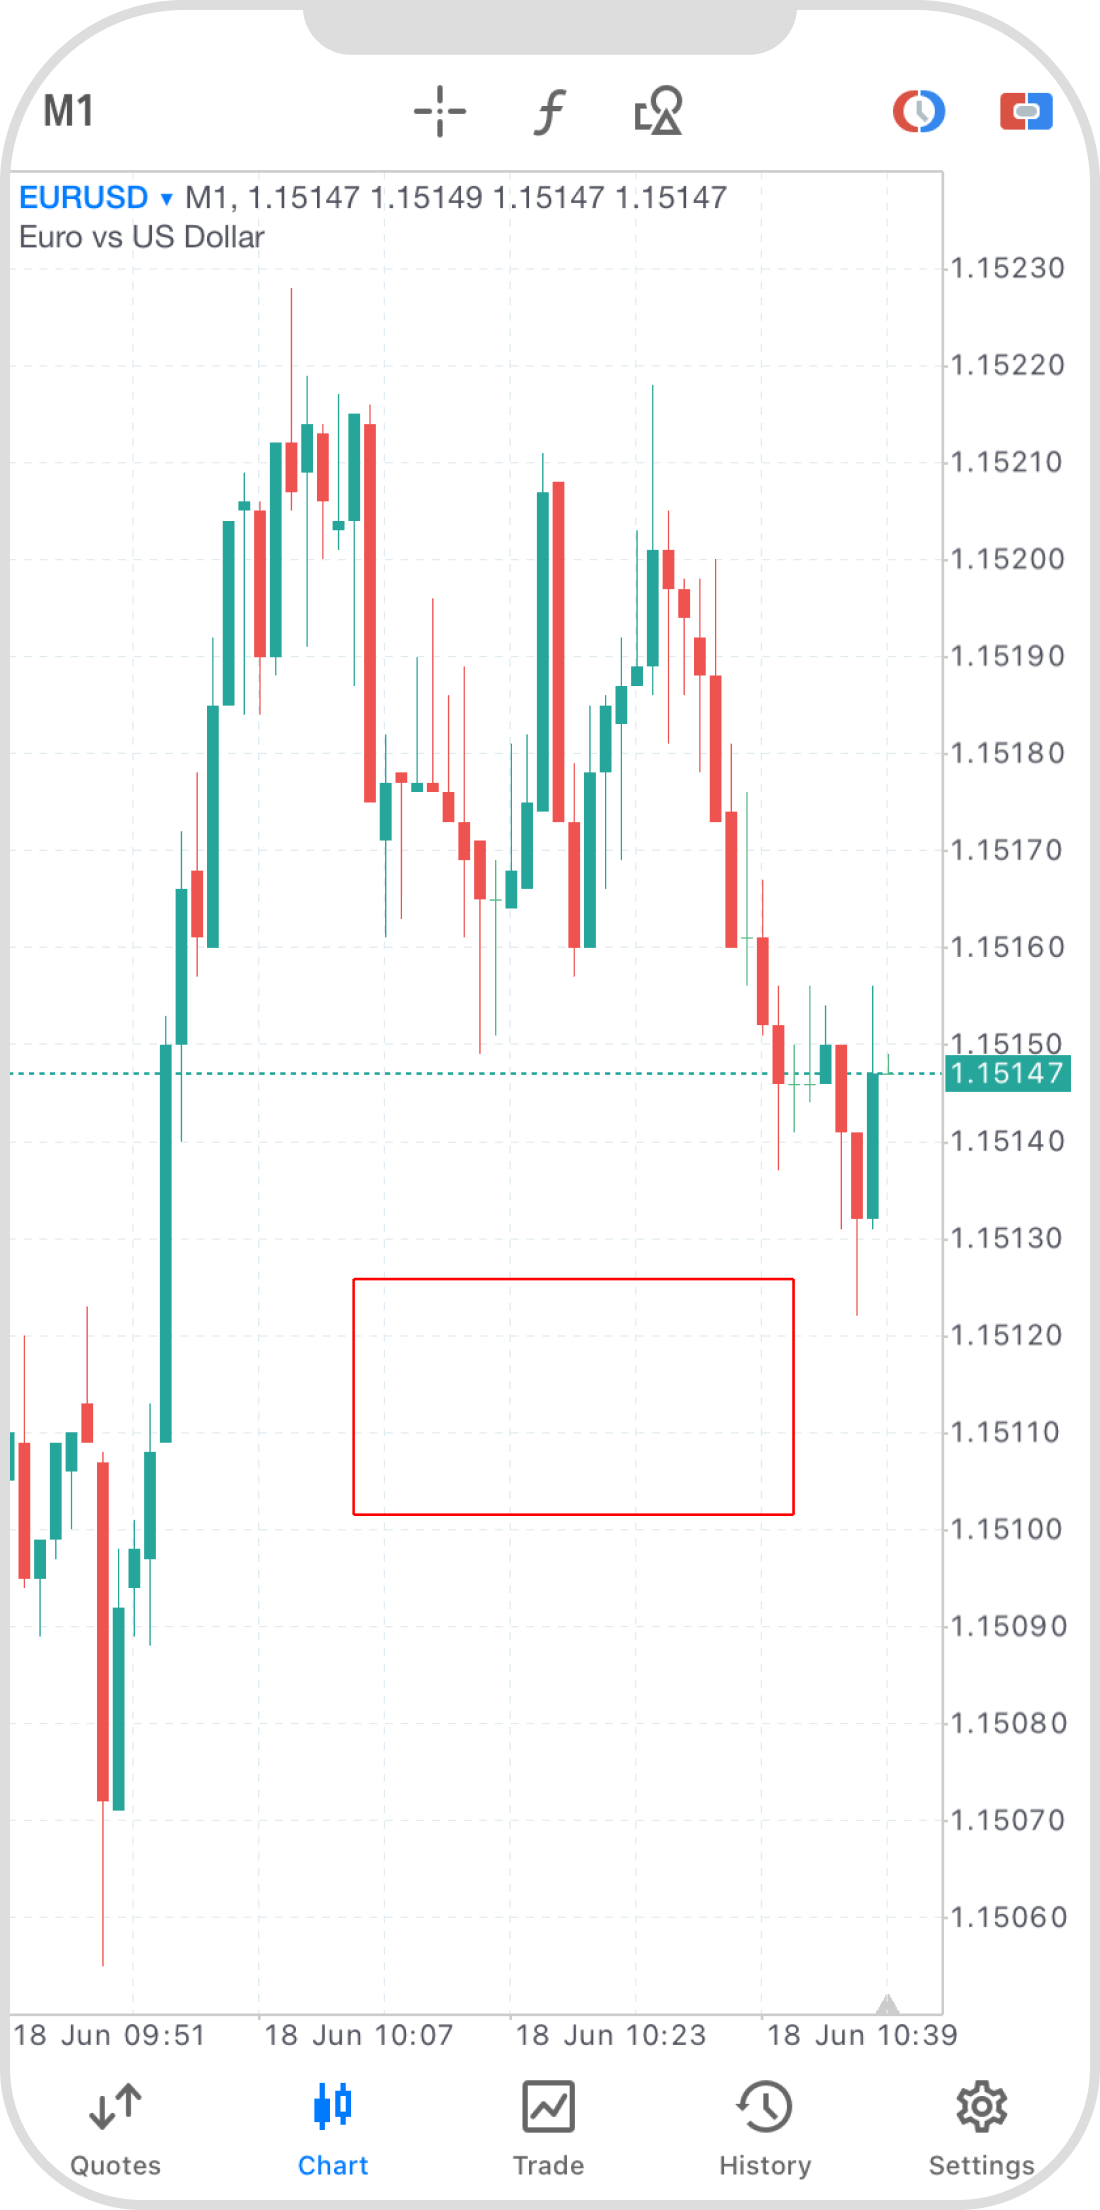
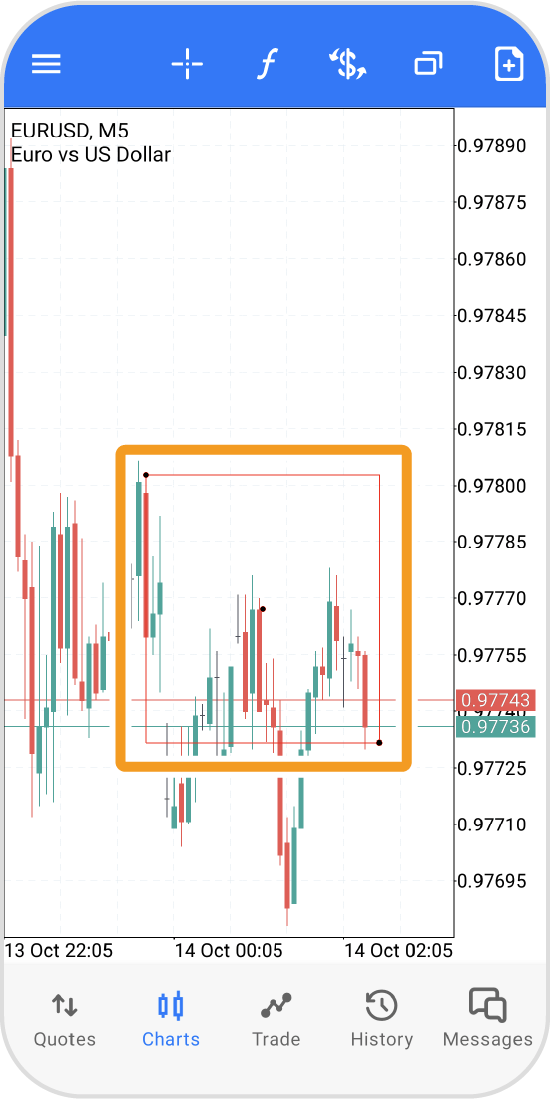
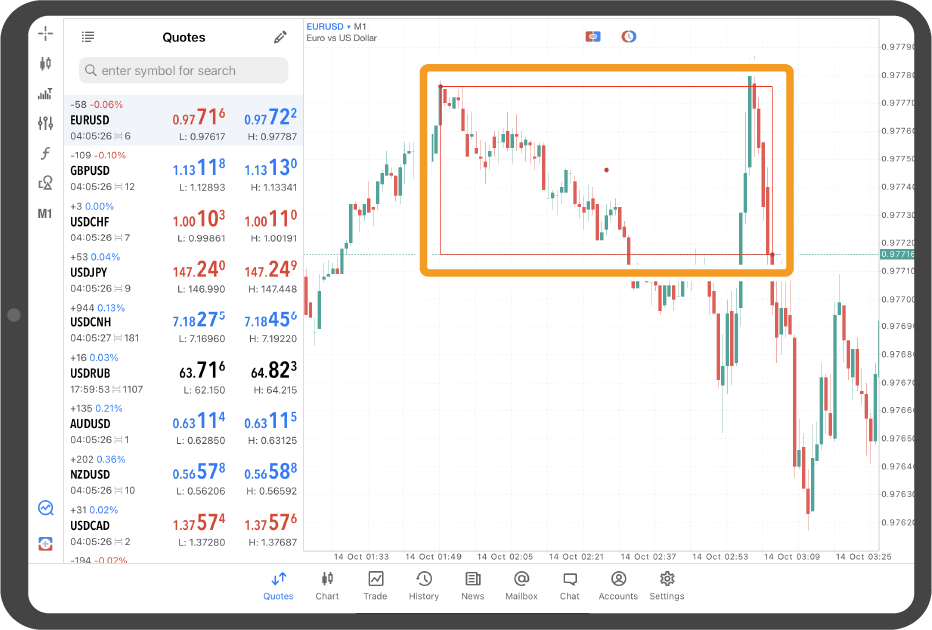
Tap at the starting point and drag to the end point to form a rectangle.
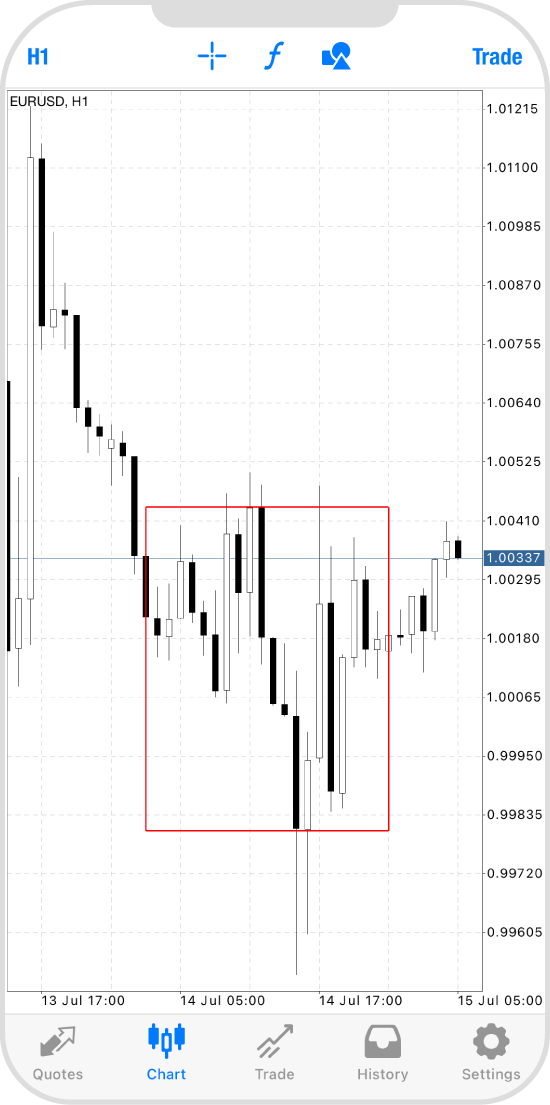
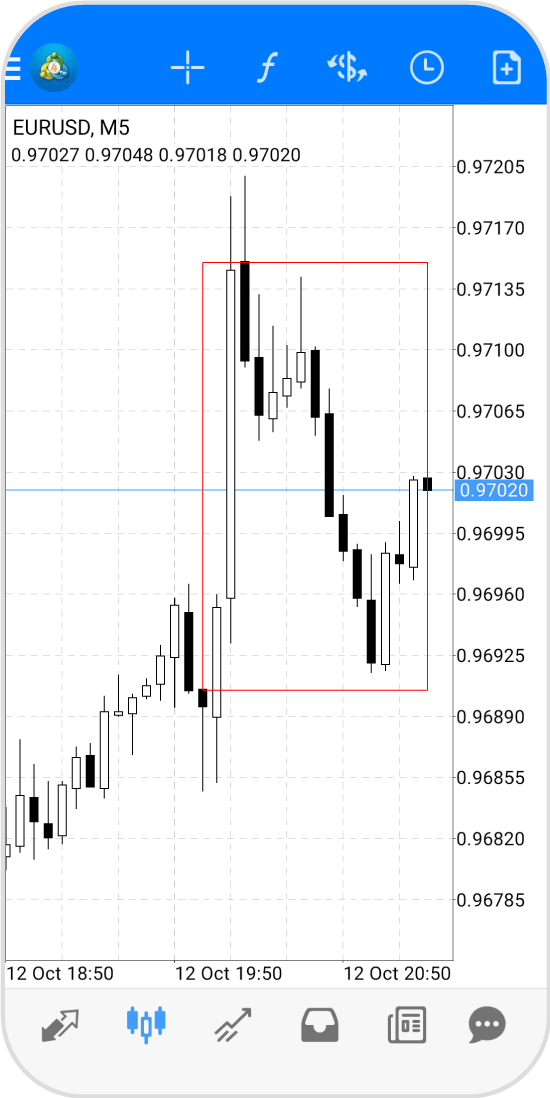
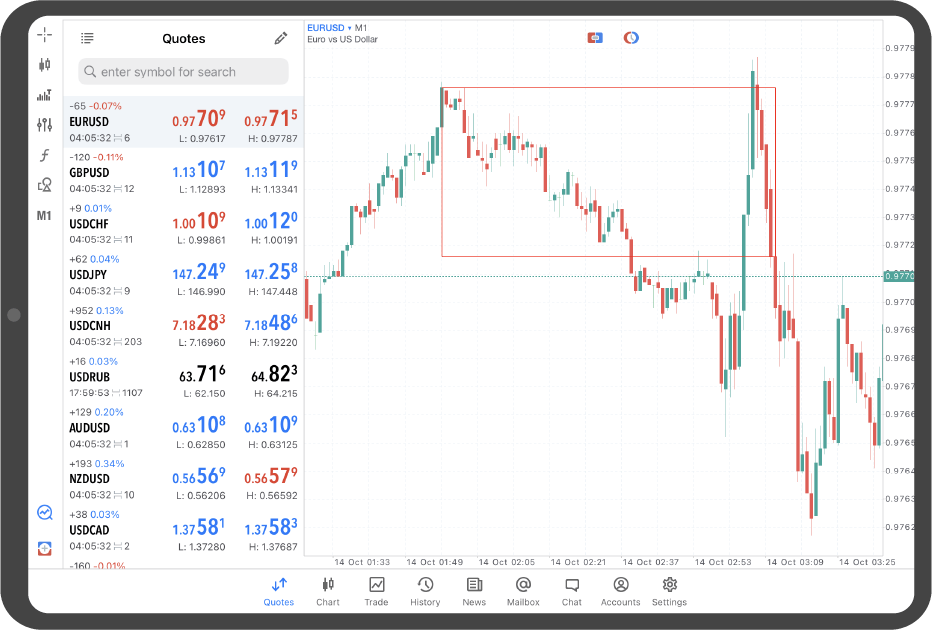
To fix the rectangle, tap on the line to hide the dots.
Tap "Chart" on the bottom navigation bar.
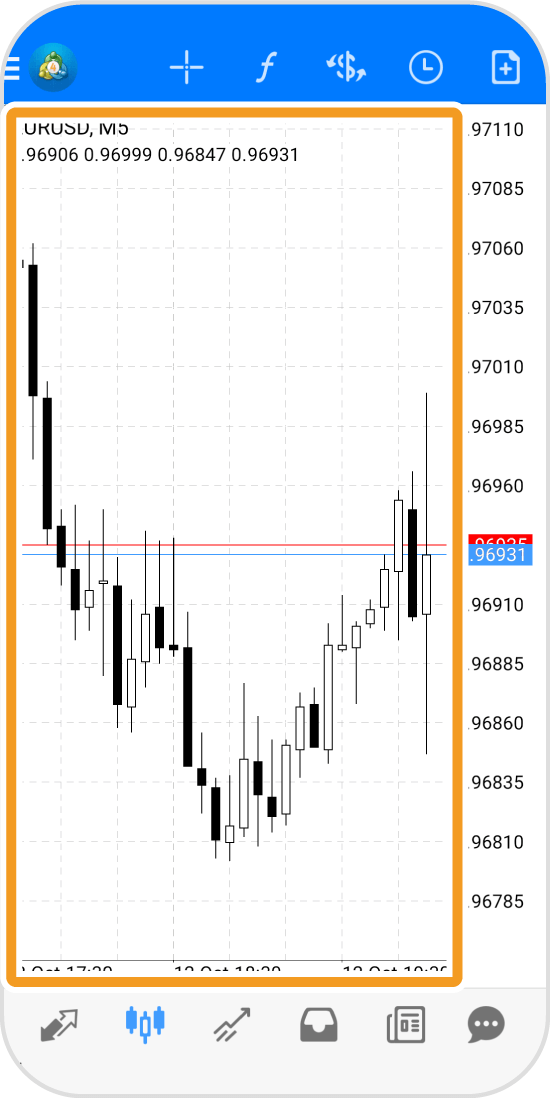
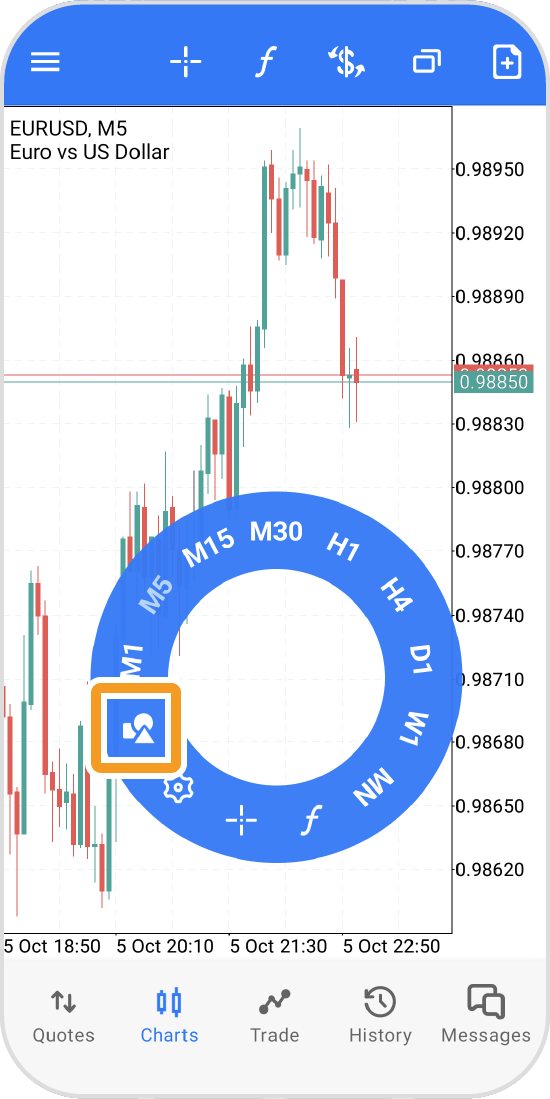
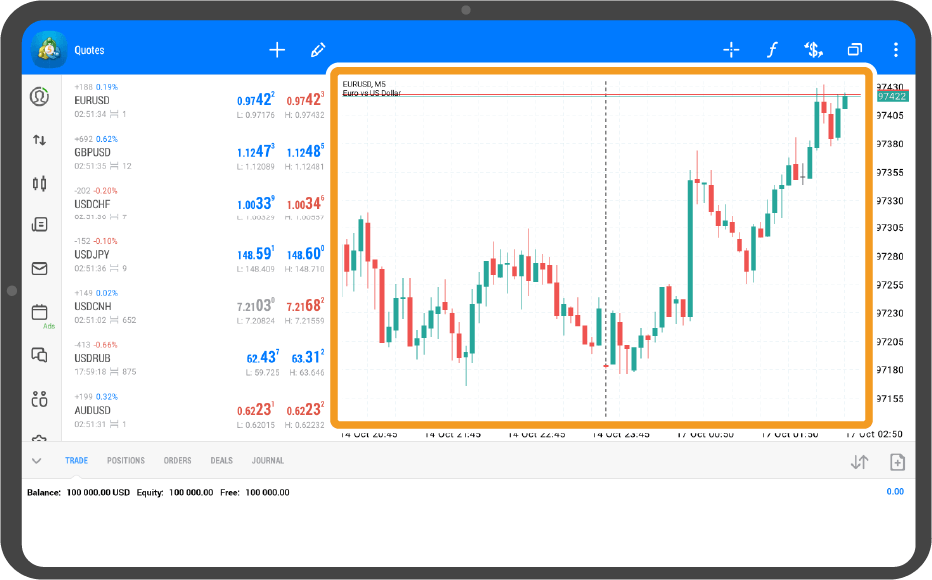
Tap on the chart.
Tap the "Objects" icon.
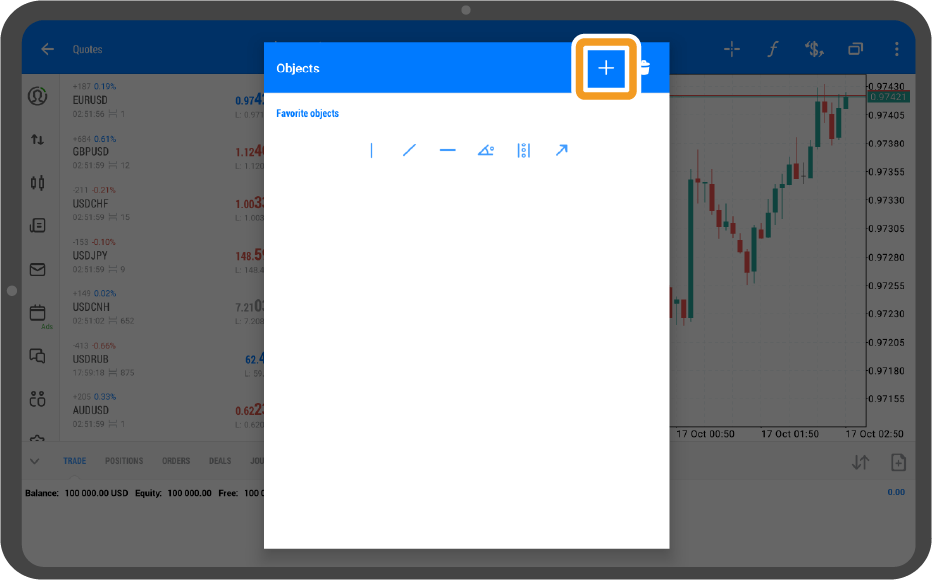
Tap "+" in the top right corner.
Tap "Rectangle".
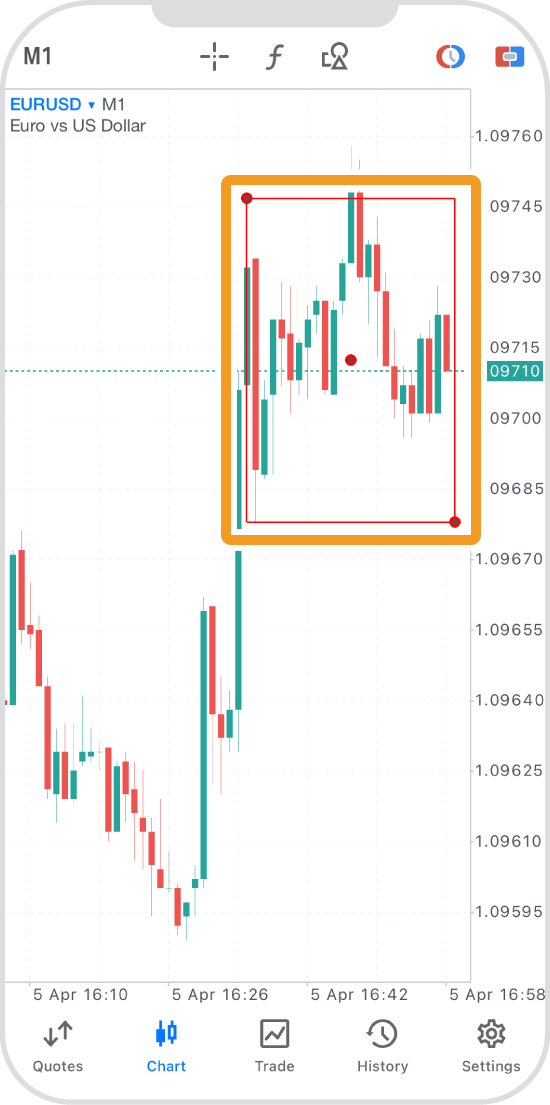
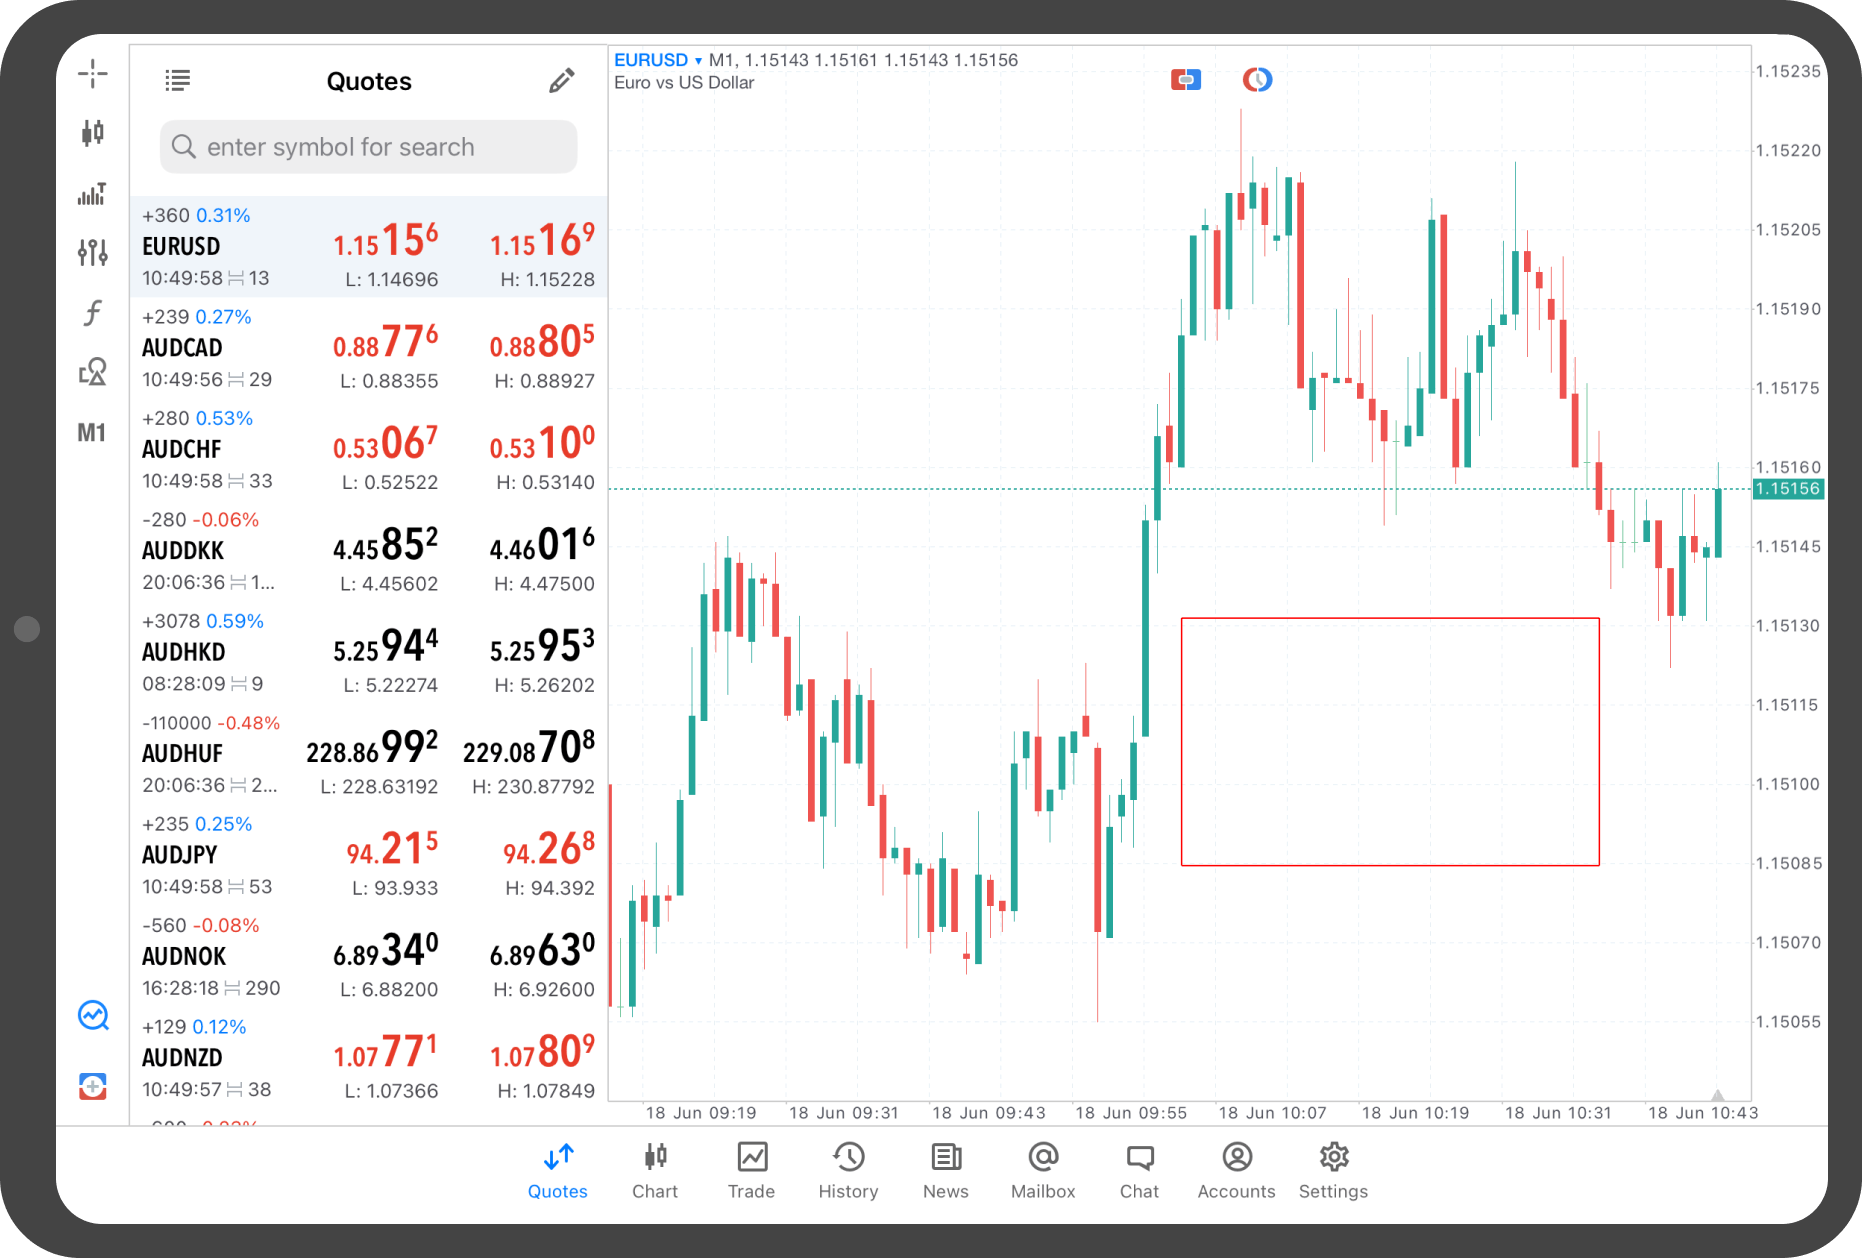
Tap the chart to set a vertex, then drag to the opposite vertex to adjust the shape.
To fix the rectangle, tap around the lines or the black dot in the center to hide the dots.
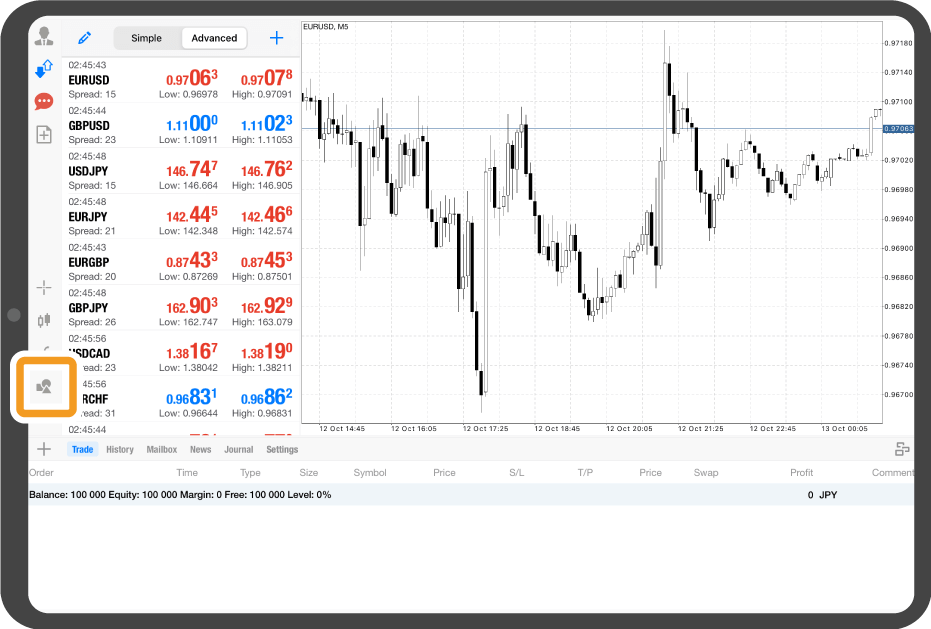
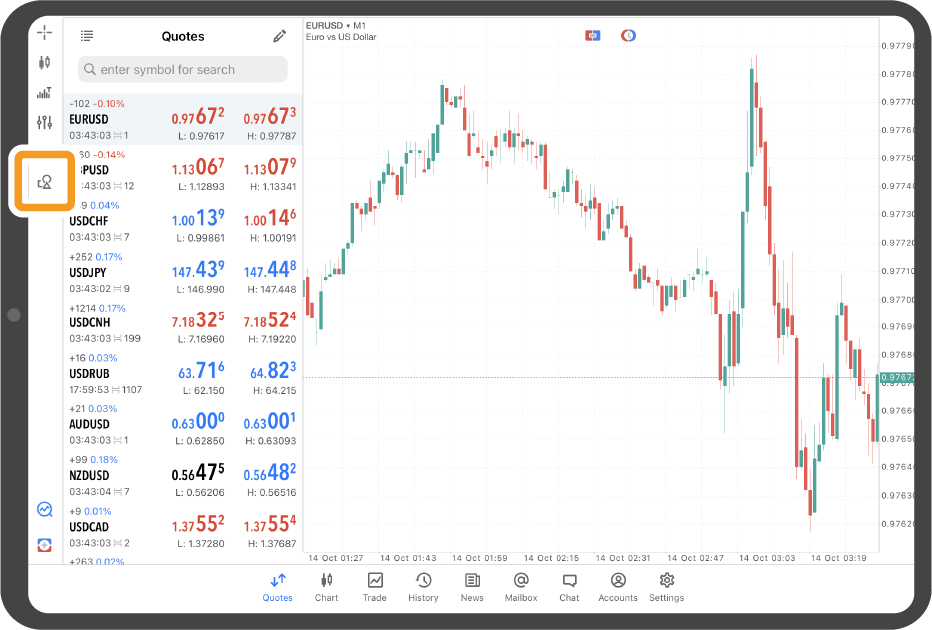
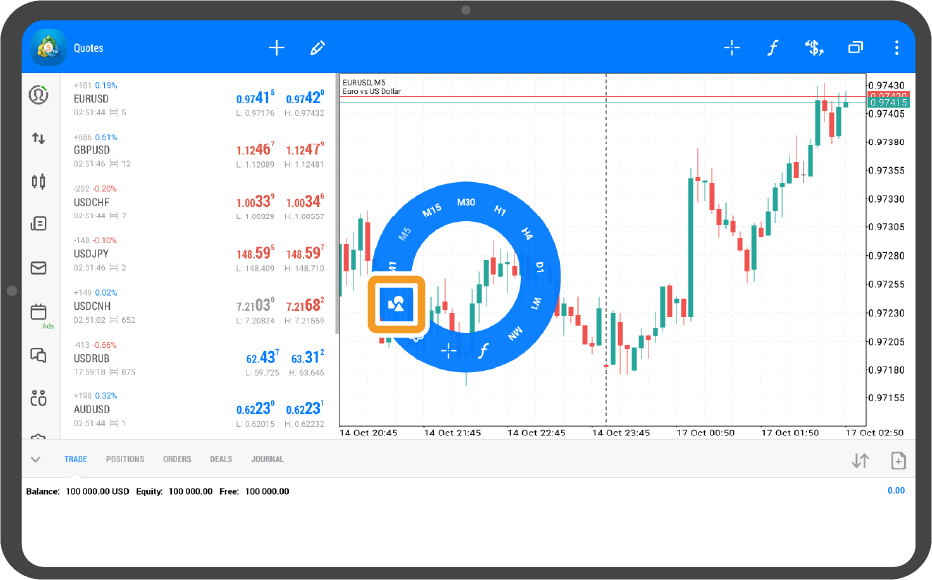
Tap the "Objects" icon on the left.
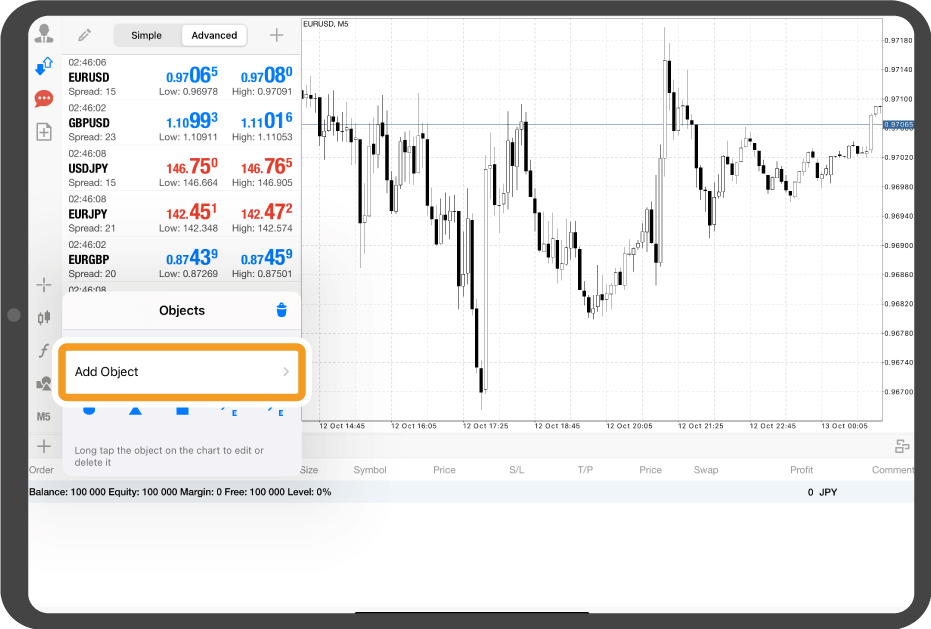
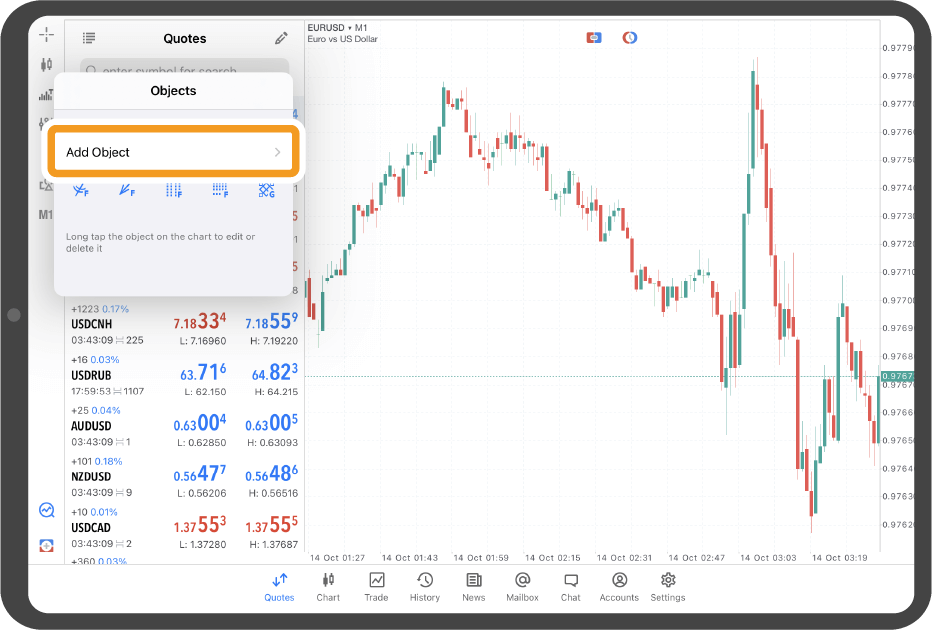
Tap "Add Object".
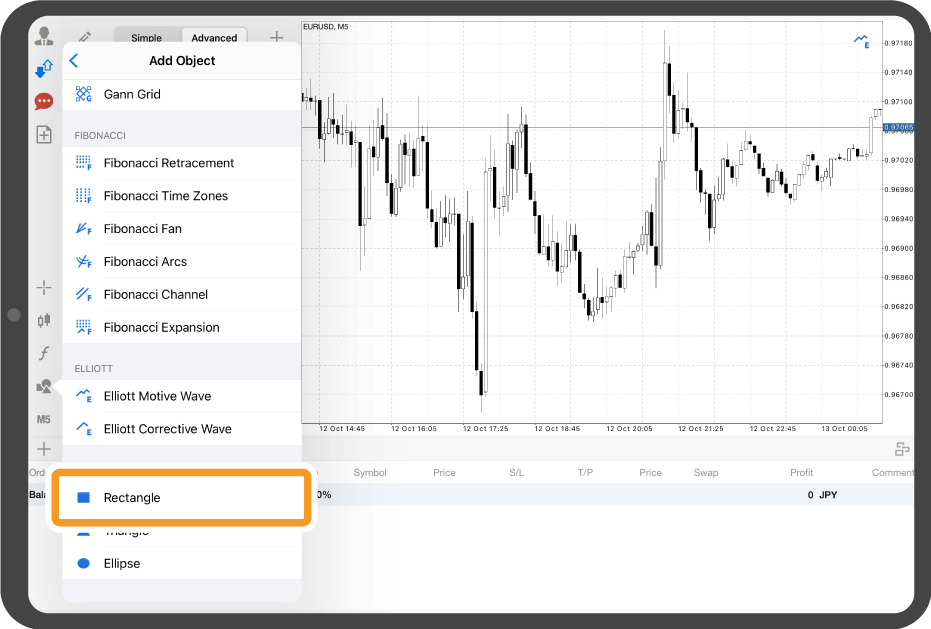
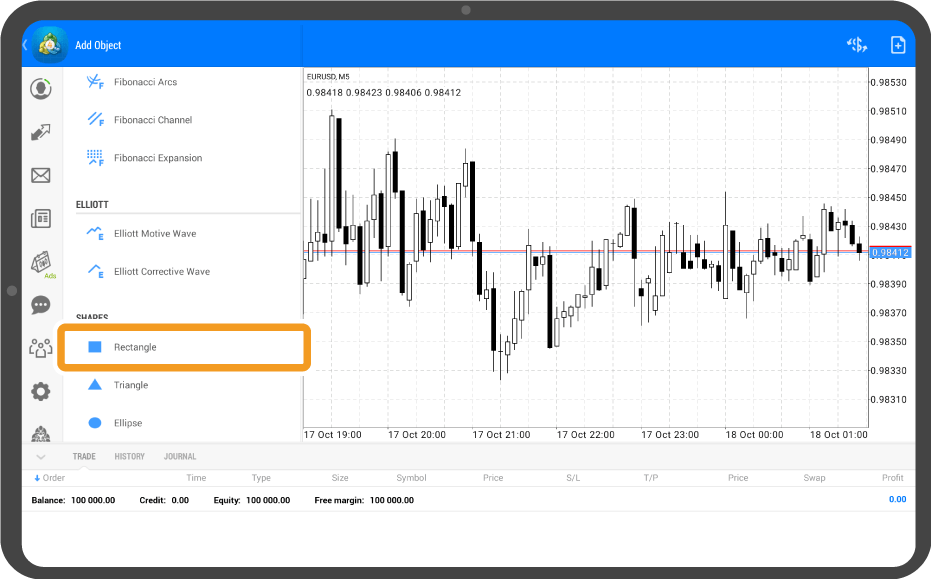
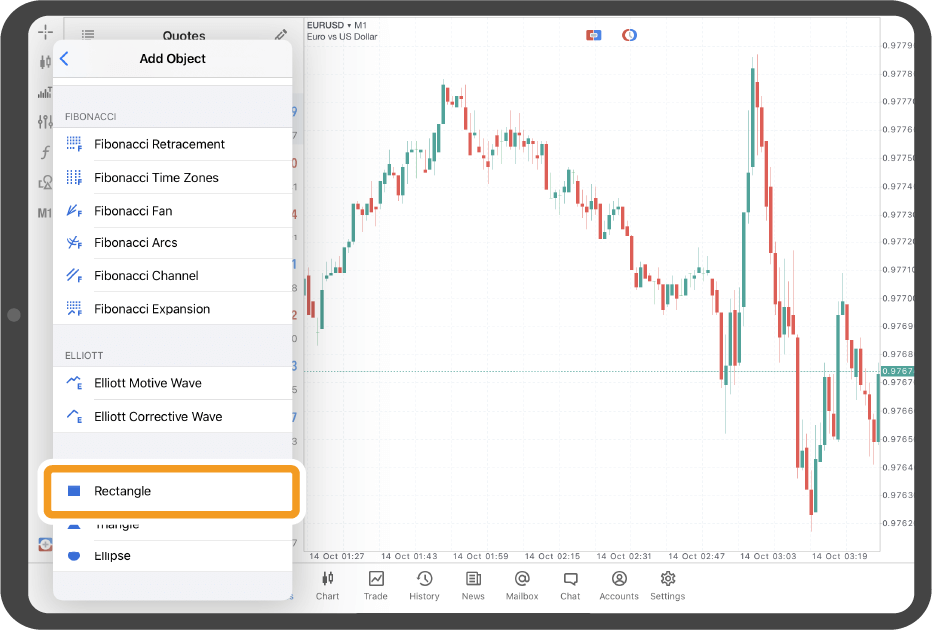
Tap "Rectangle".
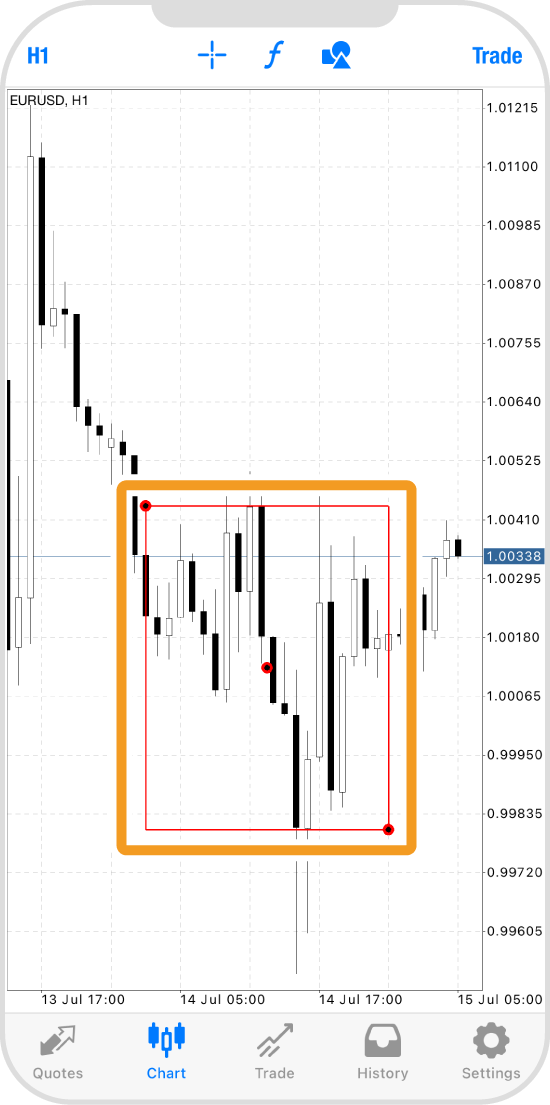
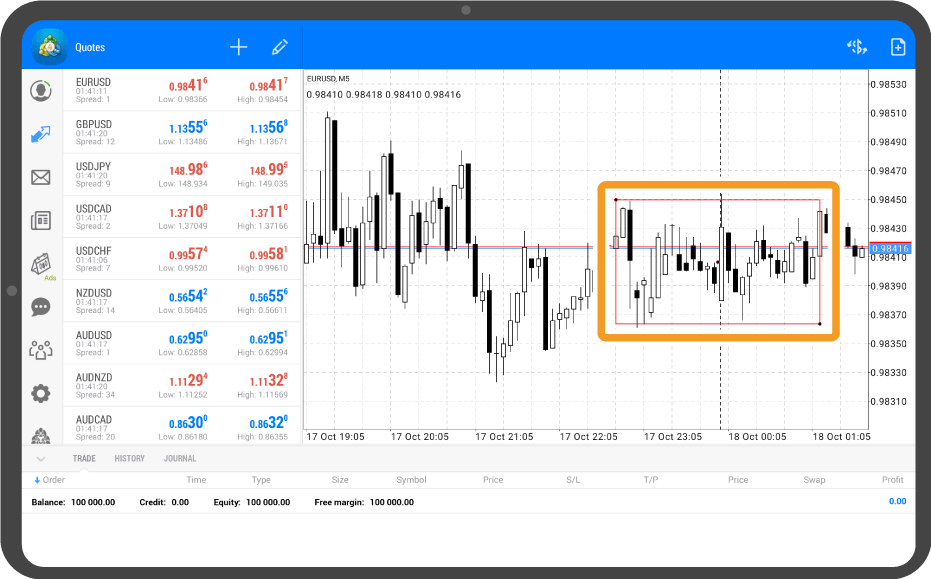
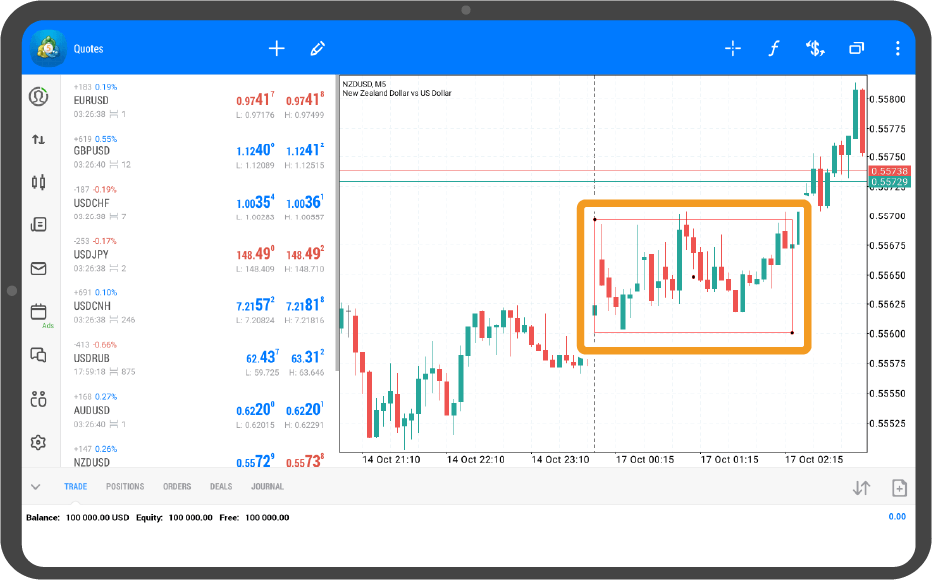
Tap the chart to set a vertex, then drag to the opposite vertex to adjust the shape.
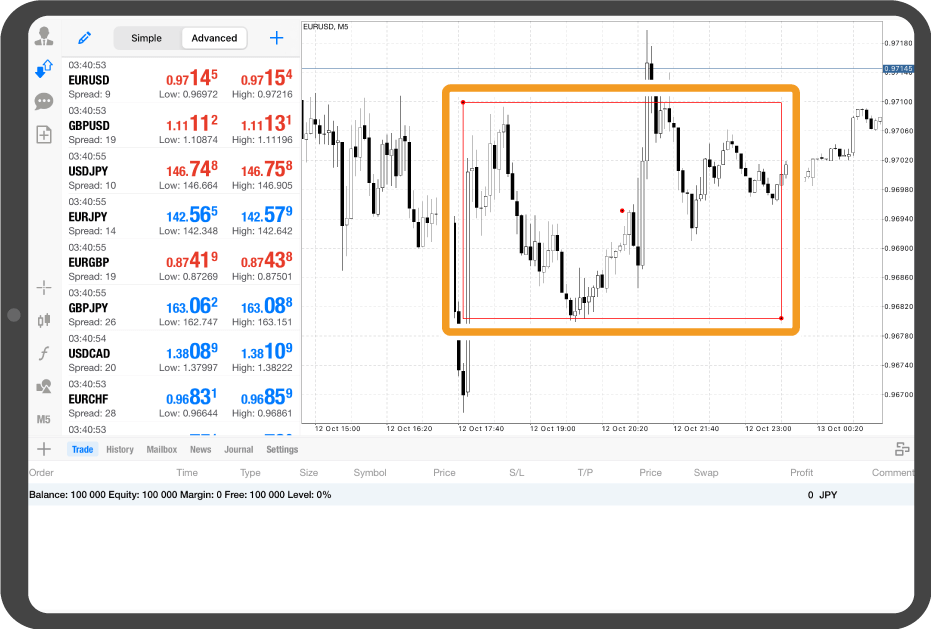
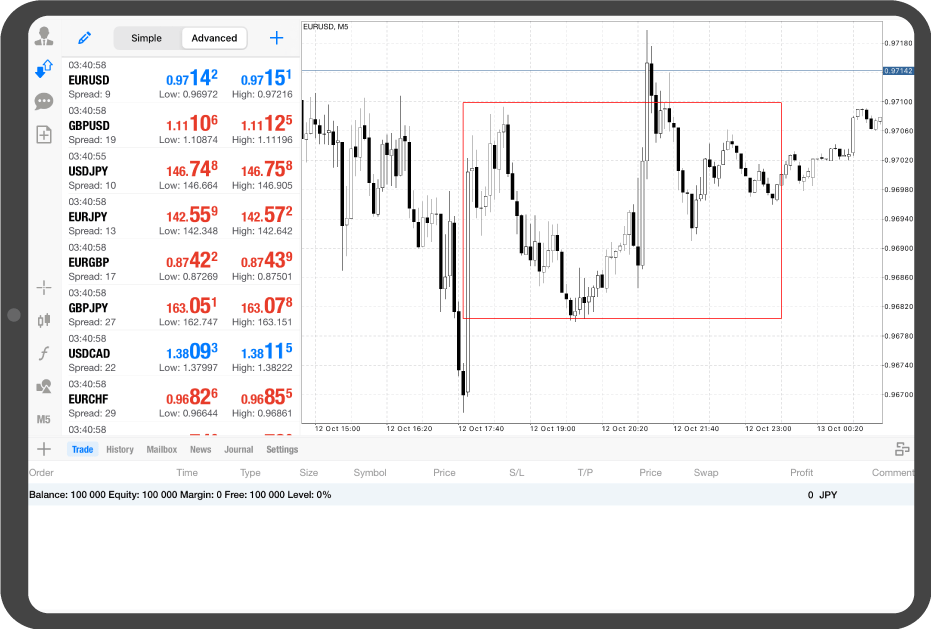
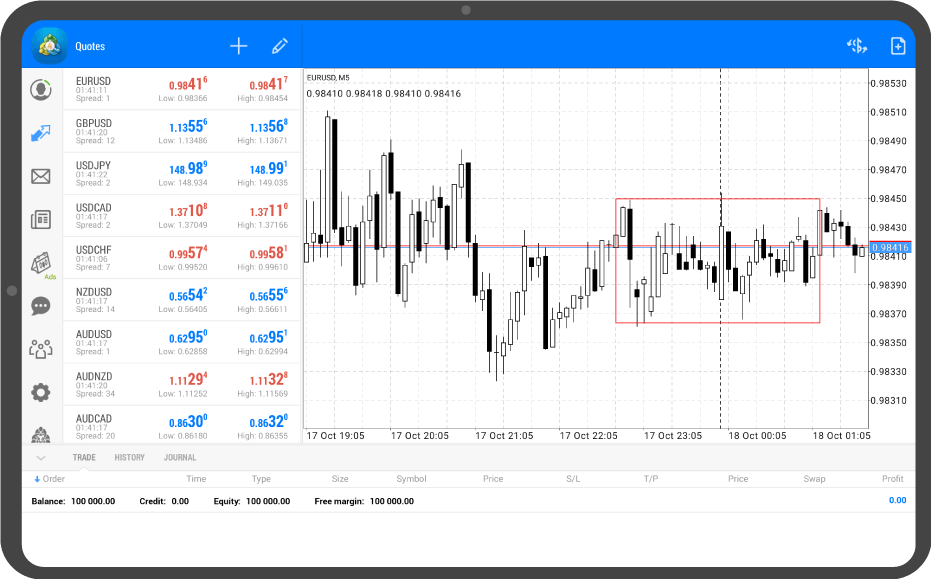
To fix the rectangle, tap around the lines or the red dot in the center to hide the dots.
Tap on the chart.
Tap the "Objects" icon.
The list of objects on the chart will be displayed. Tap "+" in the top right corner.
Tap "Rectangle".
Tap the chart to set a vertex, then drag to the opposite vertex to adjust the shape.
To fix the rectangle, tap around the lines or the black dot in the center to hide the dots.
Tap "Chart" on the bottom navigation bar.
Tap the "Objects" icon at the top.
Tap "Add Object".
Tap "Rectangle".
Tap at the starting point and drag to the end point to form a rectangle.
In the menu that appears after swiping, you can also change the line's color, thickness, and style.
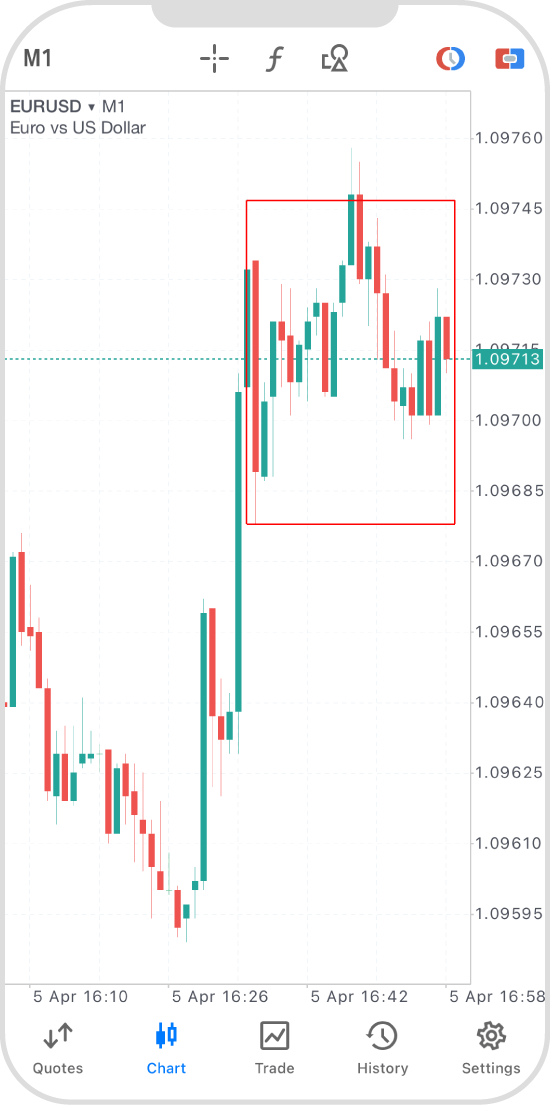
To fix the rectangle, tap on the line to hide the dots.
Tap "Charts" on the bottom navigation bar.
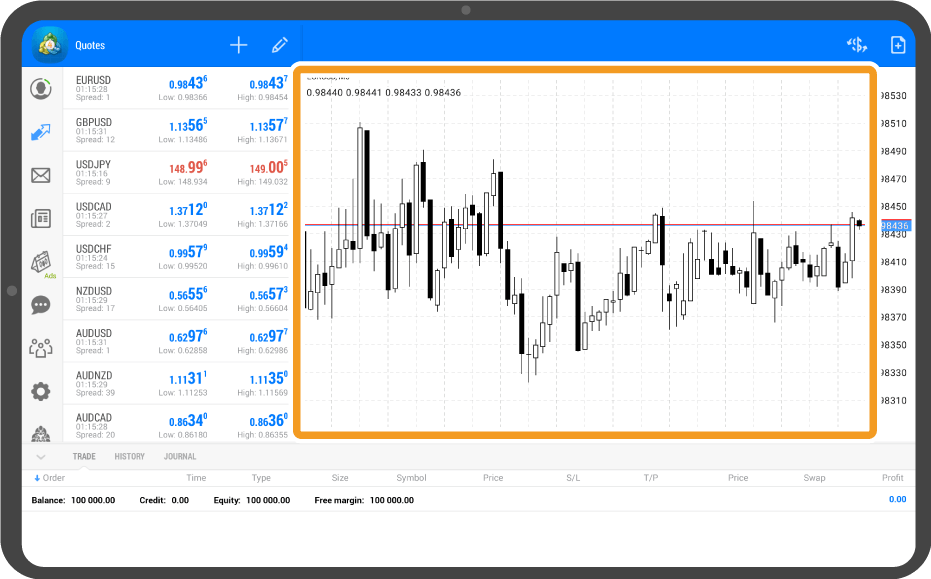
Tap on the chart.
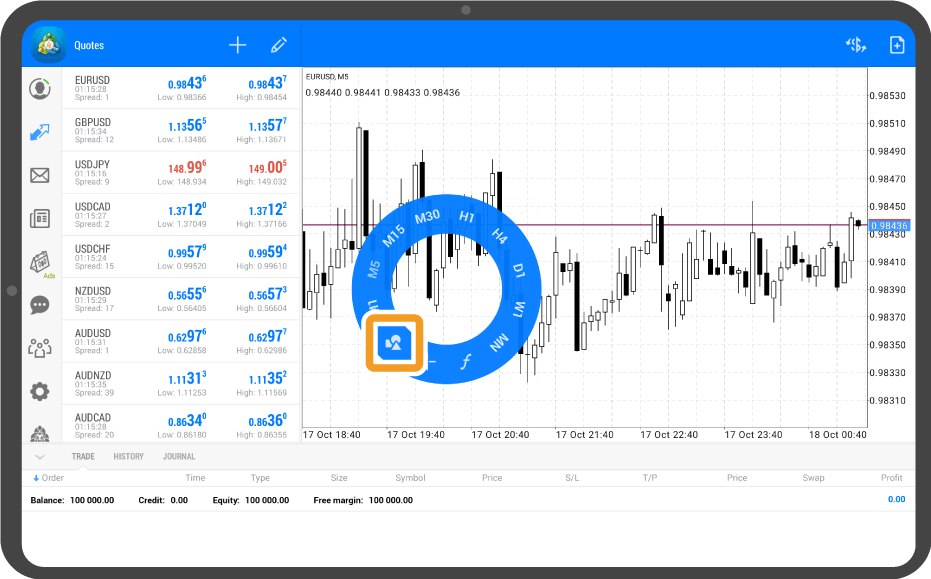
Tap the "Objects" icon.
Tap the "+" icon at the top.
Tap "Rectangle".

Tap the chart to set a vertex, then drag to the opposite vertex to adjust the shape.
To fix the rectangle, double-tap around the lines or the black dot in the center to hide the dots.
Tap the "Objects" icon on the left.
Tap "Add Object".
Tap "Rectangle".
Tap the chart to set a vertex, then drag to the opposite vertex to adjust the shape.
In the menu that appears after swiping, you can also change the line's color, thickness, and style.
To fix the rectangle, tap around the lines or the red dot in the center to hide the dots.
Tap on the chart.
Tap the "Objects" icon.
Tap the "+" icon at the top.
Tap "Rectangle".
Tap the chart to set a vertex, then drag to the opposite vertex to adjust the shape.
To fix the rectangle, double-tap around the lines or the black dot in the center to hide the dots.
Was this article helpful?
0 out of 0 people found this article helpful.
Thank you for your feedback.