


MT4/MT5: Add on-balance volume to chart
EA, indicators & objects (PC)
EA, indicators & objects (PC)

This article was :
published
updated
On MetaTrader4 (MT4) / MetaTrader5 (MT5), you can display the On-balance volume (OBV), a technical indicator developed by Joseph Granville (USA).
Since it relies on volume for its calculations, it is best suited for symbols with available volume data, such as stocks. While OBV is less commonly used for forex symbols due to the lack of volume data, you can substitute tick volume, which represents the number of ticks.
Here we will look at how to add OBV to a chart on MT4/MT5.
Switch between MT4/MT5 tabs to check the steps for each.
OBV can be set up from the menu or the Navigator.
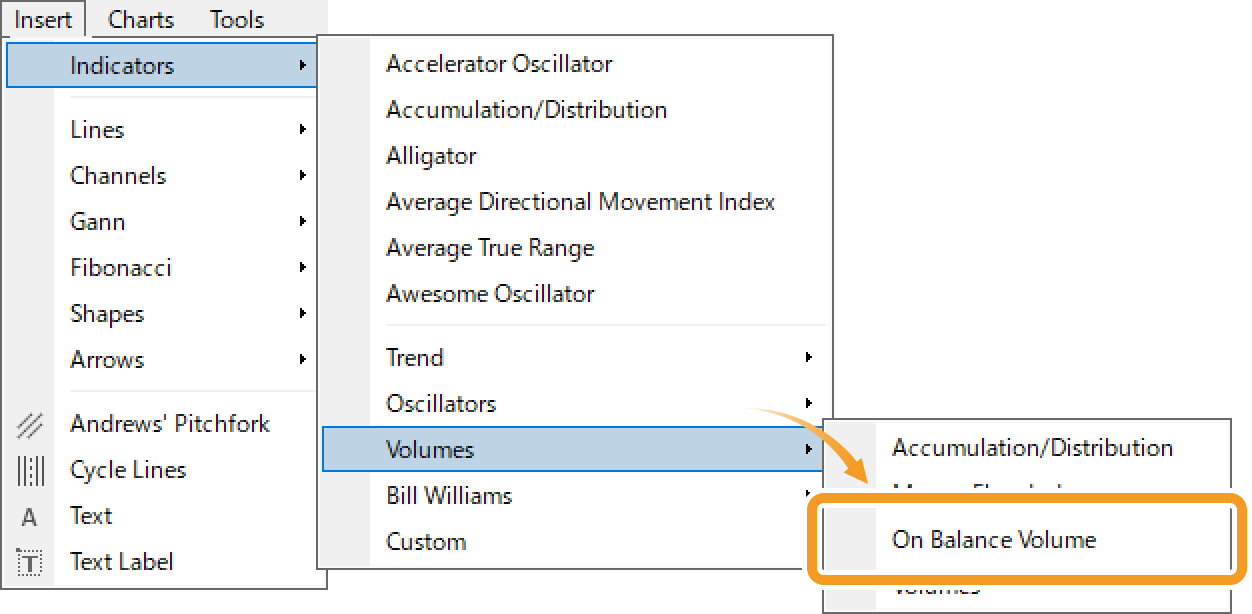
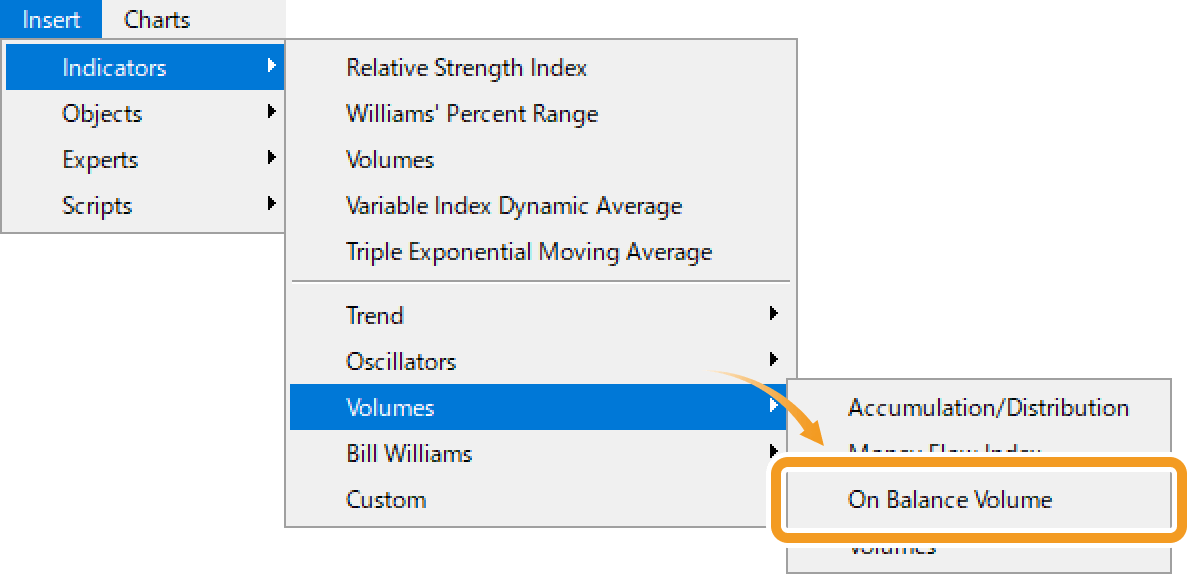
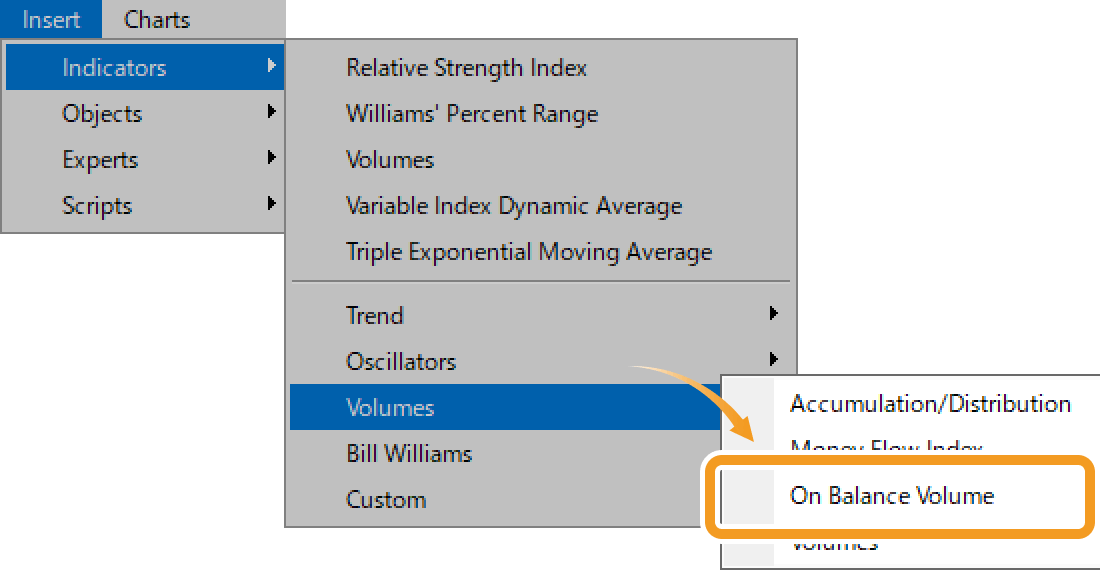
Click "Insert" in the menu. Hover the pointer over "Indicators" > "Volumes" and select "On Balance Volume".
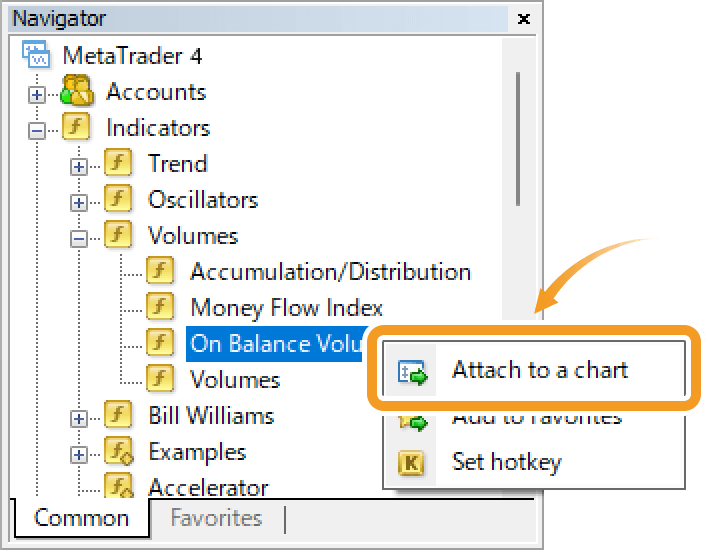
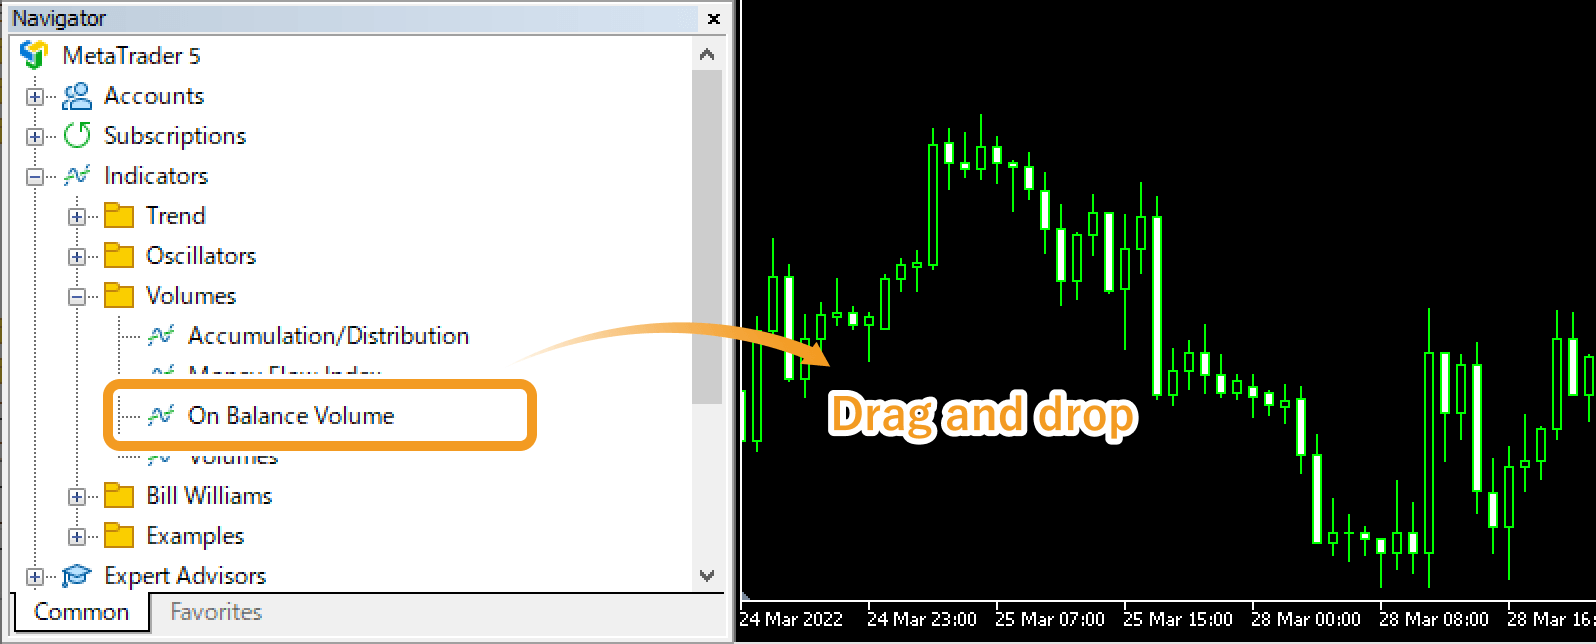
On the Navigator, click on the "+" signs next to "Indicators" and "Volumes". Select "On Balance Volume" and drag it onto the chart you wish to apply it to.
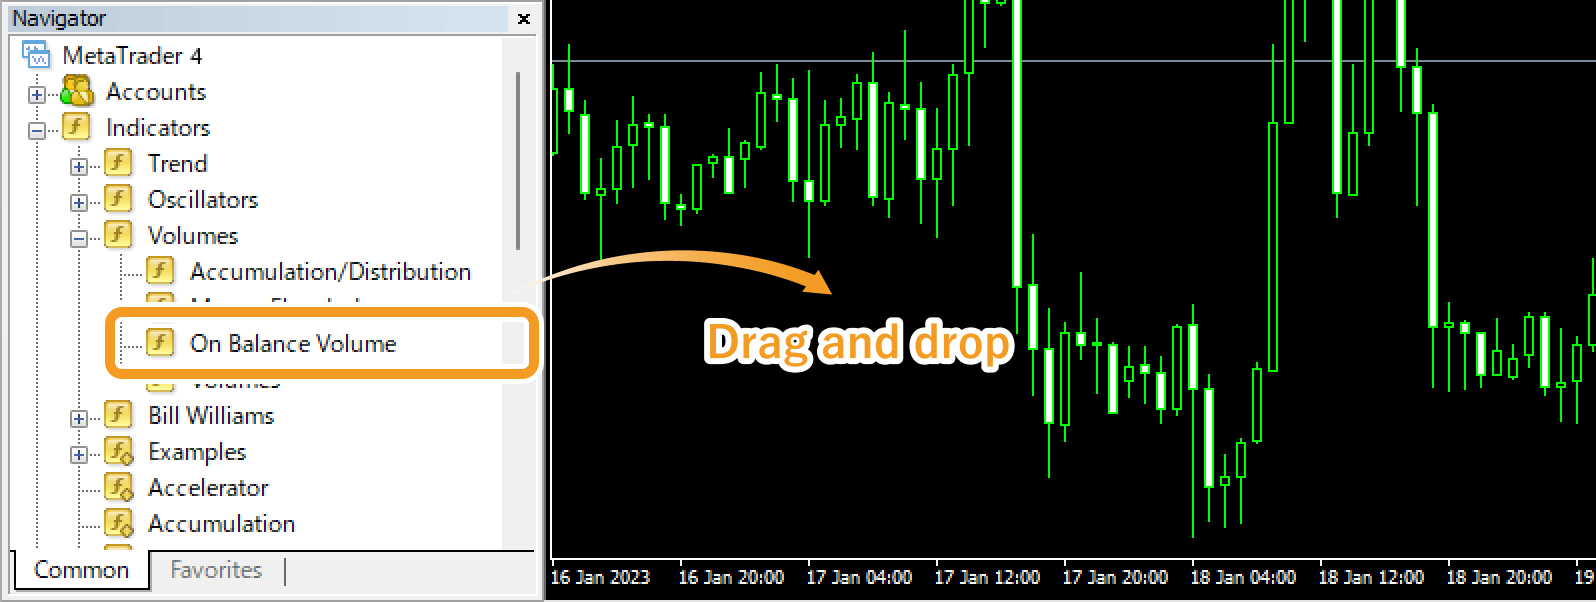
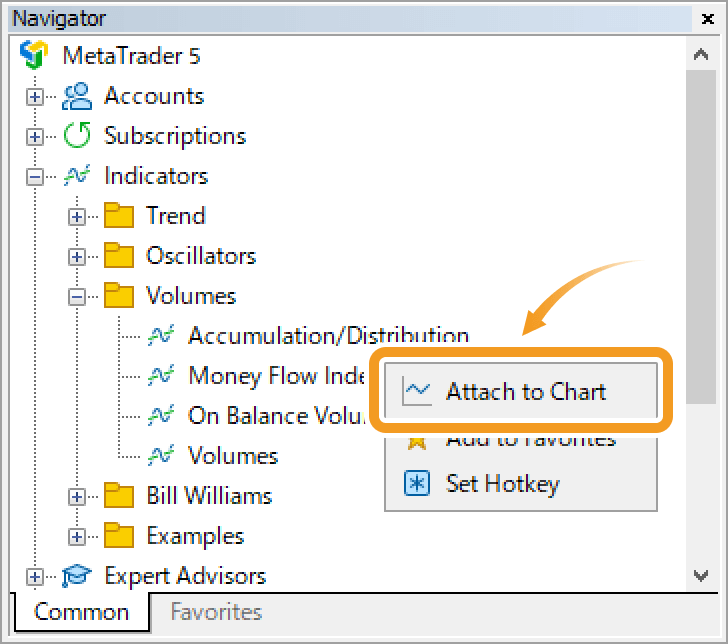
Or, right-click on "On Balance Volume" and select "Attach to a Chart".
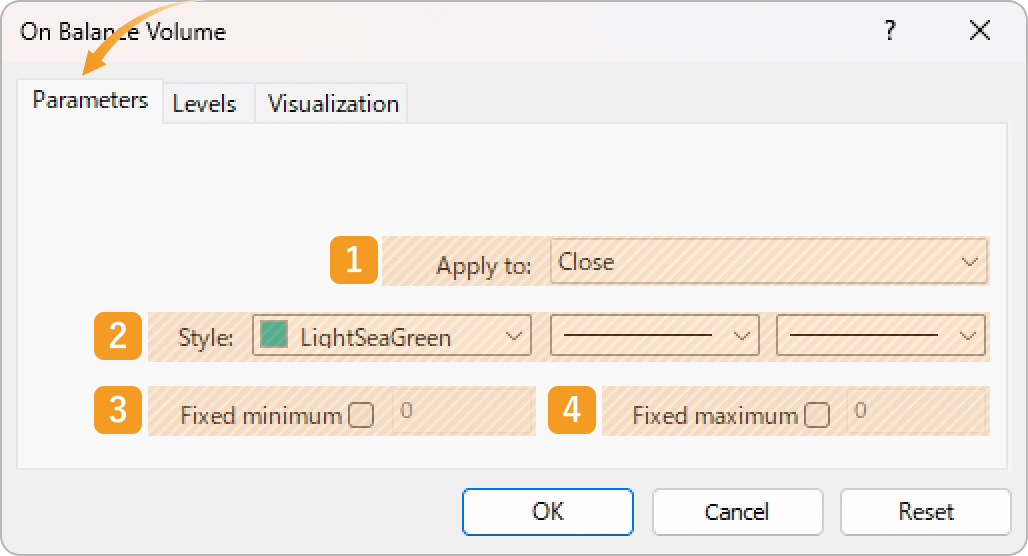
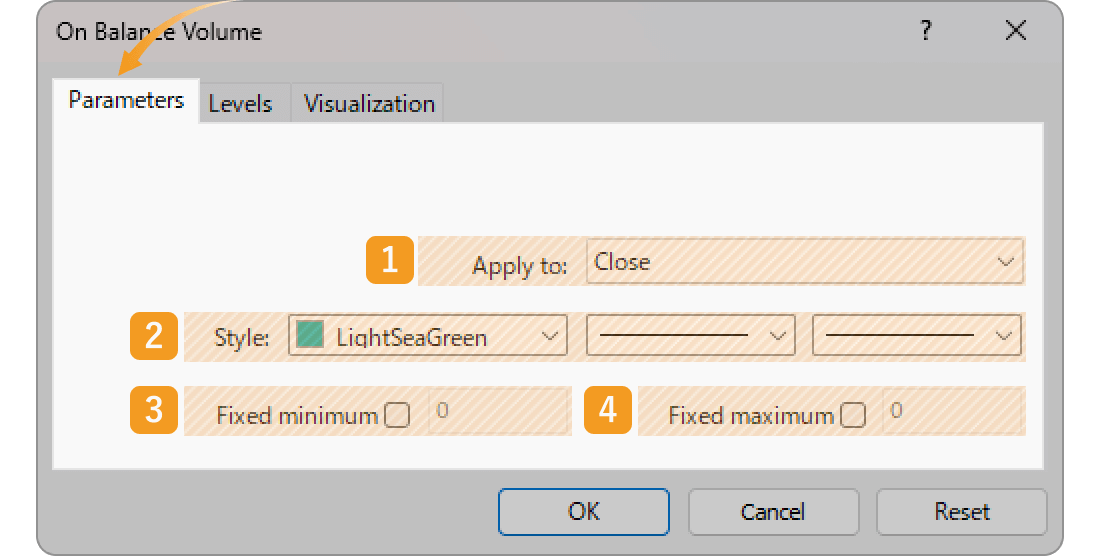
The setting window for OBV will appear. Set the parameters in the "Parameters", "Levels", and "Visualization" tabs and click "OK".
|
Number |
Item name |
Descriptions |
|---|---|---|
|
1 |
Apply to |
Price to use for calculating OBV. Close: close price Open: open price High: high price Low: low price Median Price (HL/2): (high price + low price) ÷2 Typical Price (HLC/3): (high price + low price + close price) ÷3 Weighted Close (HLCC/4): (high price + low price + close price×2) ÷4 |
|
2 |
Style |
Set the color, line type, and line thickness for OBV. |
|
3 |
Fixed minimum |
Set the minimum value for OBV on the sub-window. |
|
4 |
Fixed maximum |
Set the maximum value for OBV on the sub-window. |
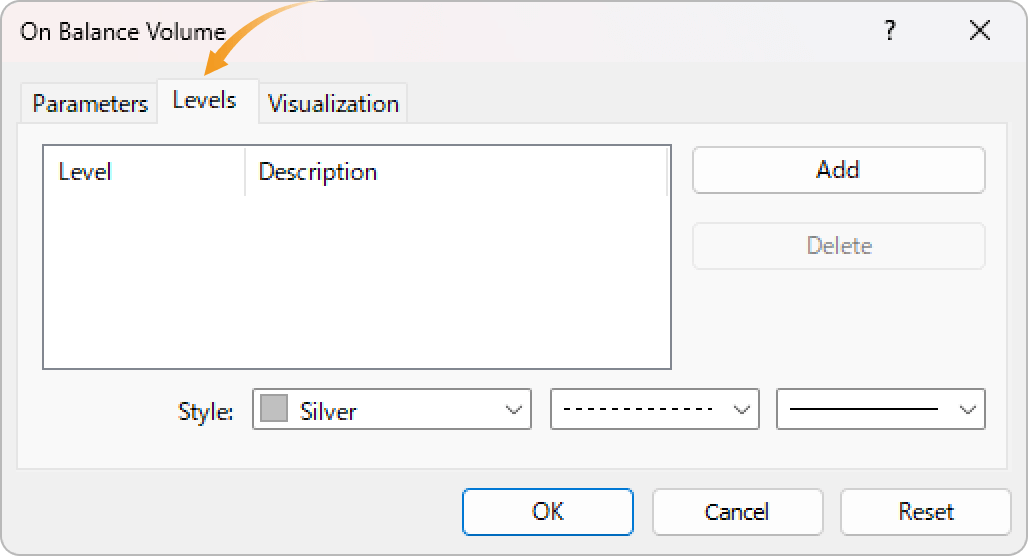
In the OBV sub-window, you can display horizontal lines at the specified levels. If you want to add a horizontal line, click "Add" and enter the number.
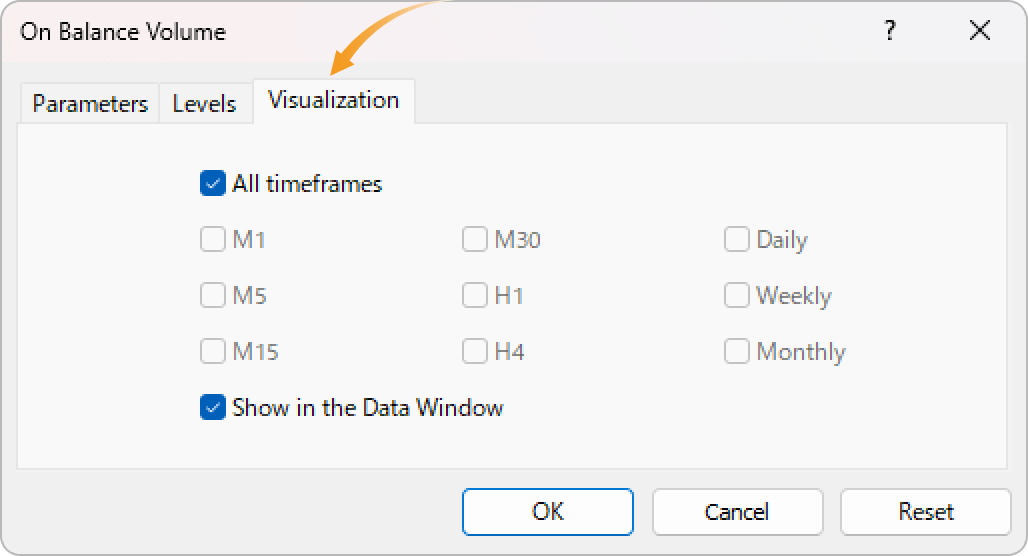
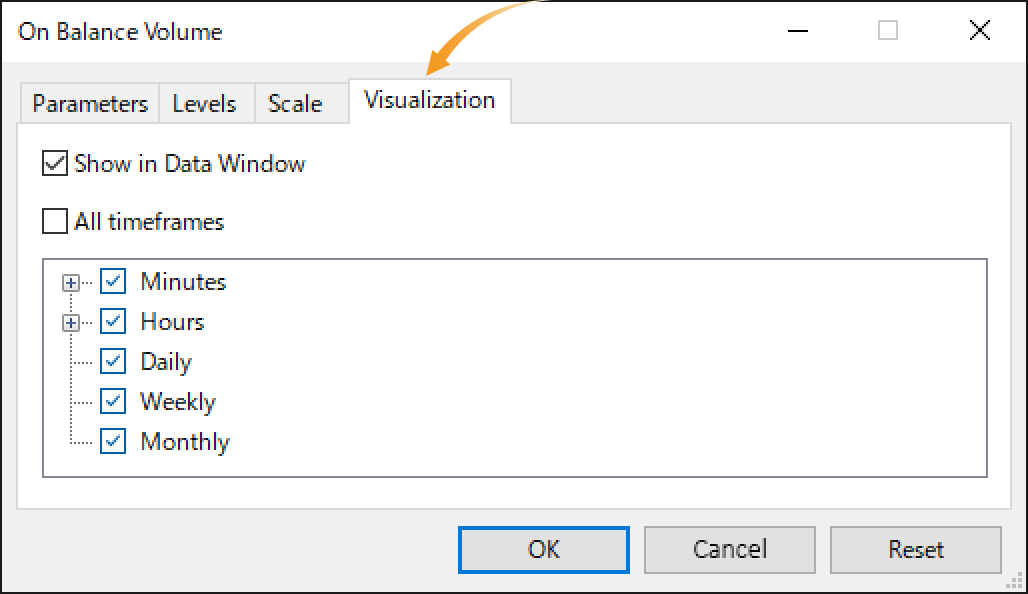
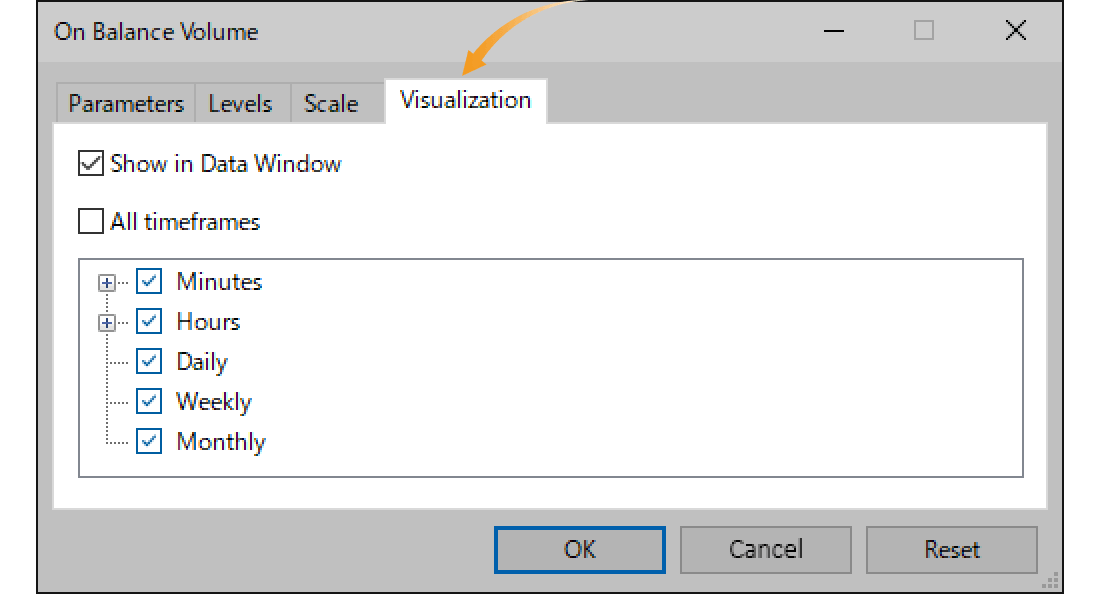
In the "Visualization" tab, you can set the timeframes to display OBV. As OBV can only be displayed in a sub-window, it will be displayed in the sub-window even if "Show in the Data Window" is unchecked.
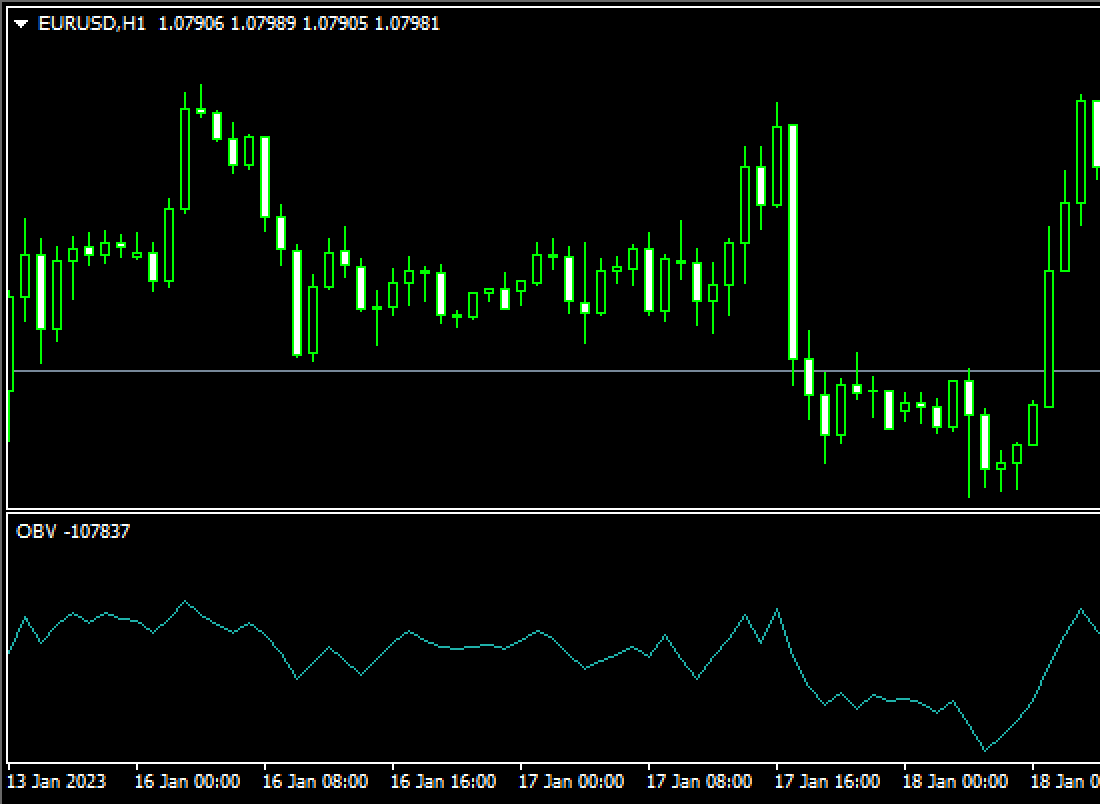
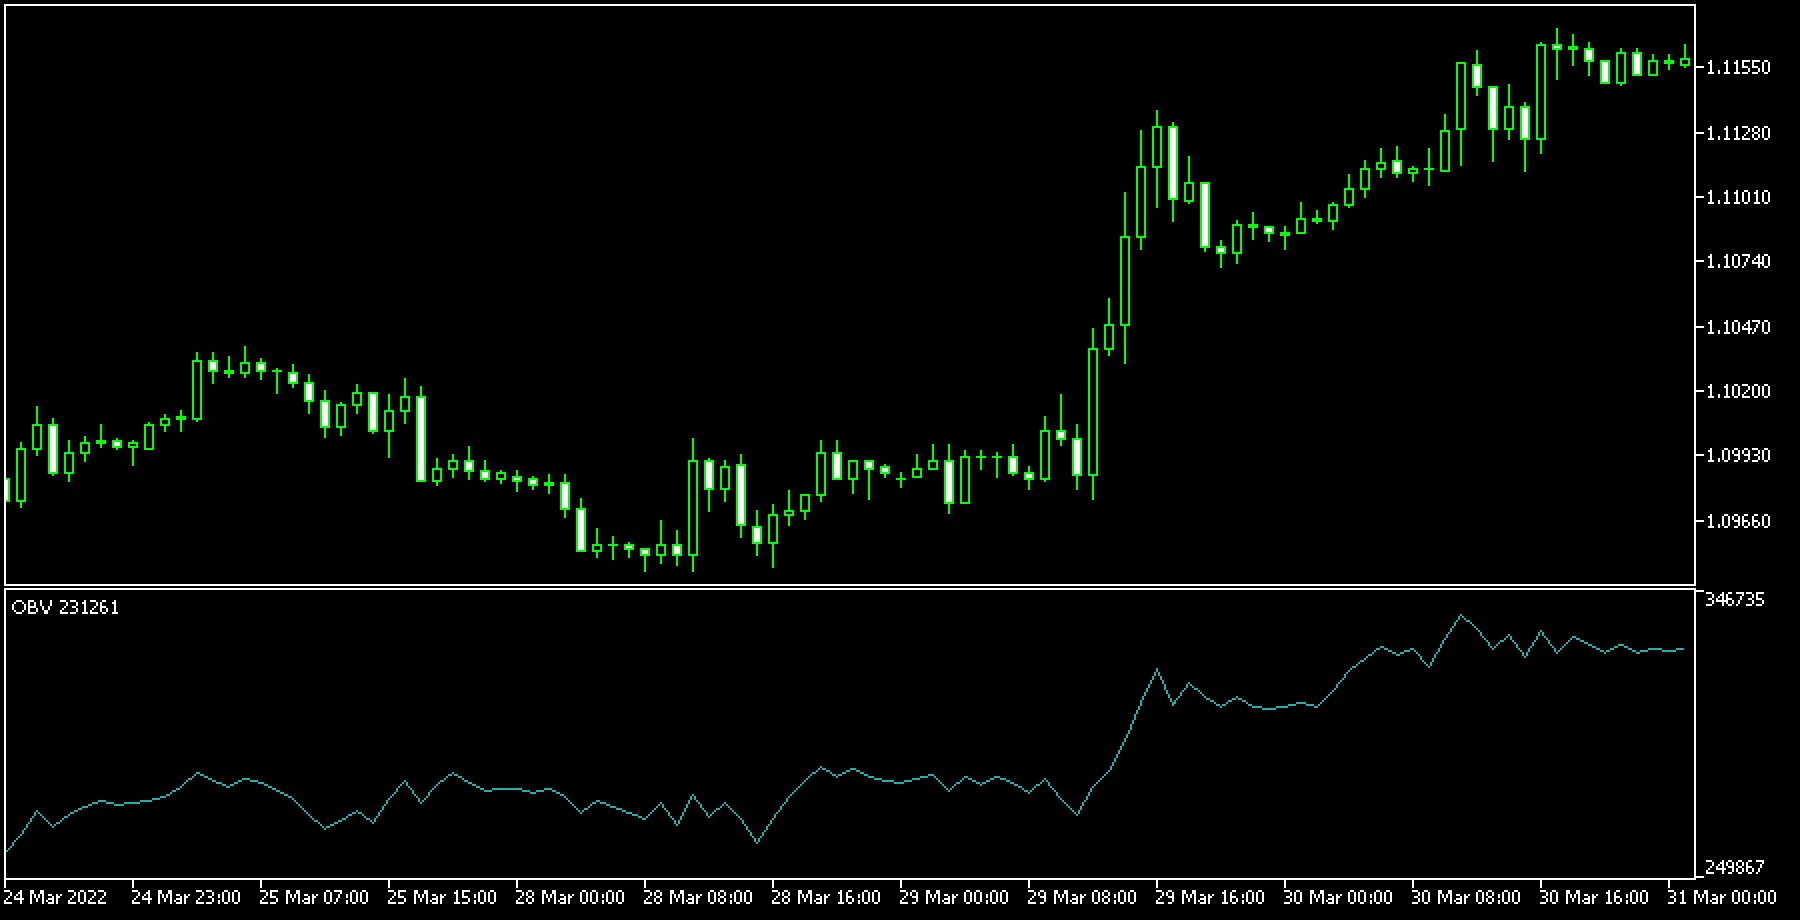
OBV will be displayed on the sub-window of chart.
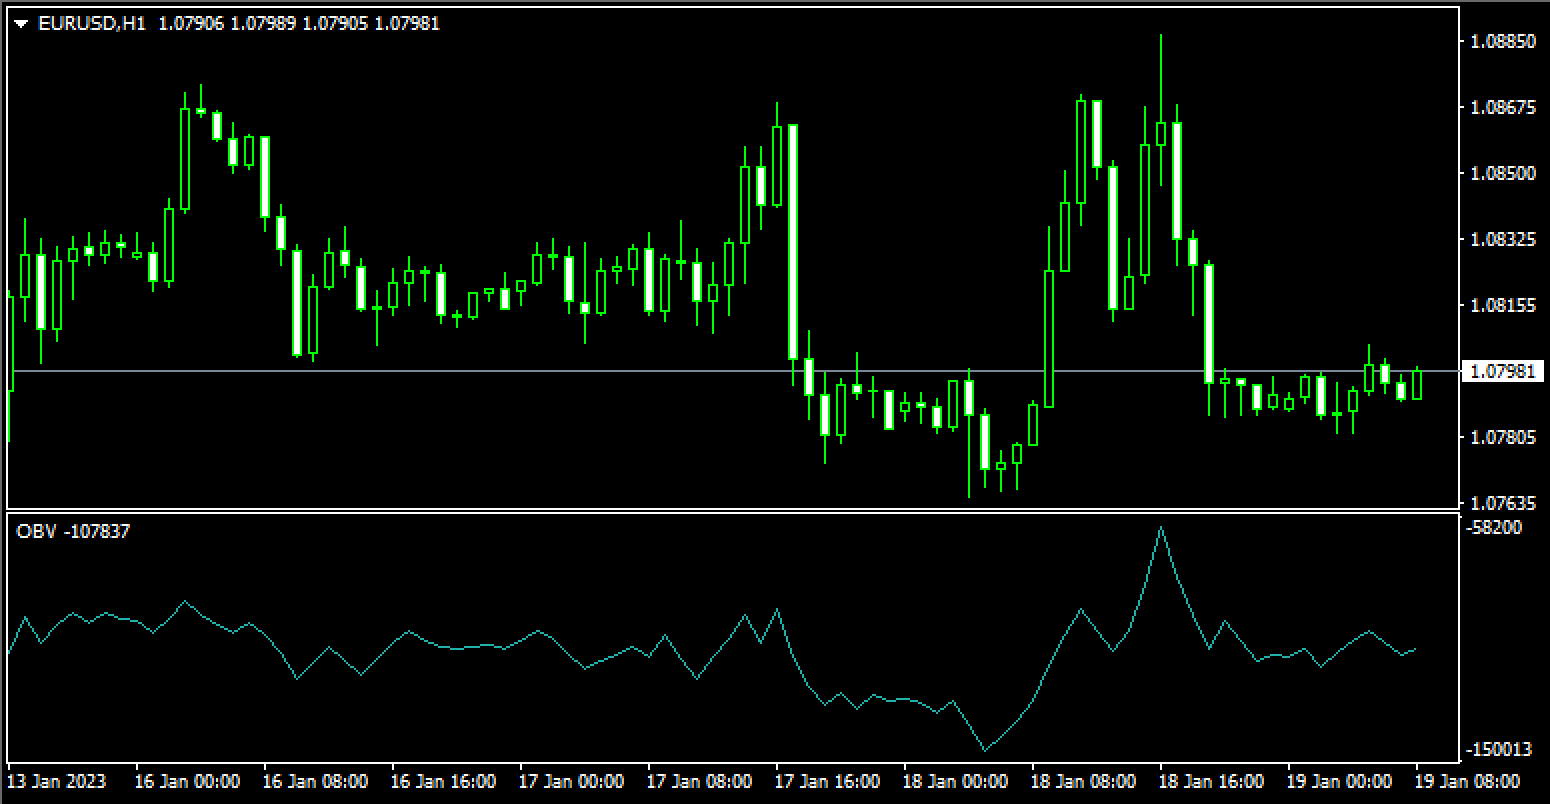
In general, indicators can be grouped into two categories: trend and oscillator indicators. These indicators are designed to focus on price fluctuations. On the other hand, OBV looks at volume in addition to price fluctuations. Like OBV, indicators that focus on volume are classified as volume-based.
OBV can be set up from the menu or the Navigator.
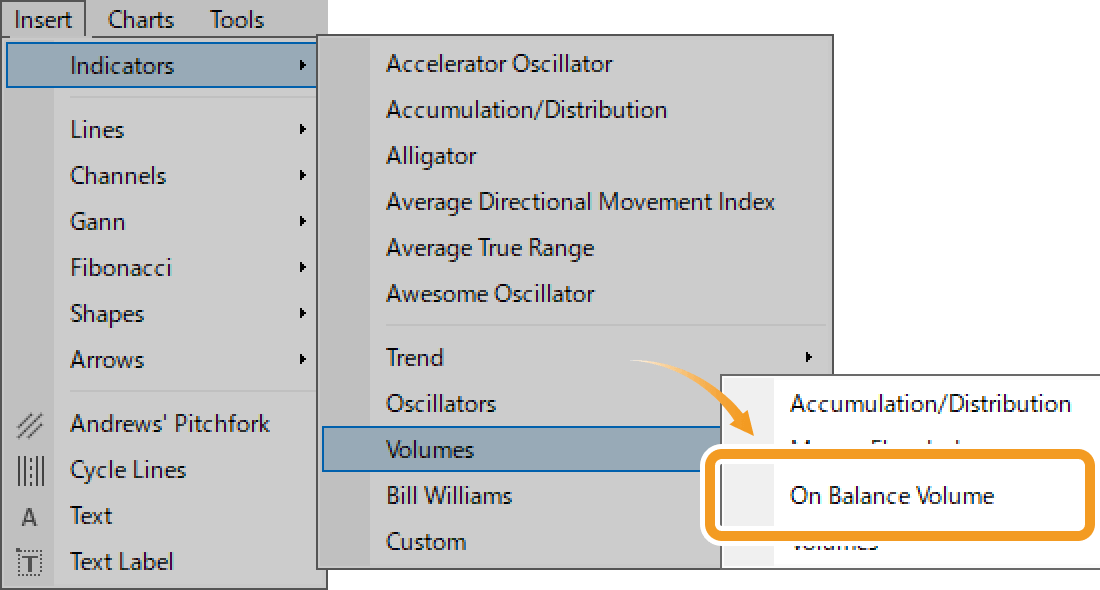
Click "Insert" in the menu. Hover the pointer over "Indicators" > "Volumes" and select "On Balance Volume".
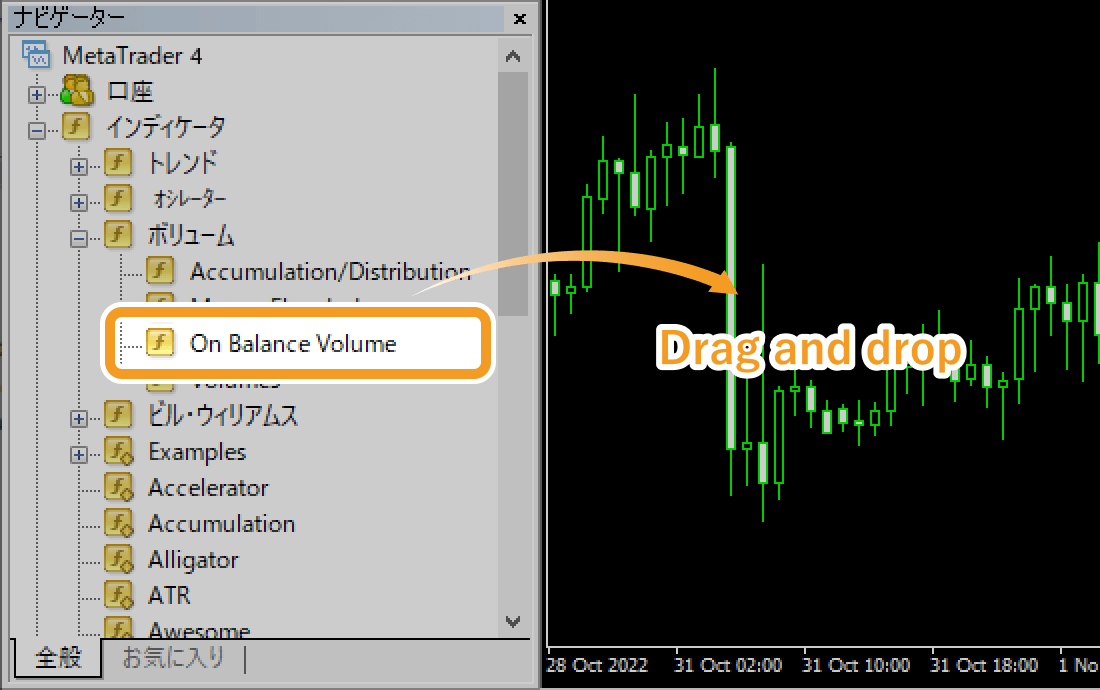
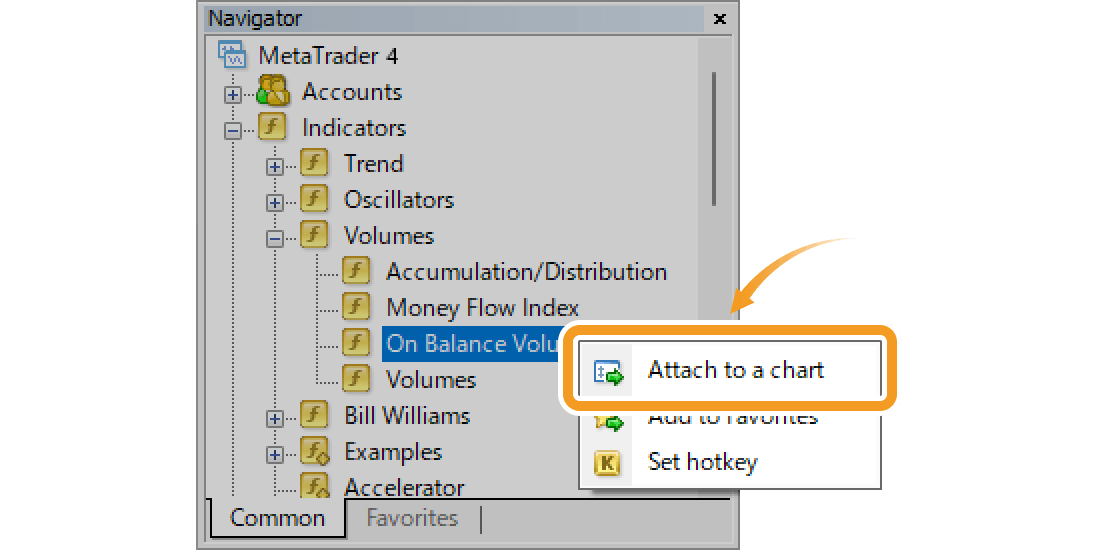
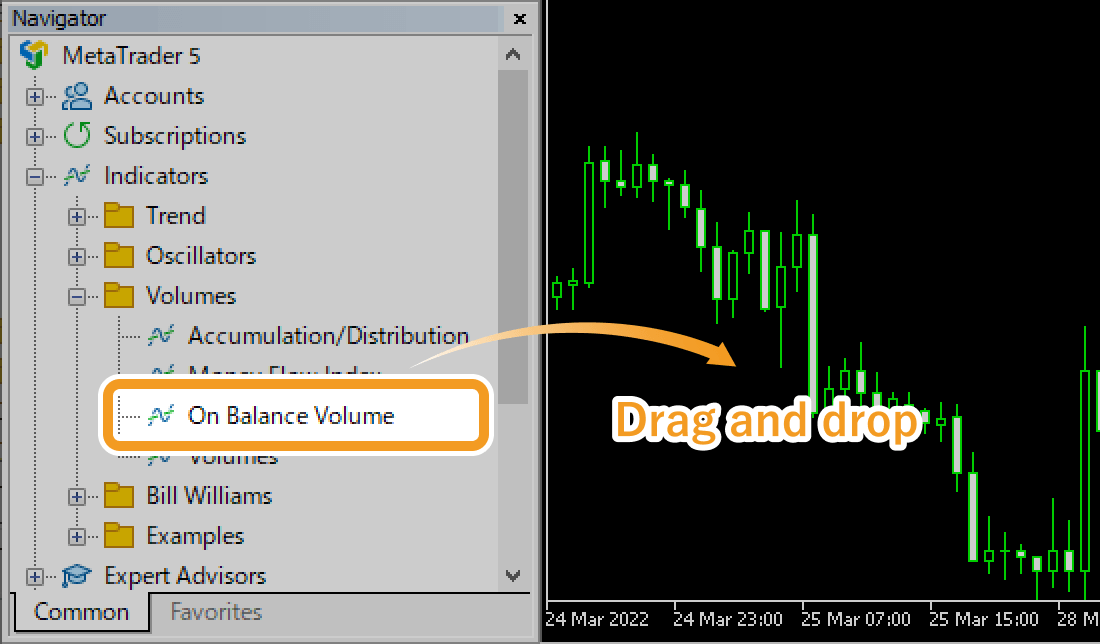
On the Navigator, go to "Indicators" and click on the "+" sign next to "Volumes". Select "On Balance Volume" and drag it onto the chart you wish to apply it to.
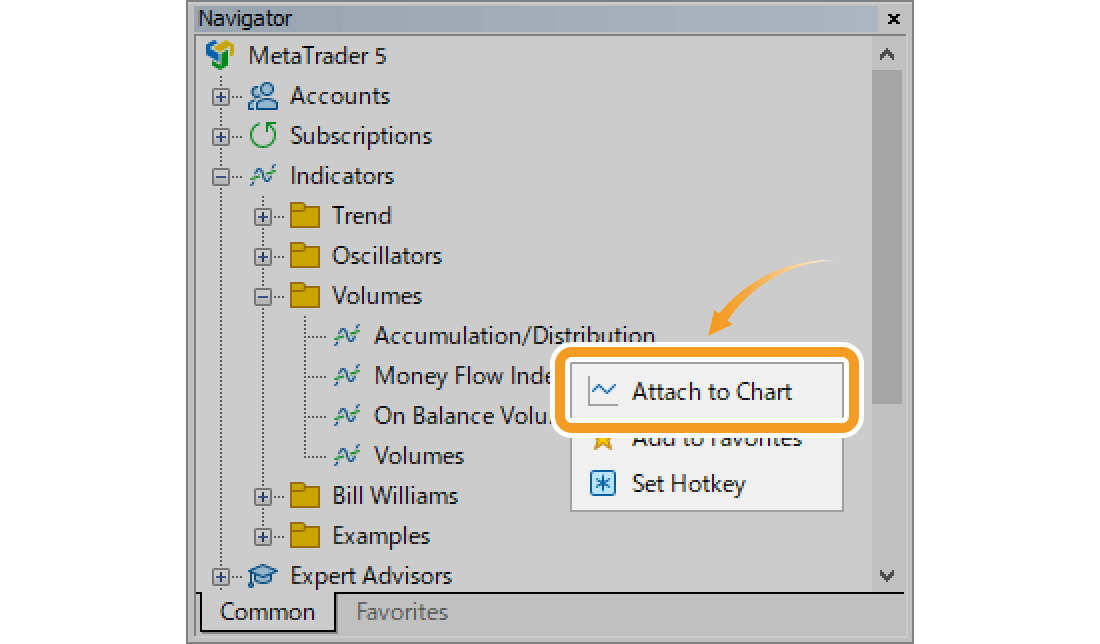
Or, right-click on "On Balance Volume" and select "Attach to Chart".
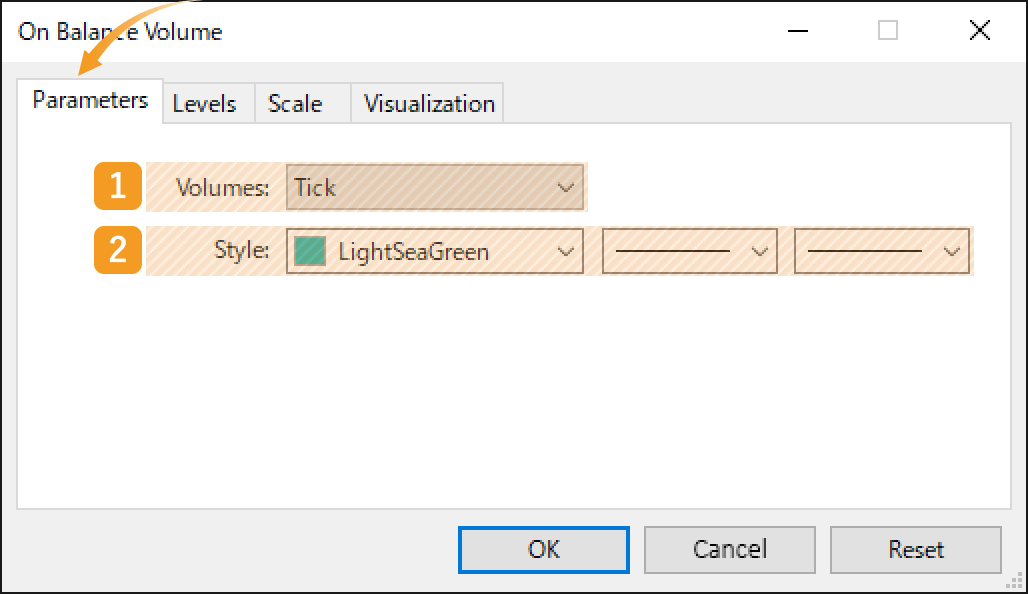
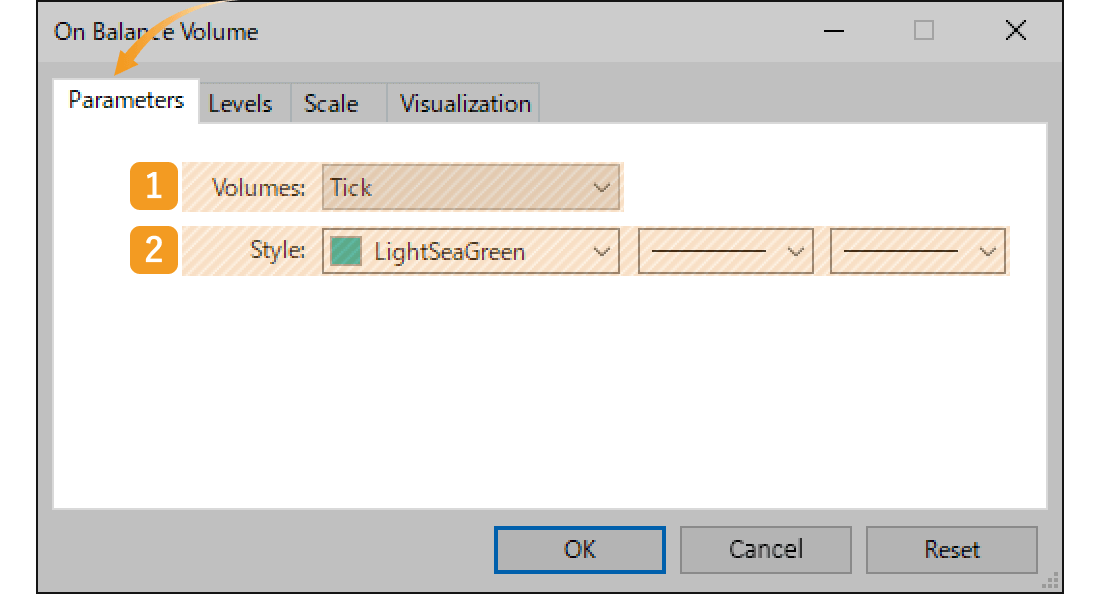
The setting window for OBV will appear. Set the parameters in the "Parameters", "Levels", "Scale", and "Visualization" tab and click "OK".
|
Number |
Item name |
Descriptions |
|---|---|---|
|
1 |
Volume |
Specify the data to use for OBV. Volume for forex and CFD symbols not traded in the exchange cannot be calculated, in which case, the system will use the tick volume instead of volume.
|
|
2 |
Style |
Set the color, line type, and line thickness for OBV. |
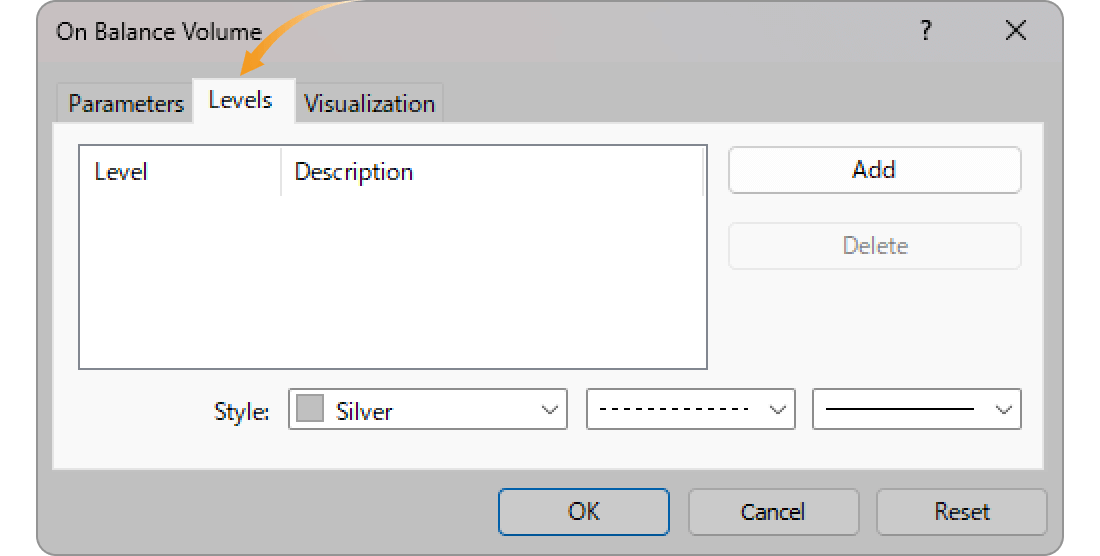
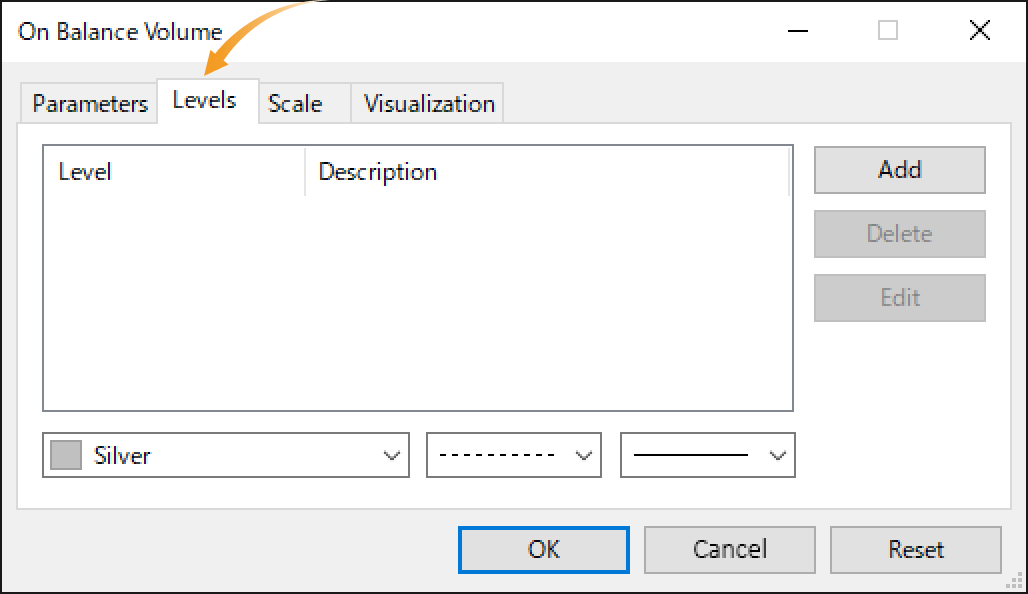
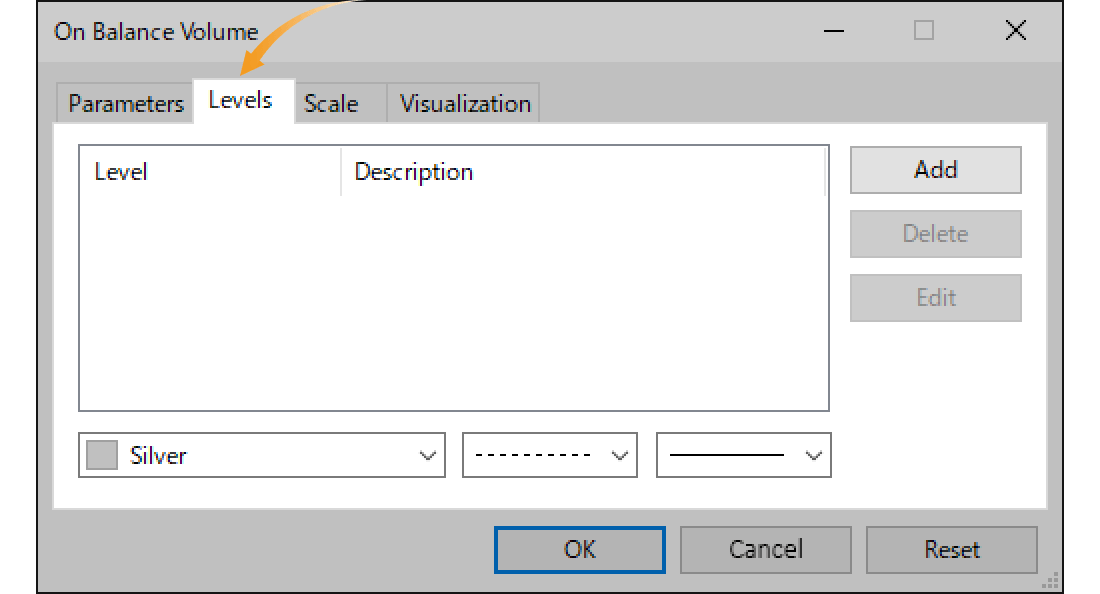
In the OBV sub-window, you can display horizontal lines at the specified levels. If you want to add a horizontal line, click "Add" and enter the number.
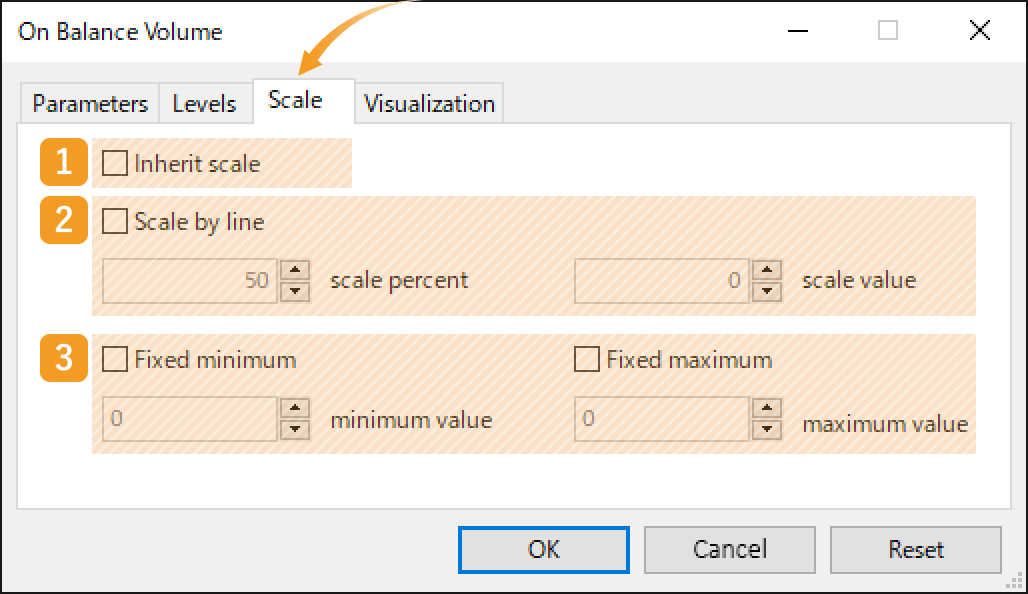
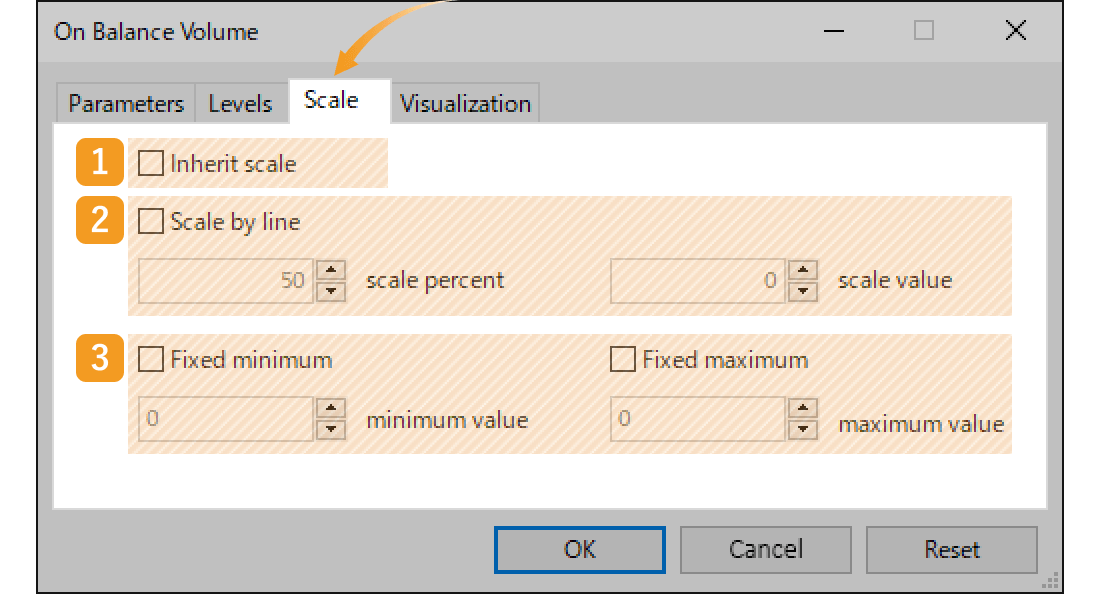
Set the scale of the sub-window for OBV.
|
Number |
Item name |
Descriptions |
|---|---|---|
|
1 |
Inherit scale |
Check this box if you want to inherit the scale of the previous indicator when displaying multiple indicators on the same sub-window. |
|
2 |
Scale by line |
Specify where you want the OBV to show up on the sub-window. If you set the scale percentage to "50" and the scale value to "0", the scale of the vertical axis will be adjusted so that the scale value of "0" will be set at the 50% mark (max value is 100%). |
|
3 |
Fixed minimum/maximum |
Set the minimum/maximum values for OBV on the sub-window. |
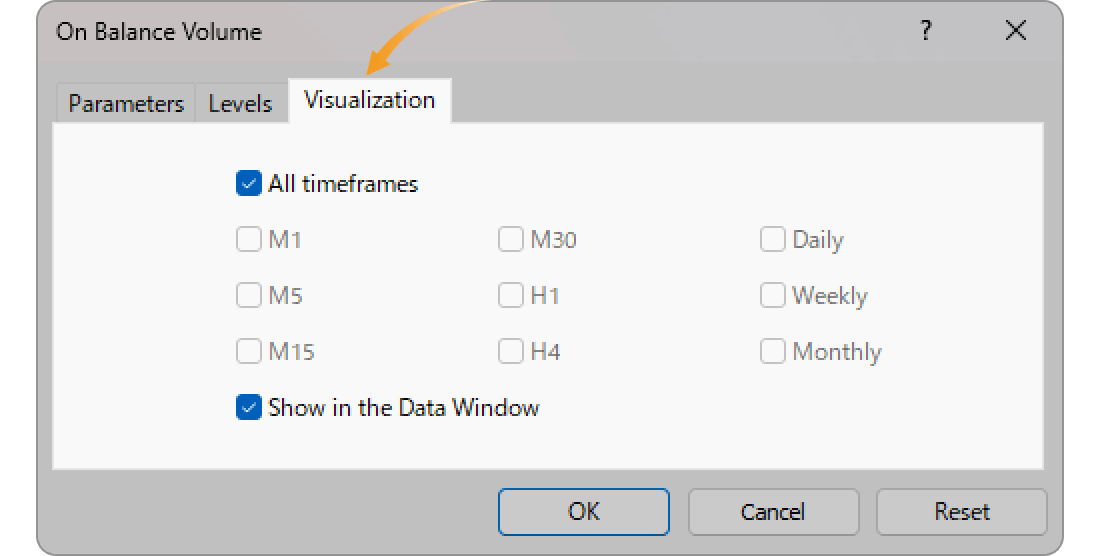
In the "Visualization" tab, you can set the timeframes to display OBV. As OBV can only be displayed in a sub-window, it will still be displayed in the sub-window even if "Show in Data Window" is unchecked.
OBV will be displayed on the sub-window of chart.
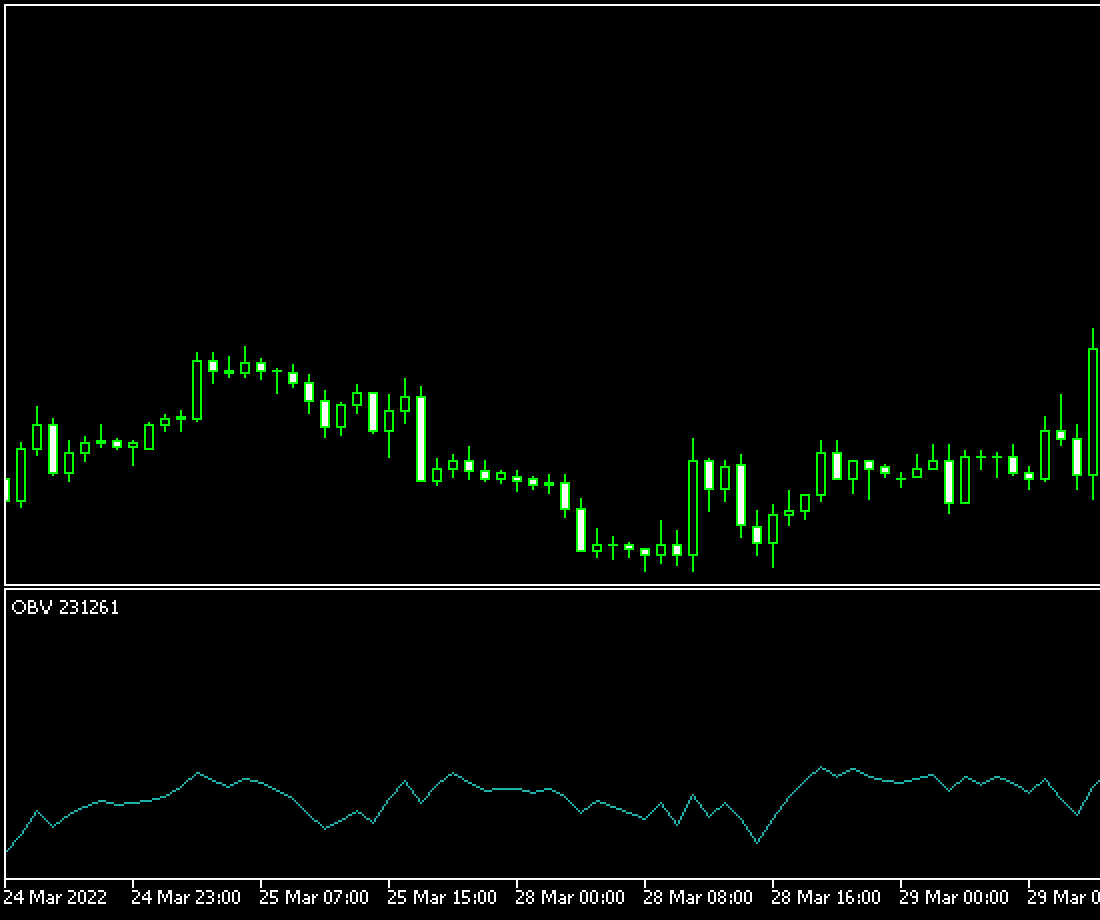
In general, indicators can be grouped into two categories: trend and oscillator indicators. These indicators are designed to focus on price fluctuations. On the other hand, OBV looks at volume in addition to price fluctuations. Like OBV, indicators that focus on volume are classified as volume-based.
Was this article helpful?
0 out of 0 people found this article helpful.
Thank you for your feedback.