- Features
-
Services/ProductsServices/ProductsServices/Products

Learn more about the retail trading conditions, platforms, and products available for trading that FXON offers as a currency broker.
You can't start without it.
Trading Platforms Trading Platforms Trading Platforms
Features and functionality comparison of MetaTrader 4/5, and correspondence table of each function by OS
Two account types to choose
Trading Account Types Trading Account Types Trading Account Types
Introducing FXON's Standard and Elite accounts.
close close

-
SupportSupportSupport

Support information for customers, including how to open an account, how to use the trading tools, and a collection of QAs from the help desk.
Recommended for beginner!
Account Opening Account Opening Account Opening
Detailed explanation of everything from how to open a real account to the deposit process.
MetaTrader4/5 User Guide MetaTrader4/5 User Guide MetaTrader4/5 User Guide
The most detailed explanation of how to install and operate MetaTrader anywhere.
FAQ FAQ FAQ
Do you have a question? All the answers are here.
Coming Soon
Glossary Glossary GlossaryGlossary of terms related to trading and investing in general, including FX, virtual currencies and CFDs.
News News News
Company and License Company and License Company and License
Sitemap Sitemap Sitemap
Contact Us Contact Us Contact Us
General, personal information and privacy inquiries.
close close

- Promotion
- Trader's Market
- Partner
-
close close
Learn more about the retail trading conditions, platforms, and products available for trading that FXON offers as a currency broker.
You can't start without it.
Features and functionality comparison of MetaTrader 4/5, and correspondence table of each function by OS
Two account types to choose
Introducing FXON's Standard and Elite accounts.
Support information for customers, including how to open an account, how to use the trading tools, and a collection of QAs from the help desk.
Recommended for beginner!
Detailed explanation of everything from how to open a real account to the deposit process.
The most detailed explanation of how to install and operate MetaTrader anywhere.
Do you have a question? All the answers are here.
Coming Soon
Glossary of terms related to trading and investing in general, including FX, virtual currencies and CFDs.
General, personal information and privacy inquiries.
Useful information for trading and market information is posted here. You can also view trader-to-trader trading performance portfolios.
Find a trading buddy!
Share trading results among traders. Share operational results and trading methods.
- Legal Documents TOP
- Client Agreement
- Risk Disclosure and Warning Notice
- Order and Execution Policy
- Complaints Procedure Policy
- AML/CFT and KYC Policy
- Privacy Policy
- eKYC Usage Policy
- Cookies Policy
- Website Access and Usage Policy
- Introducer Agreement
- Business Partner Agreement
- VPS Service Terms and Condition


This article was :
published
updated
On MetaTrader4 (MT4) / MetaTrader5 (MT5), you can adjust the chart scale to show the part you want to see. If you move the horizontal time axis left and right, the scale on the vertical axis will change accordingly. You can also choose to fix the scale for the vertical axis, fix the scale for both axes, or expand/shrink the scale to facilitate chart analysis.
Here we will look at how to change the chart scale.
Switch between MT4/MT5 tabs to check the steps for each.
Step 1
Select "Properties" from the menu or the chart's context menu. You can't set up the scale for all charts at once, so set it up for each chart.
The color for the scale can be set in the "Foreground" parameter of "Properties". If it is set to transparent or the same as the "Background" color, the scale will be hidden.
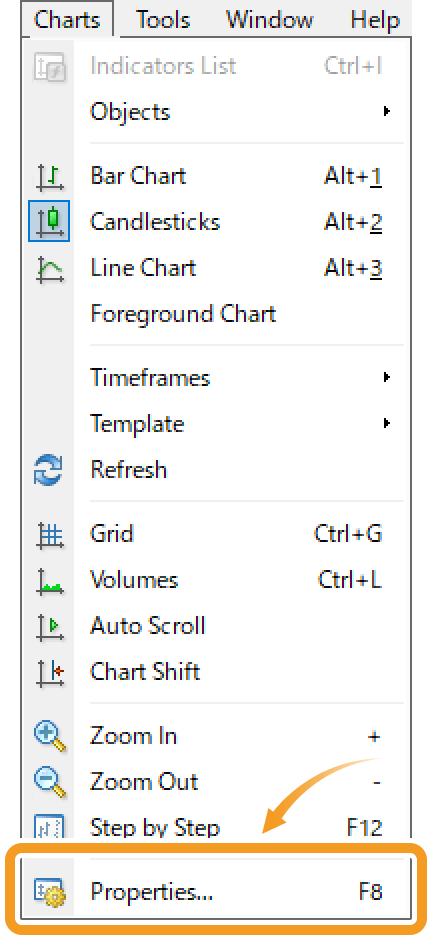
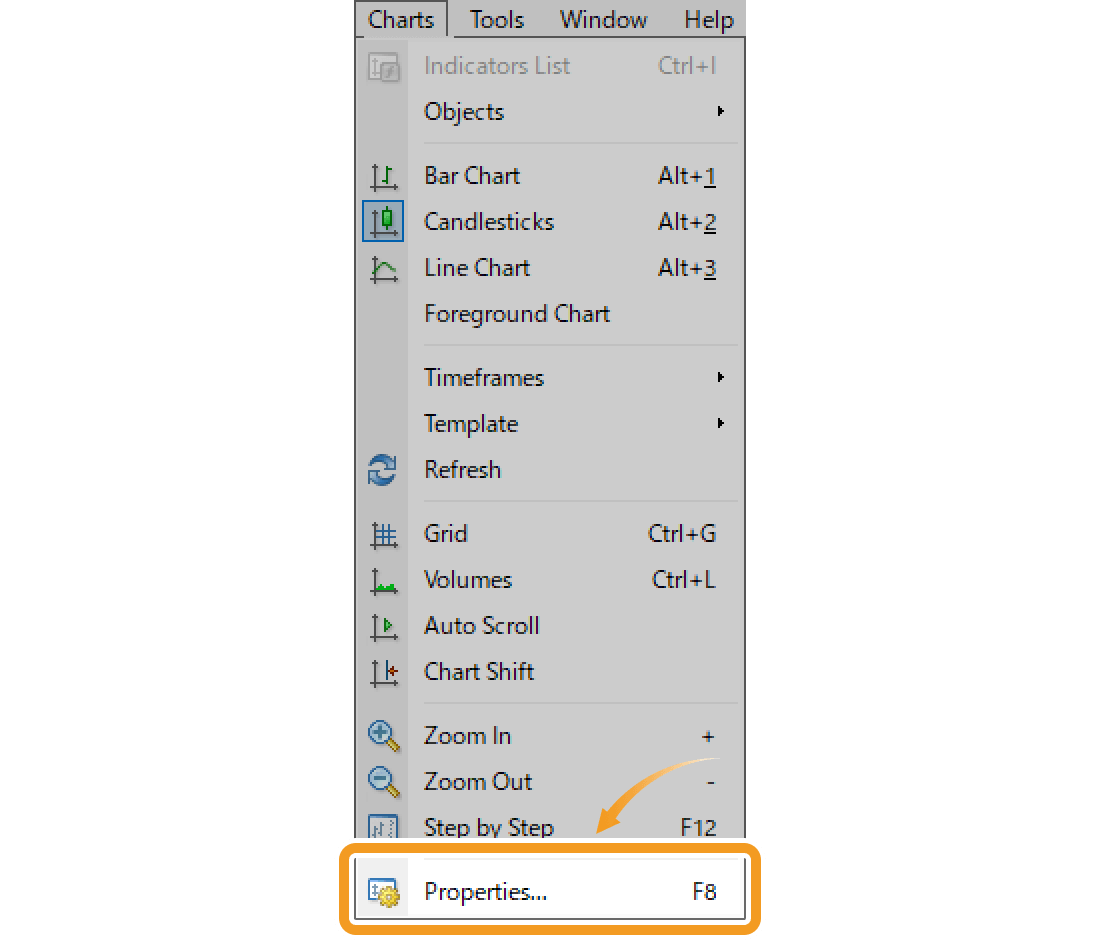
Select "Properties" from the menu
Click "Charts" in the menu and select "Properties".
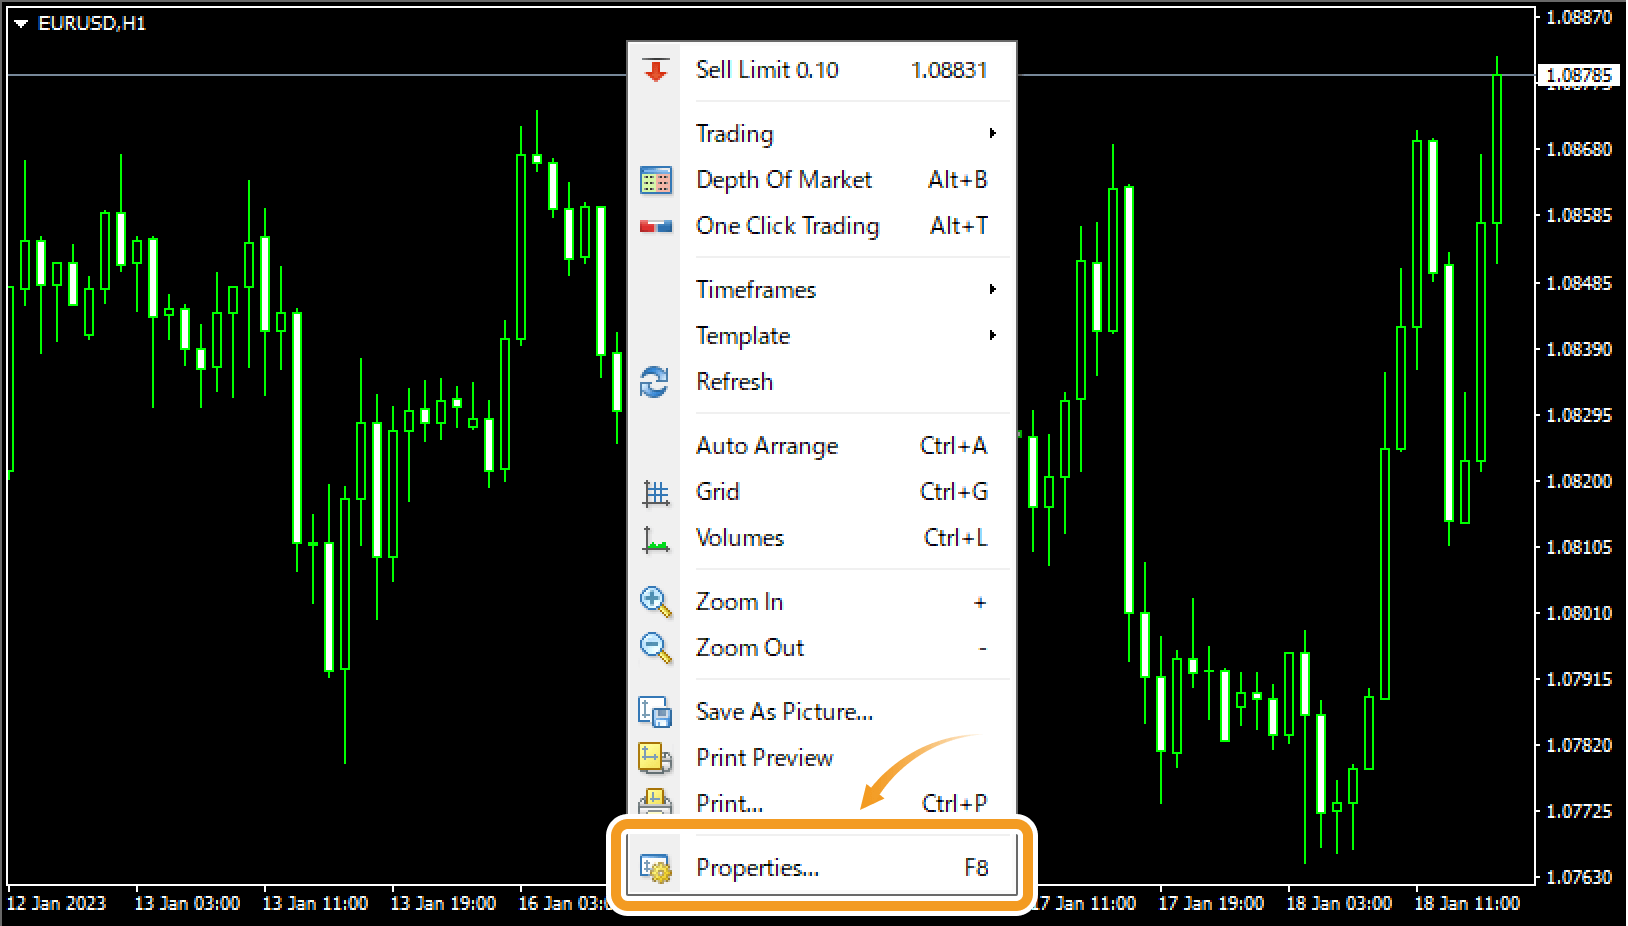
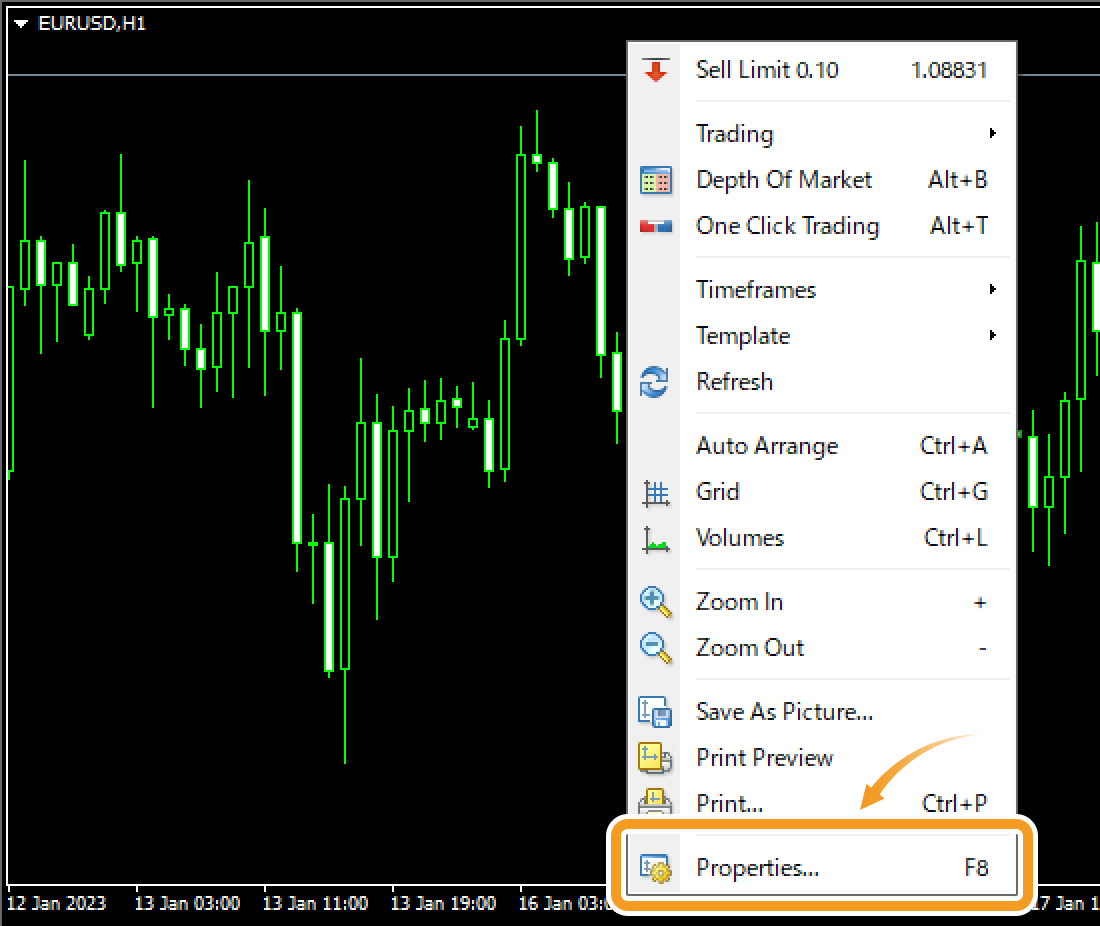
Select "Properties" from the chart's context menu
Right-click on the chart you wish to fix the scale for vertical axis, and select "Properties".
Step 2
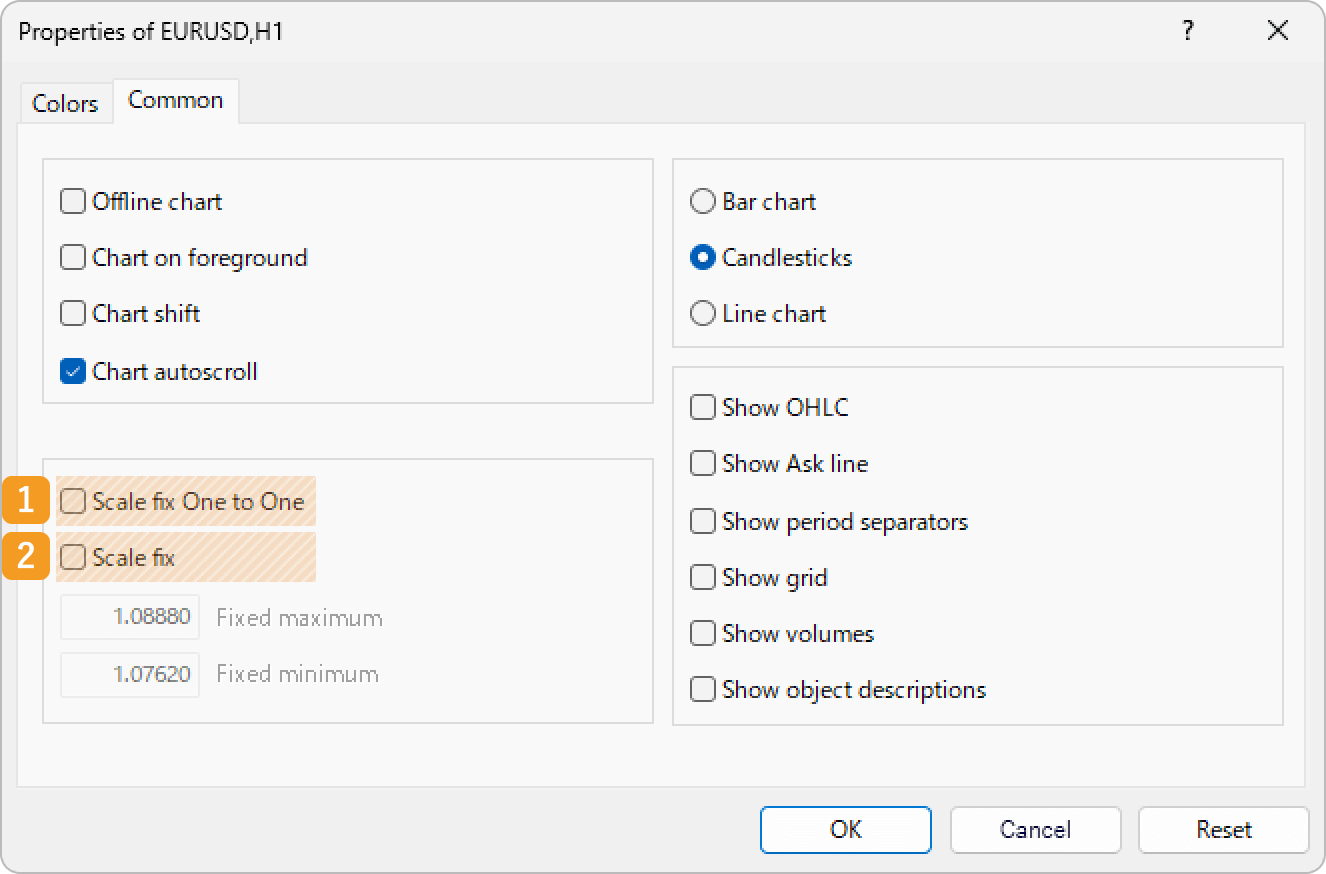
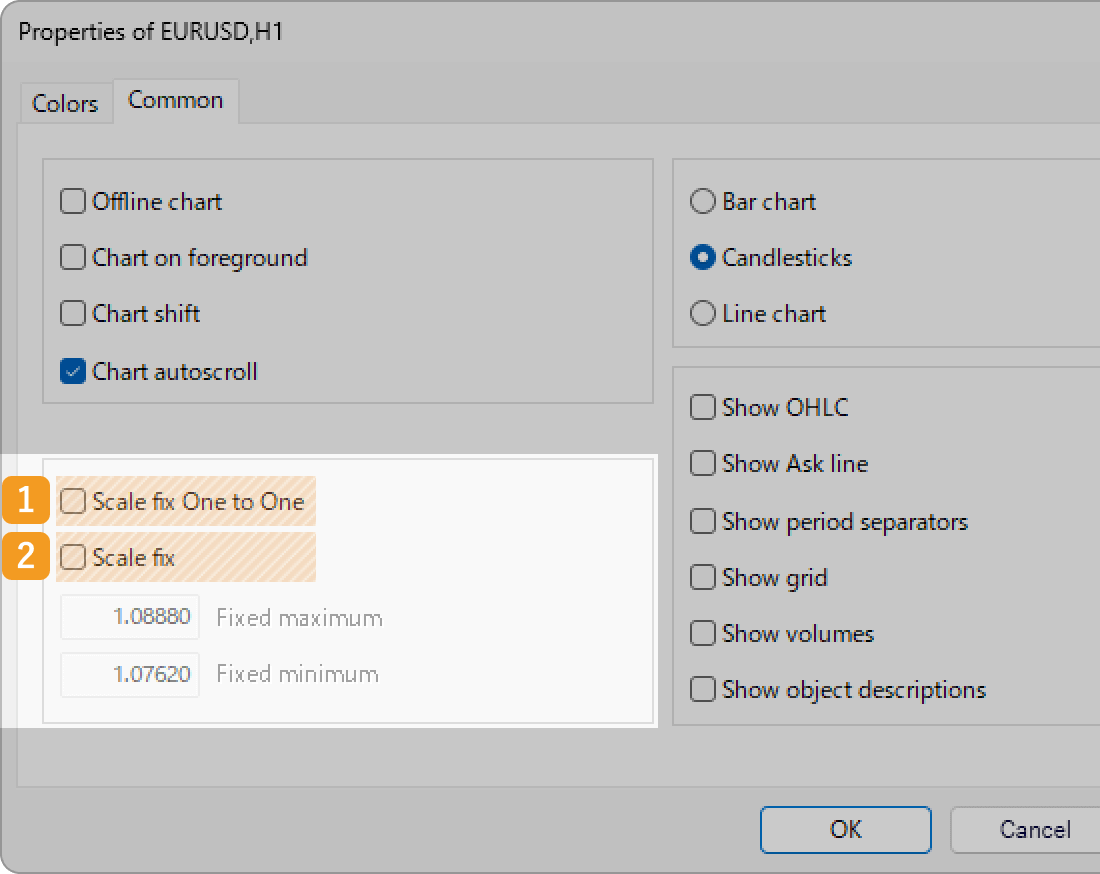
In the "Common" tab, adjust the chart scale and click "OK".
|
Number |
Item name |
Descriptions |
|---|---|---|
|
1 |
Scale fix One to One |
Check the "Scale fix One to One" to set the horizontal (time) and vertical (price) scales evenly. When you check the "Scale fix One to One" box, the "Scale fix" box will automatically be checked as well since the vertical scale will be fixed. |
|
2 |
Scale fix |
Check the "Scale fix" box to set the range for vertical axis (price). Set the maximum value of the vertical axis in "Fixed maximum" and the minimum value in "Fixed minimum". |
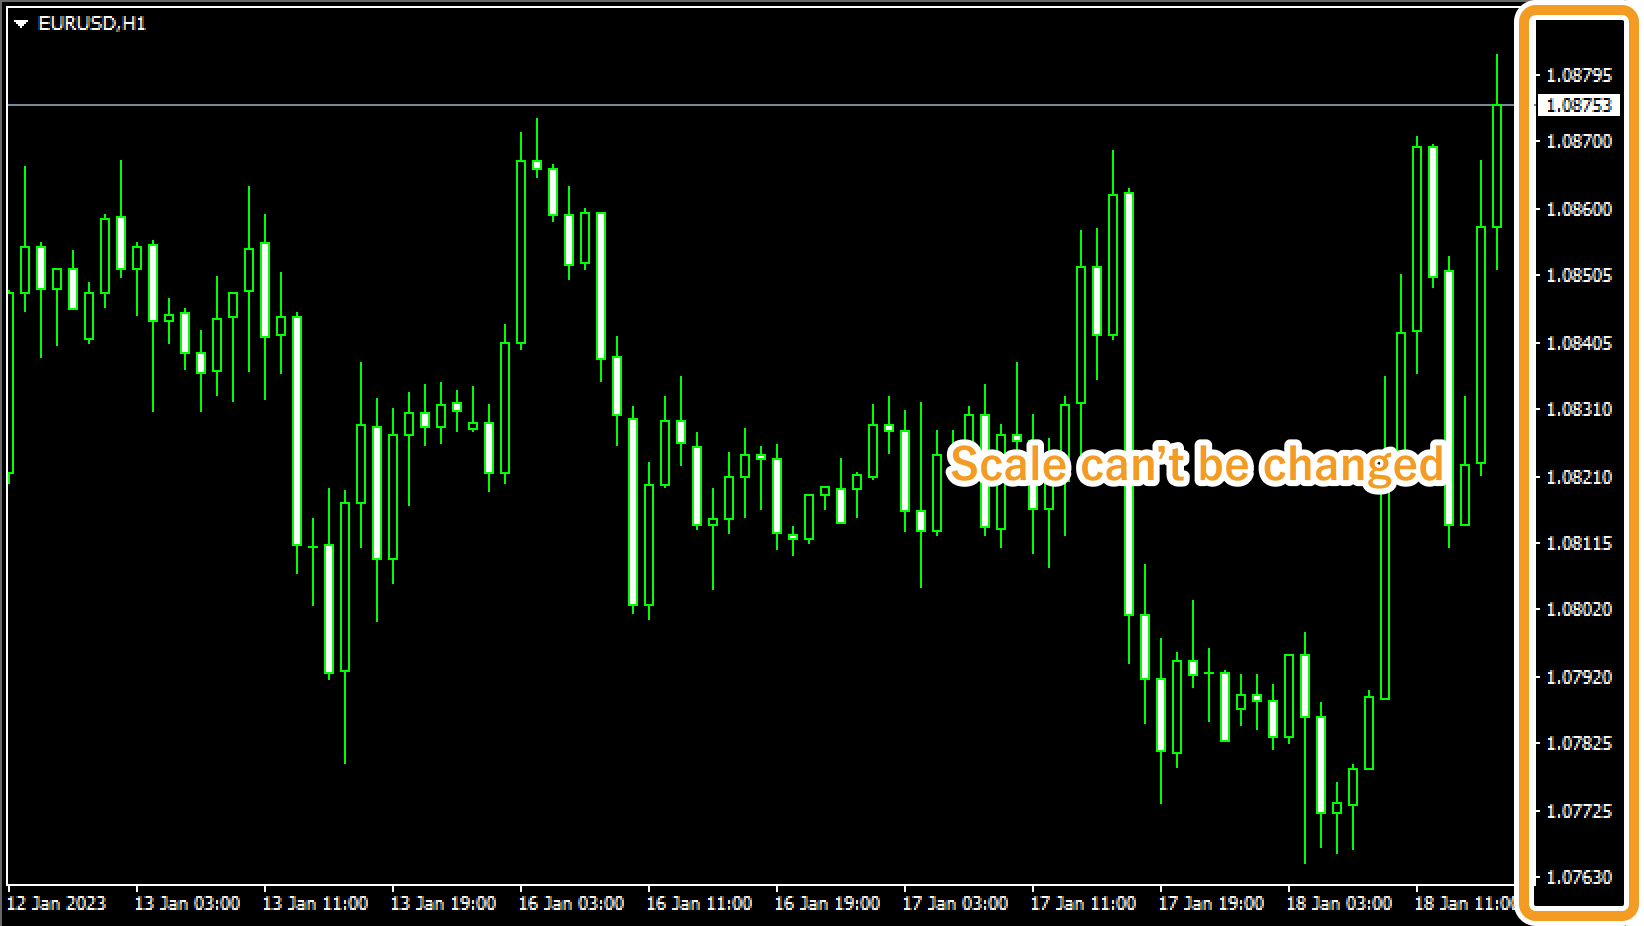
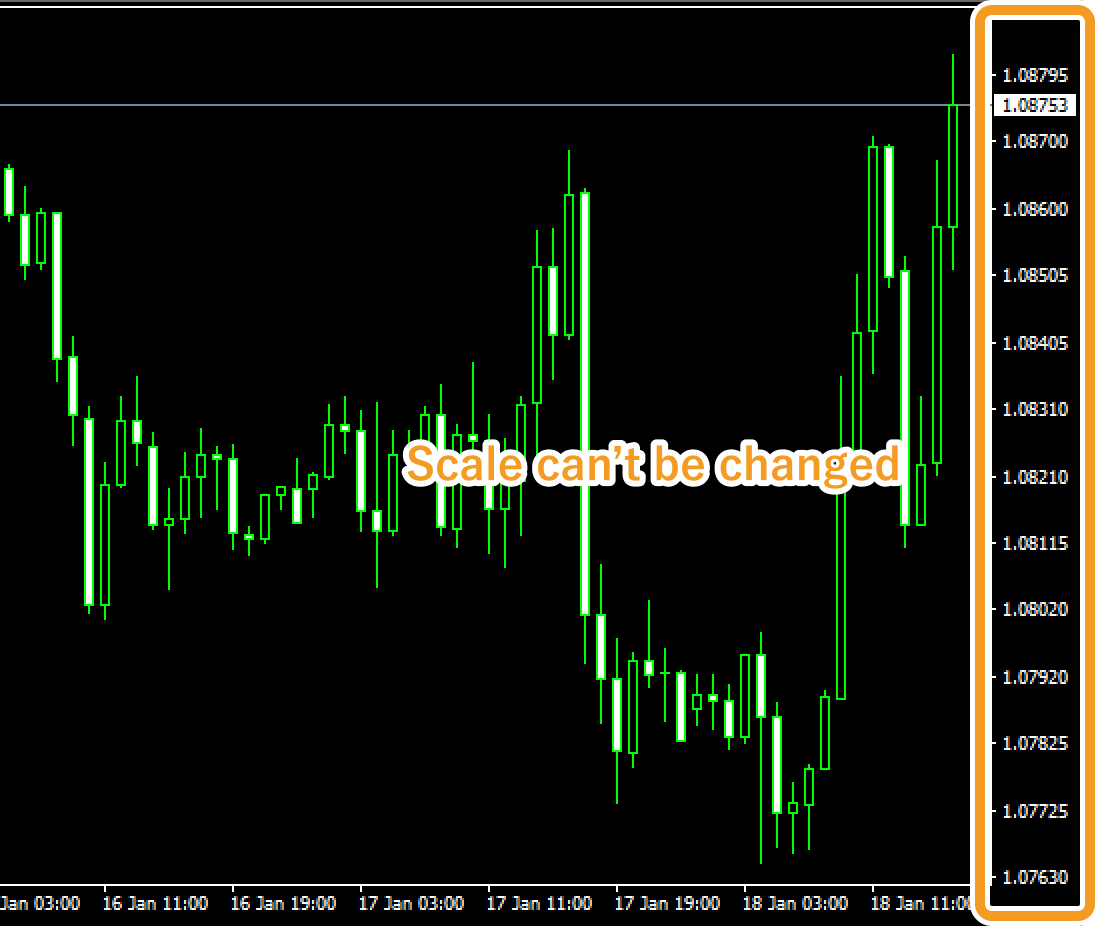
By default, you can change the scale of the vertical axis by dragging the cursor up and down. However, if you check the "Scale fix One to One", this operation won't be available. In this case, you can adjust the vertical axis by scrolling the horizontal axis.
Step 1
Select "Properties" from the menu or the chart's context menu. You can't set up the scale for all charts at once, so set it up for each chart.
The color for the scale can be set in the "Foreground" parameter of "Properties". If it is set to transparent or the same as the "Background" color, the scale will be hidden.
Select "Properties" from the menu
Click "Charts" in the menu and select "Properties".
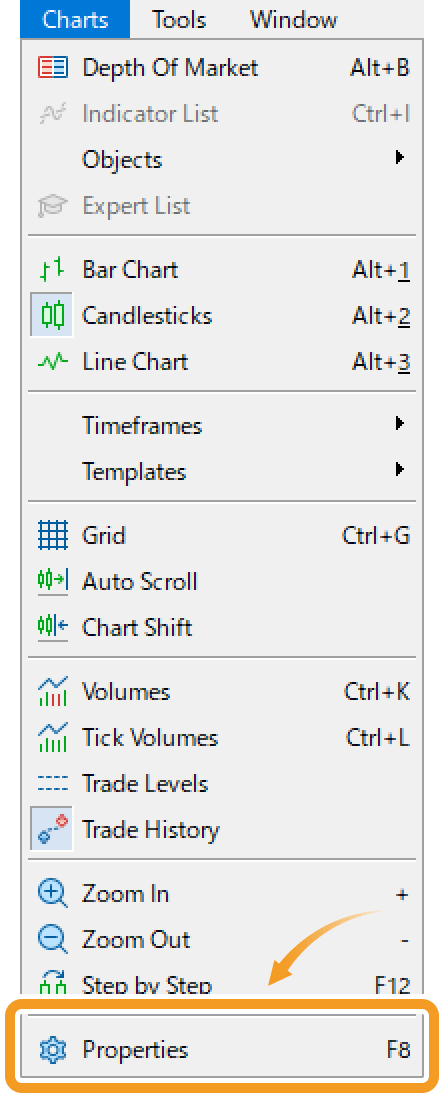
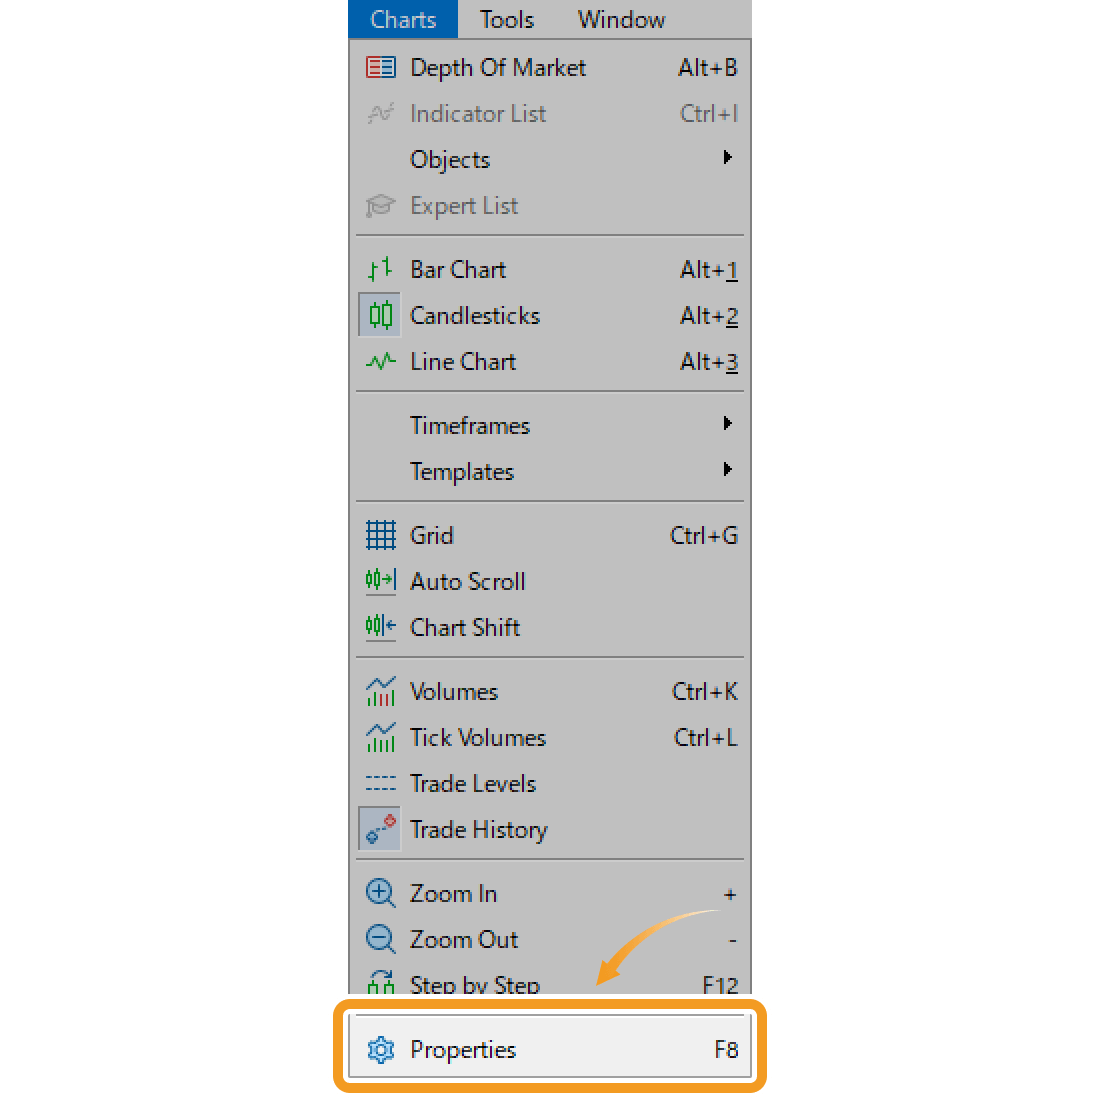
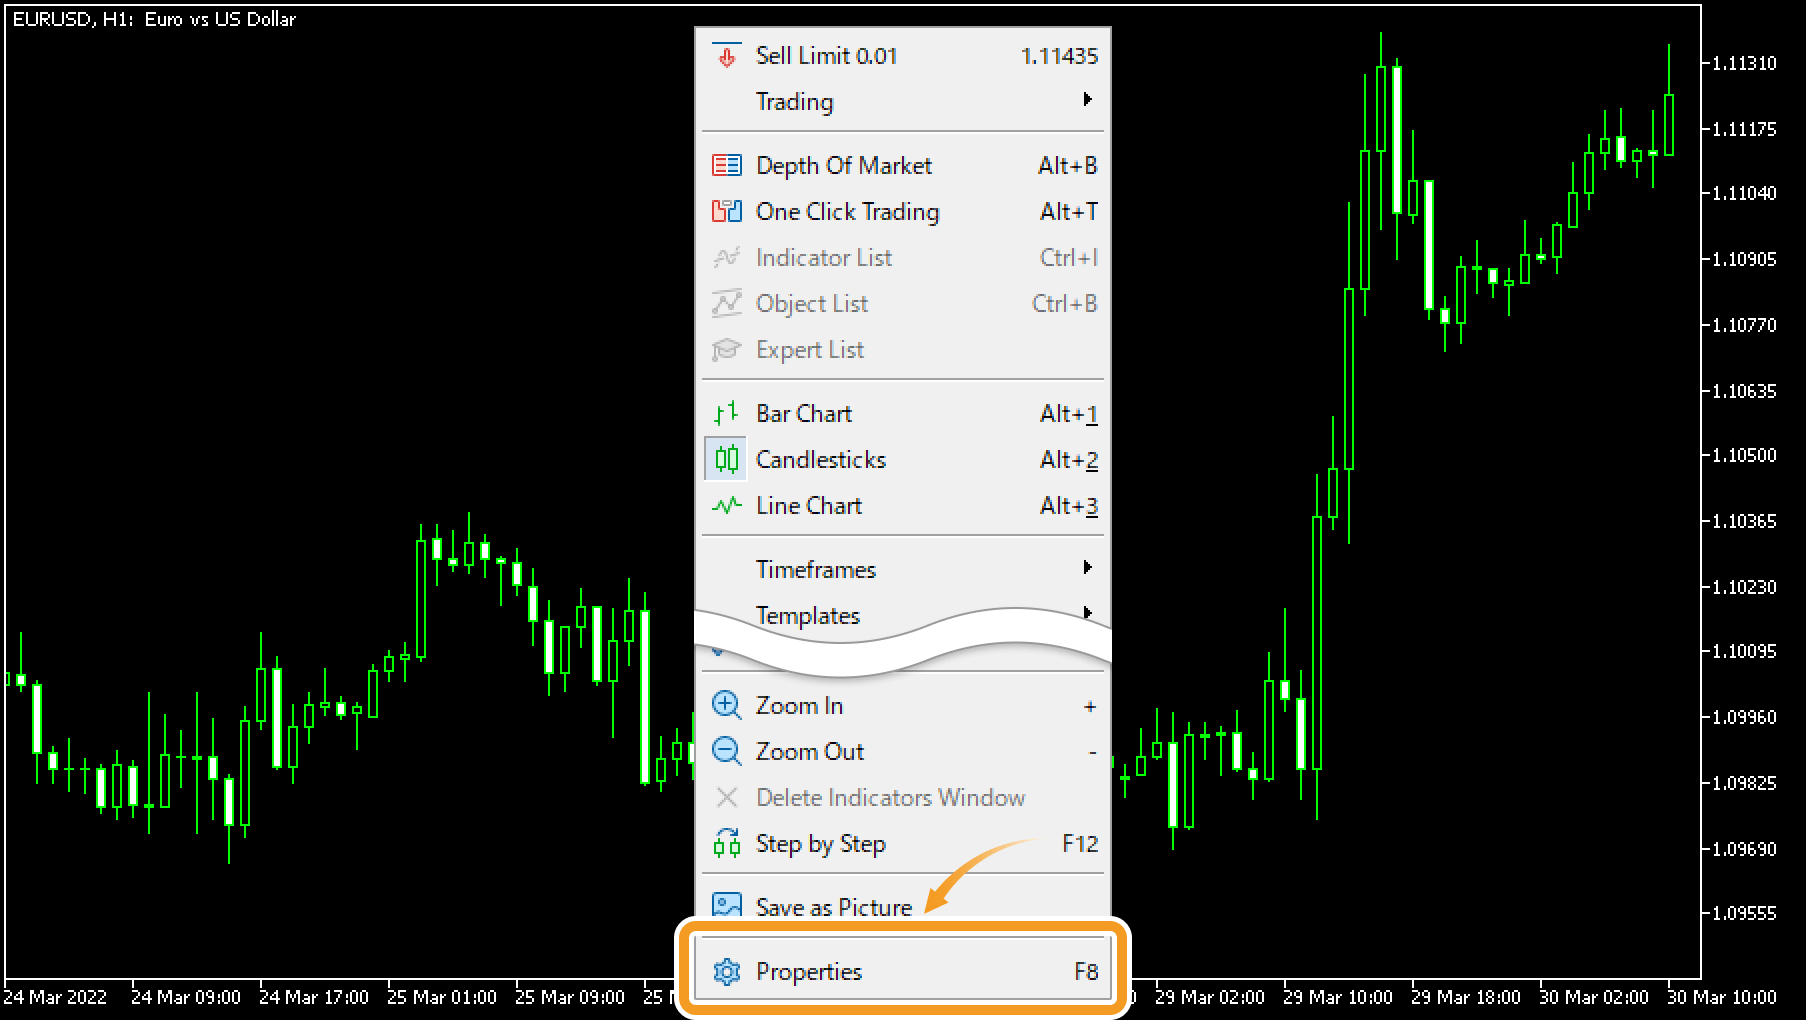
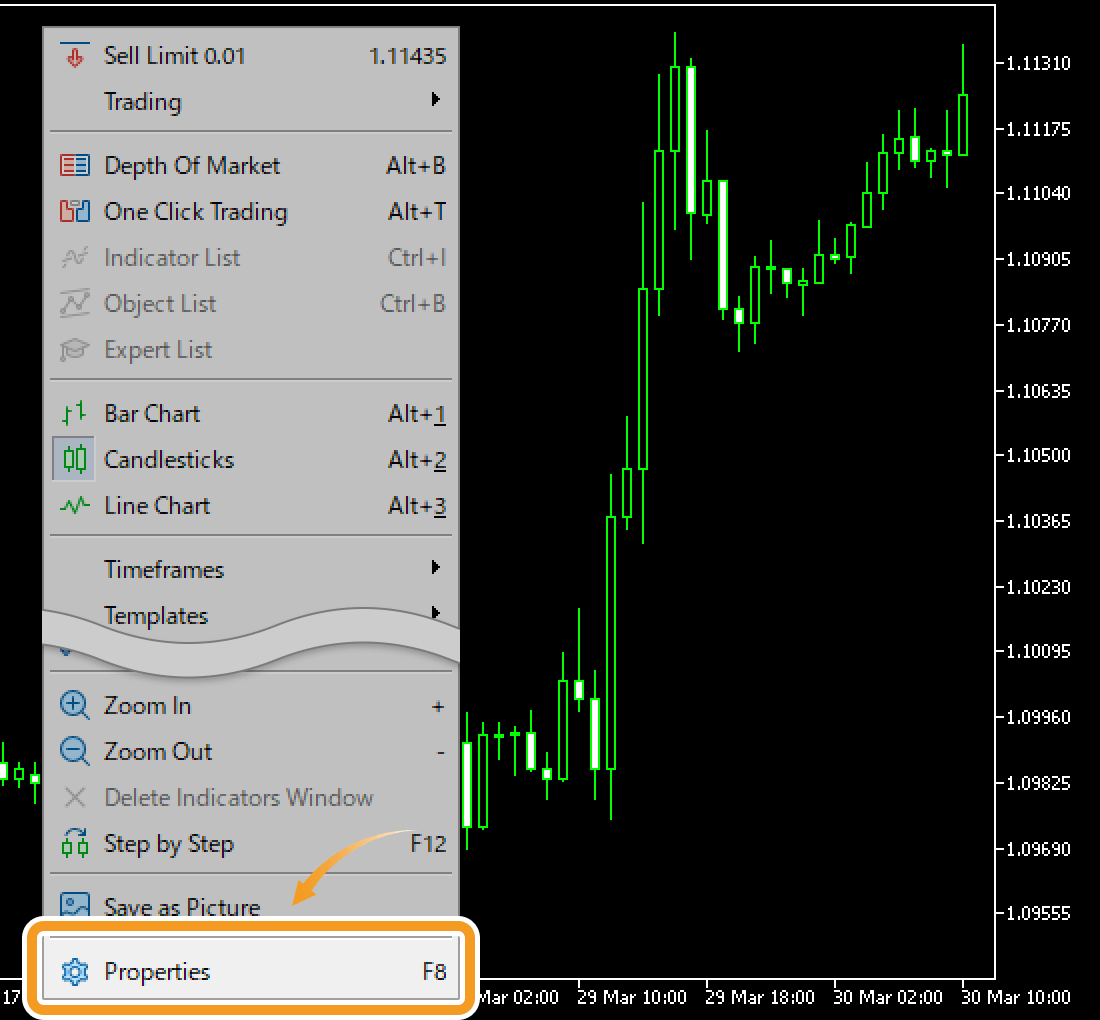
Select "Properties" from the chart's context menu
Right-click on the chart you wish to fix the scale for vertical axis, and select "Properties".
Step 2
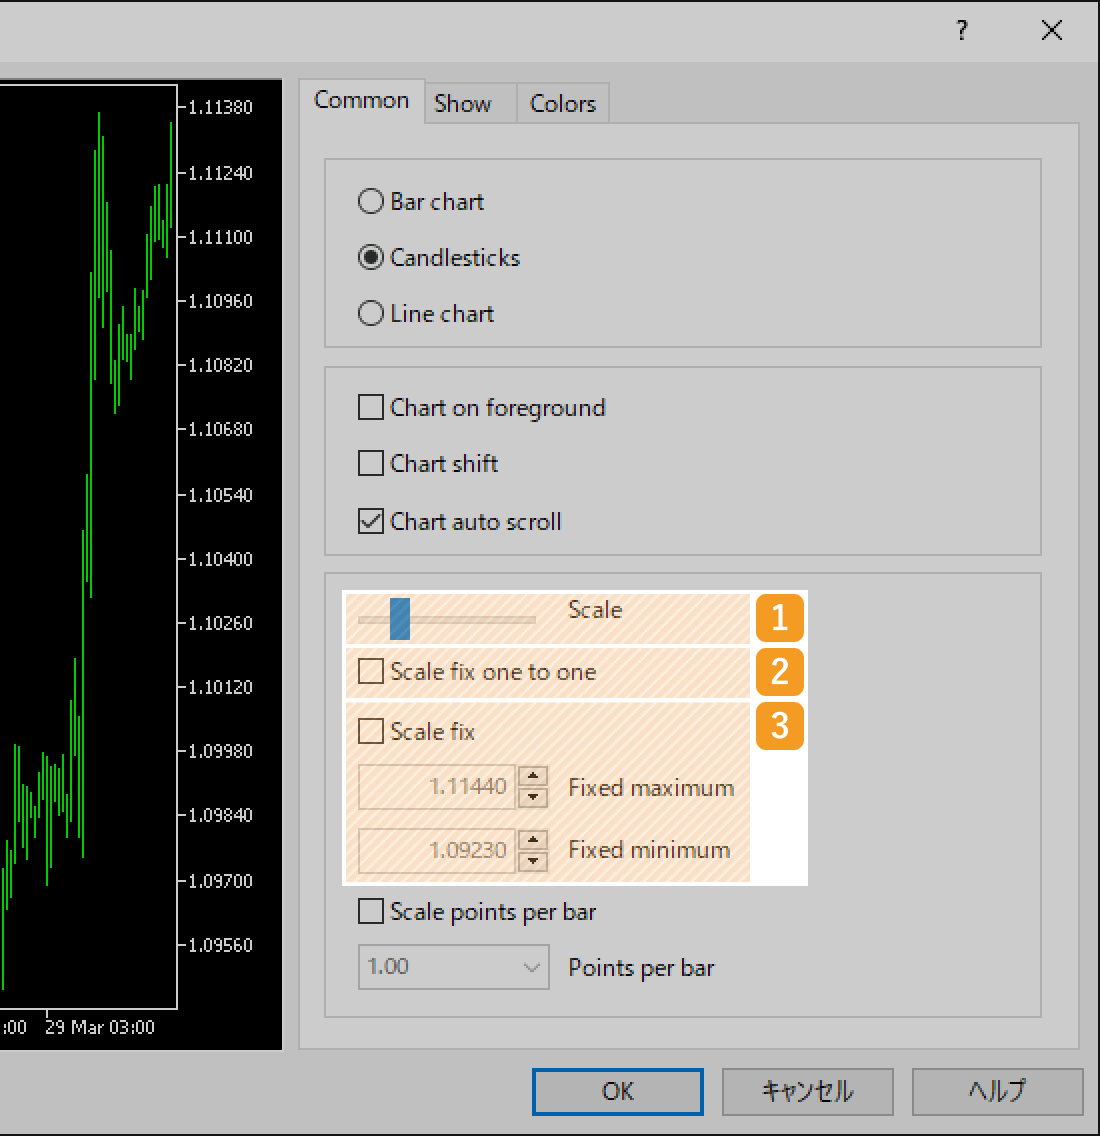
In the "Common" tab, adjust the chart scale and click "OK".
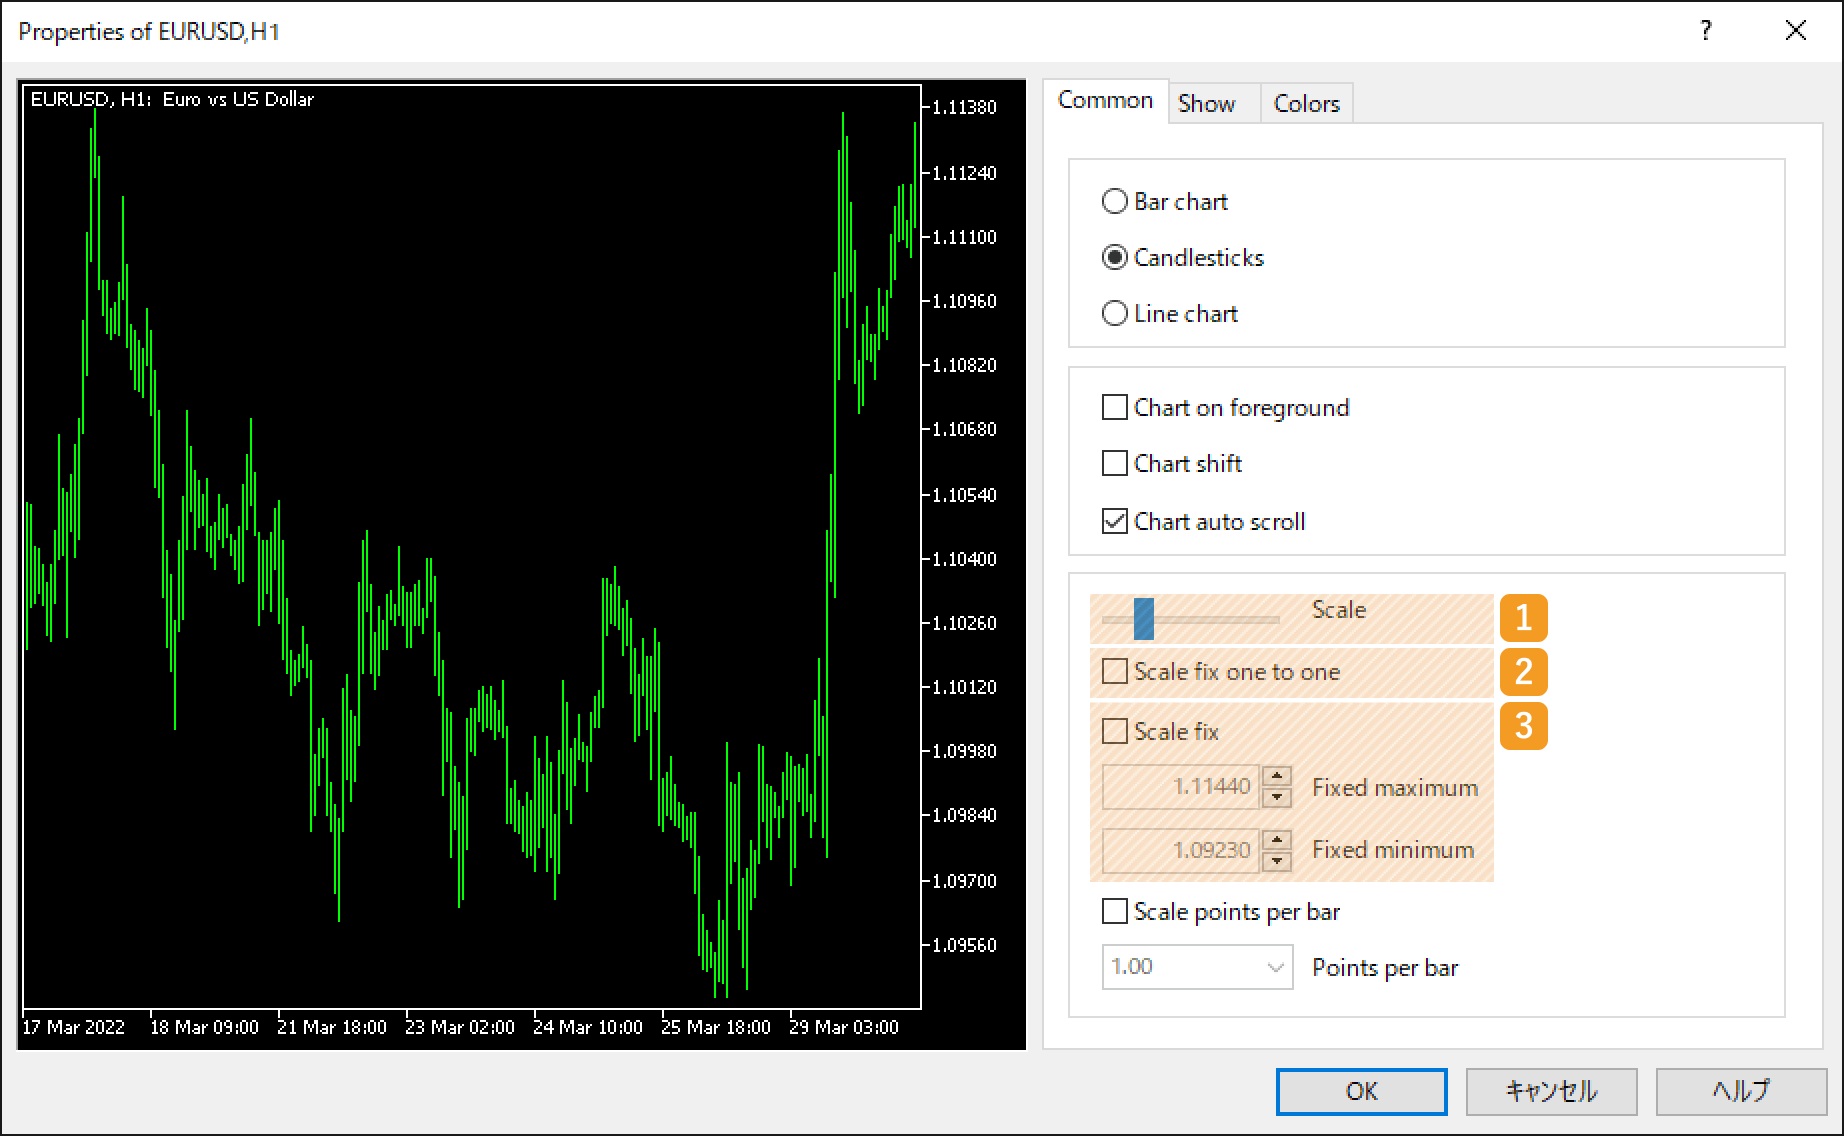
|
Number |
Item name |
Descriptions |
|---|---|---|
|
1 |
Scale |
You can use the bar to adjust the scale on the horizontal axis (time) and the vertical axis (price). If you shift the bar to the right, the scale will expand relative to the time and price. If you move it to the left, the scale will shrink relative to the time and price. |
|
2 |
Scale fix one to one |
Check the "Scale fix one to one" to set the horizontal (time) and vertical (price) scales evenly. When you check the "Scale fix one to one" box, the "Scale fix" box will automatically be checked as well since the vertical scale will be fixed. |
|
3 |
Scale fix |
Check the "Scale fix" box to set the range for vertical axis (price). Set the maximum value of the vertical axis in "Fixed maximum" and the minimum value in "Fixed minimum". |
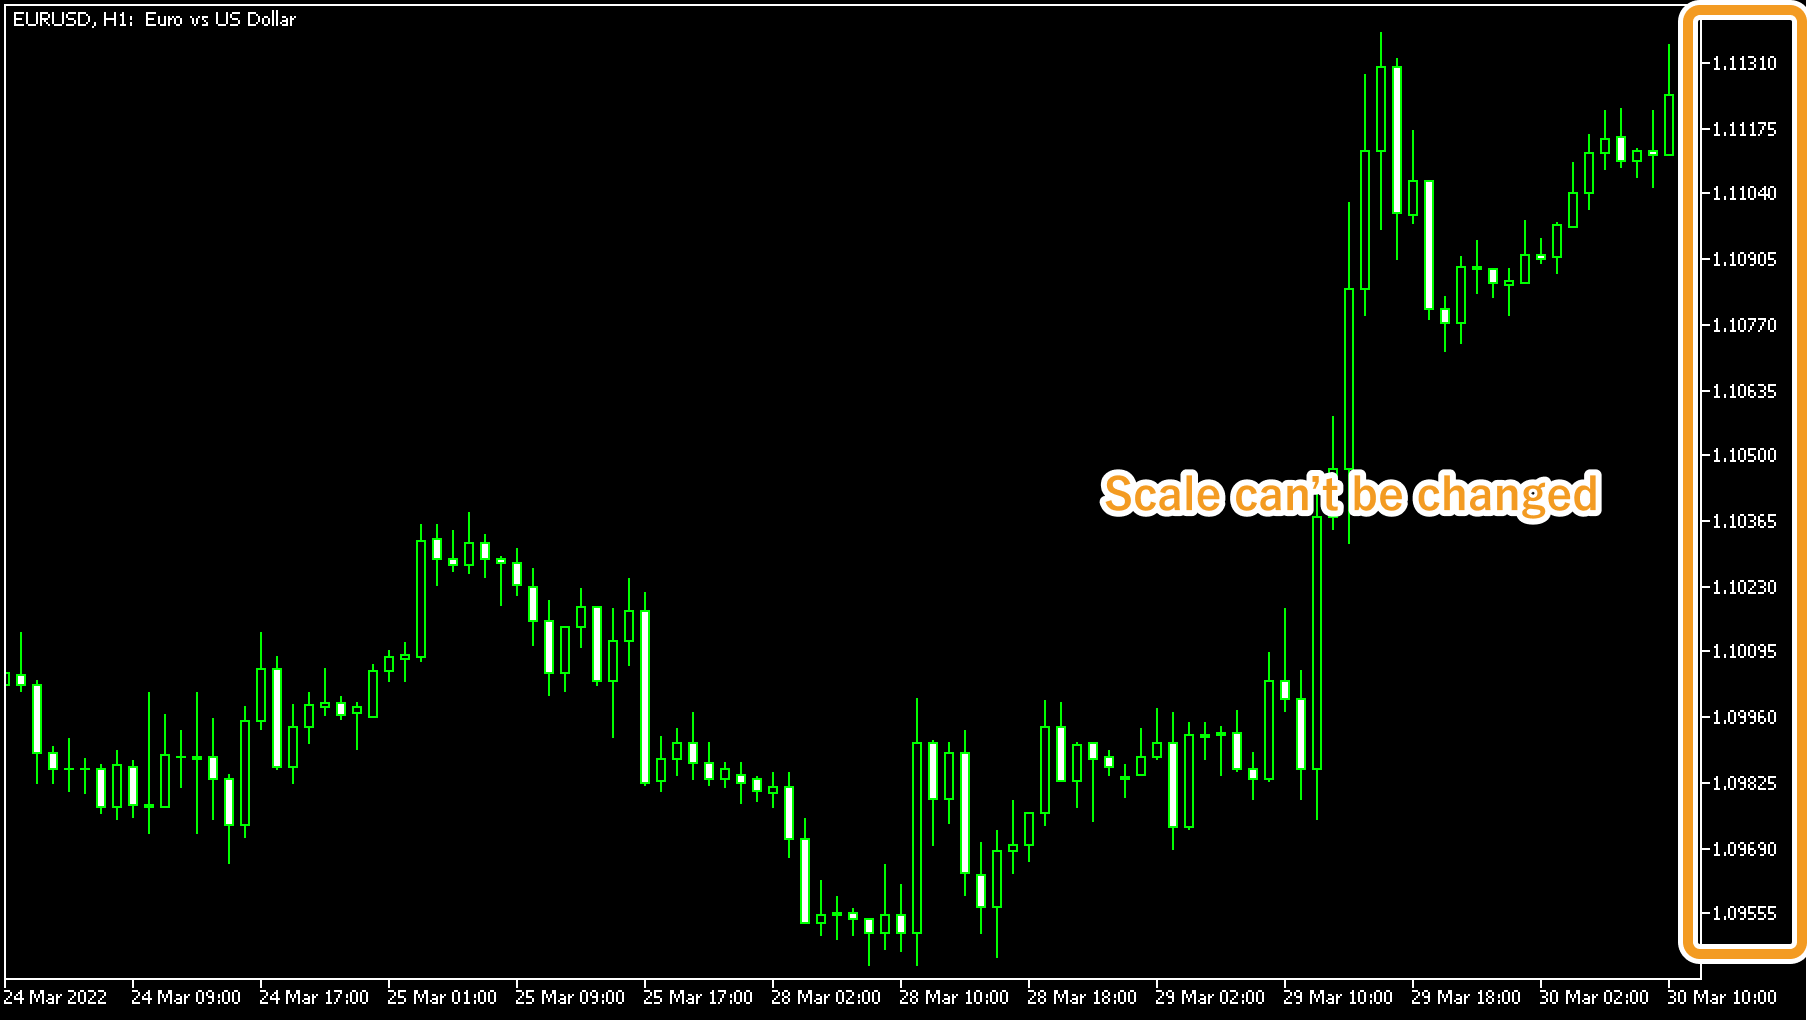
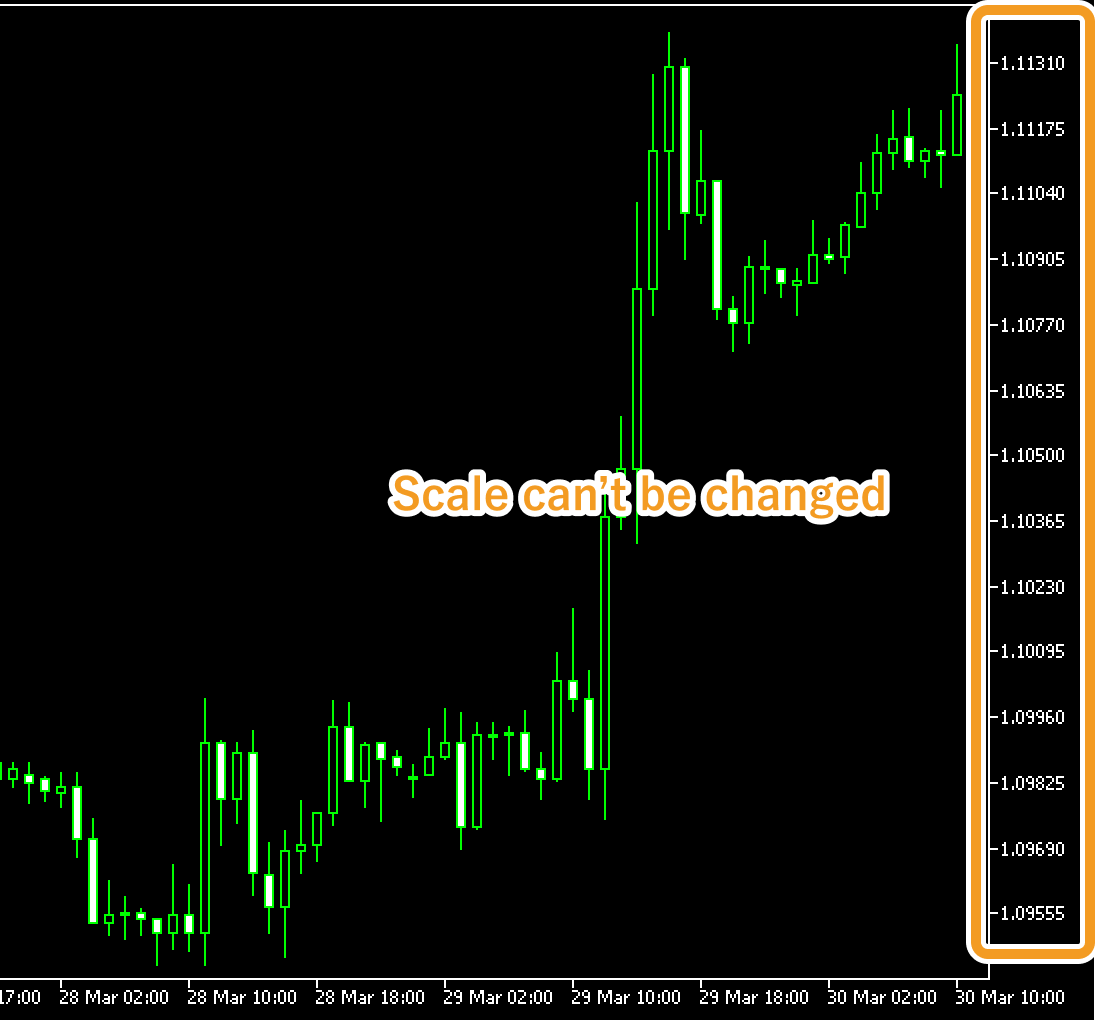
By default, you can change the scale of the vertical axis by dragging the cursor up and down. However, if you check the "Scale fix one to one", this operation won't be available.
Was this article helpful?
0 out of 0 people found this article helpful.
Thank you for your feedback.
FXON uses cookies to enhance the functionality of the website and your experience on it. This website may also use cookies from third parties (advertisers, log analyzers, etc.) for the purpose of tracking your activities. Cookie Policy
