MT4/MT5: Draw Gann grid
EA, indicators & objects (Mobile & tablet)
EA, indicators & objects (Mobile & tablet)

This article was :
published
updated
Here we'll look over the steps on how to display the Gann grid on the chart in MetaTrader4 (MT4) / MetaTrader5 (MT5) app for Android and iOS mobile devices. The Gann grid takes the Grid line and places it evenly across the chart diagonally. Intersections of the grid are often used to determine support and resistance levels.
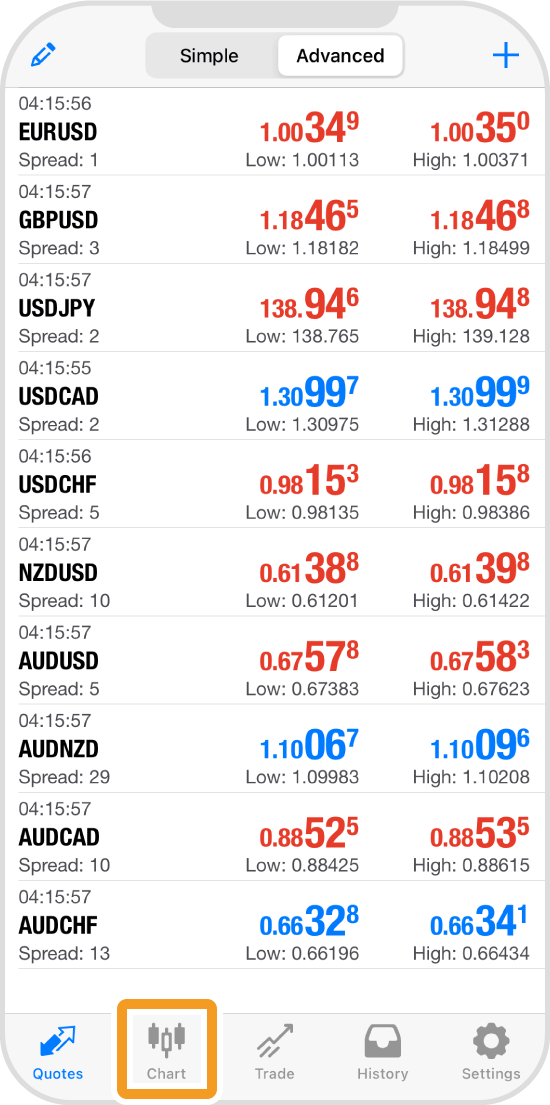
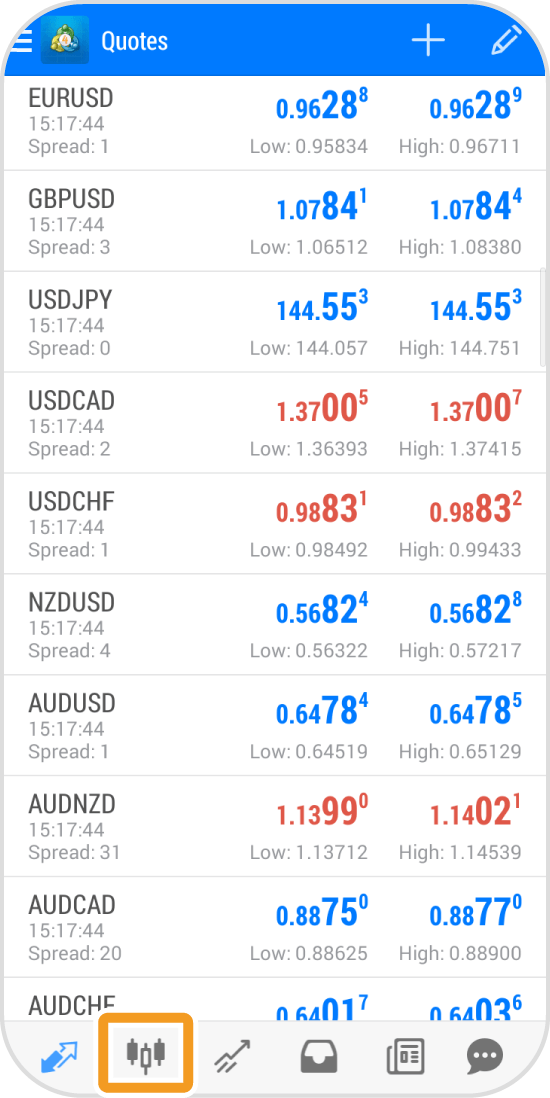
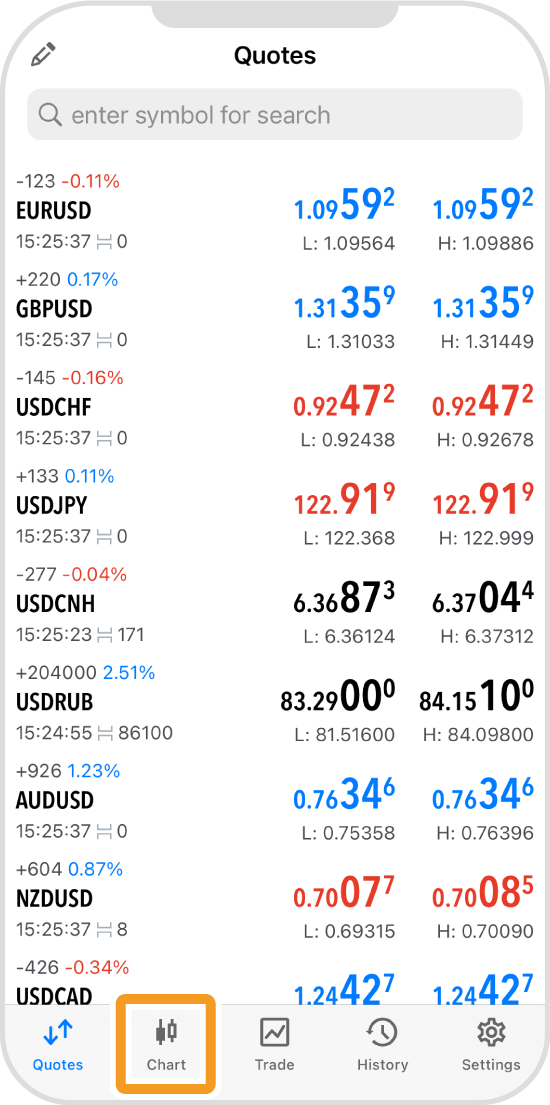
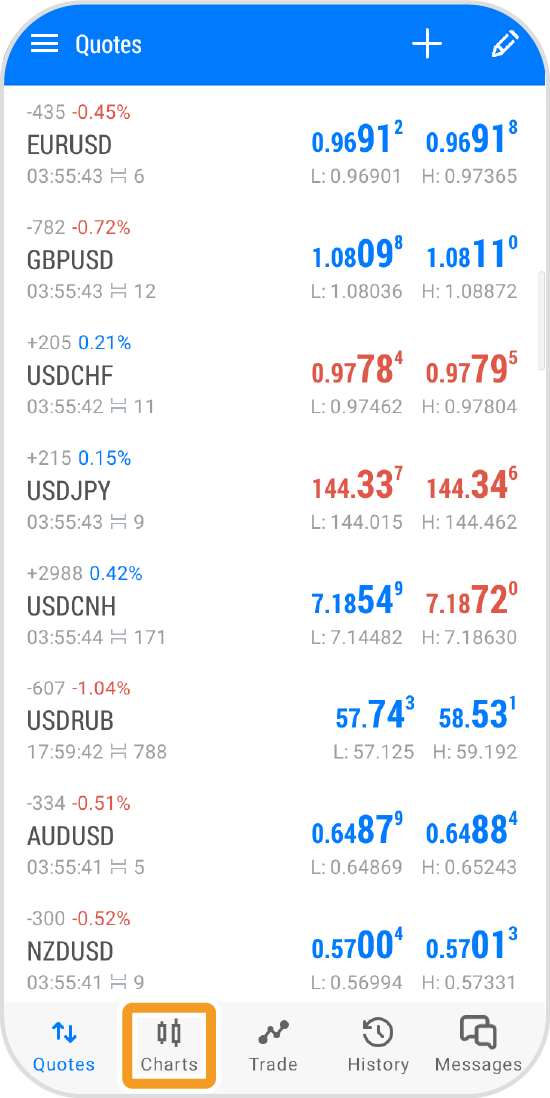
Tap "Chart" on the bottom navigation bar.
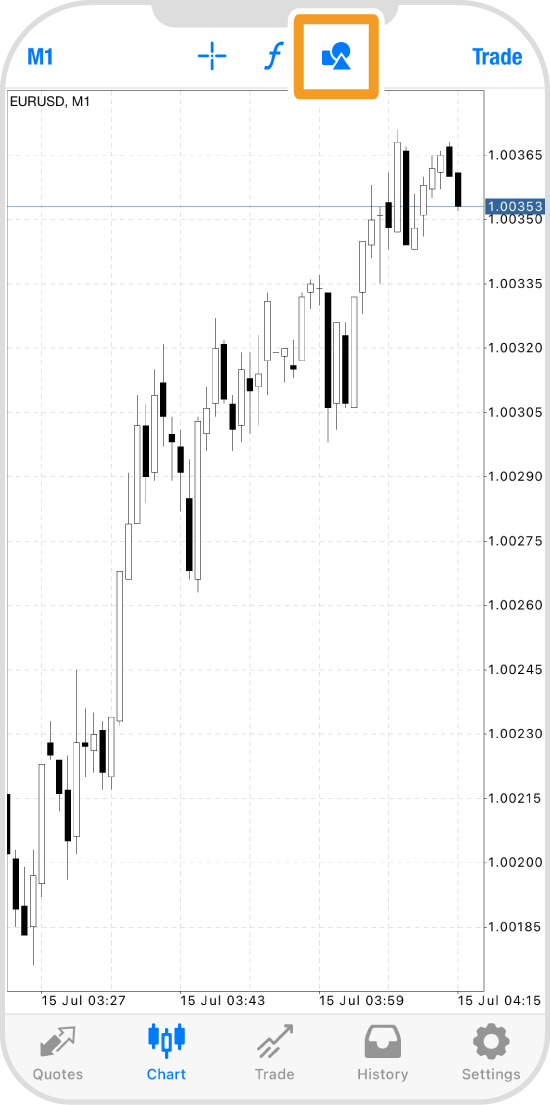
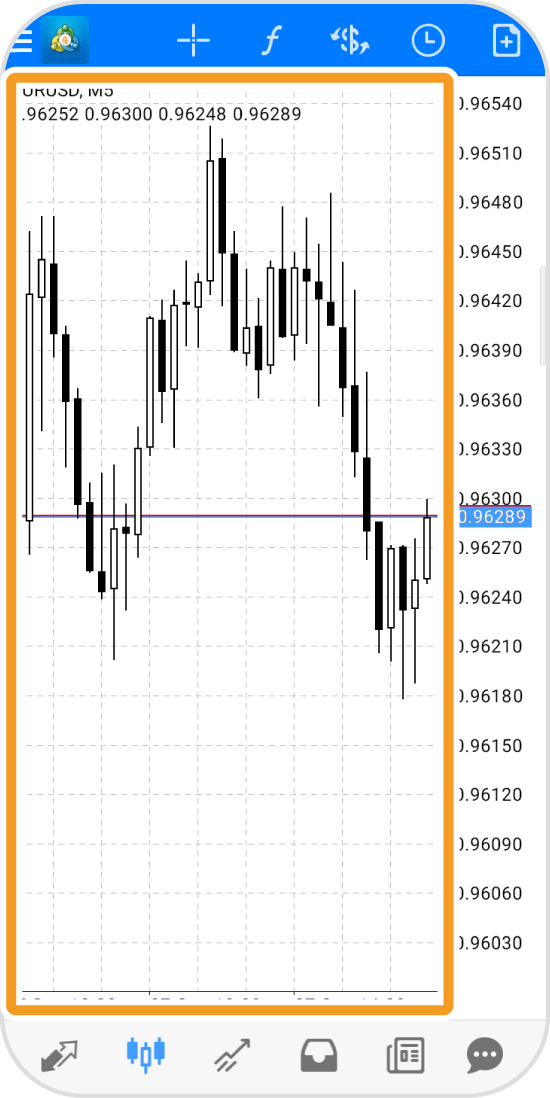
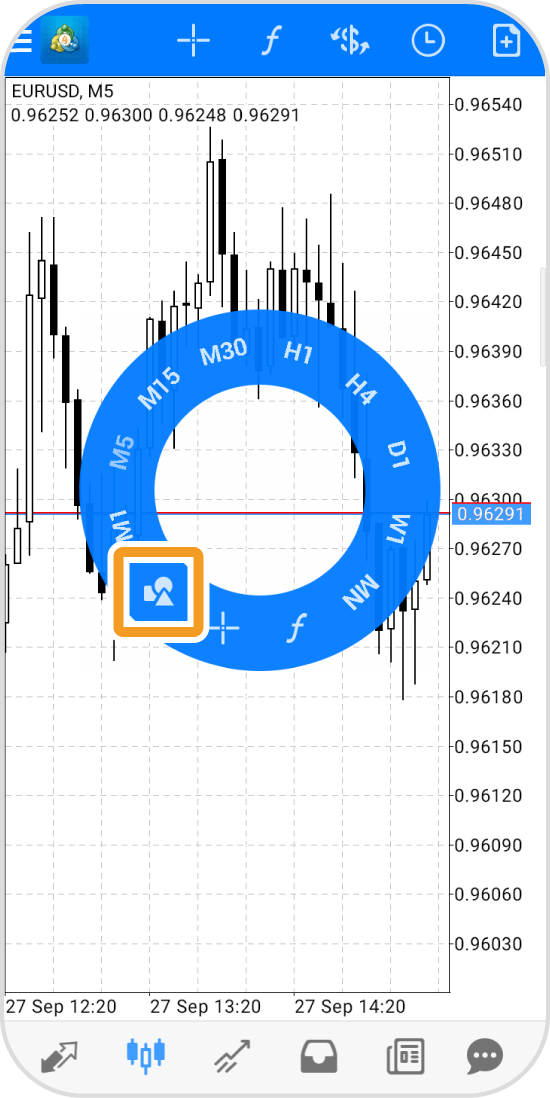
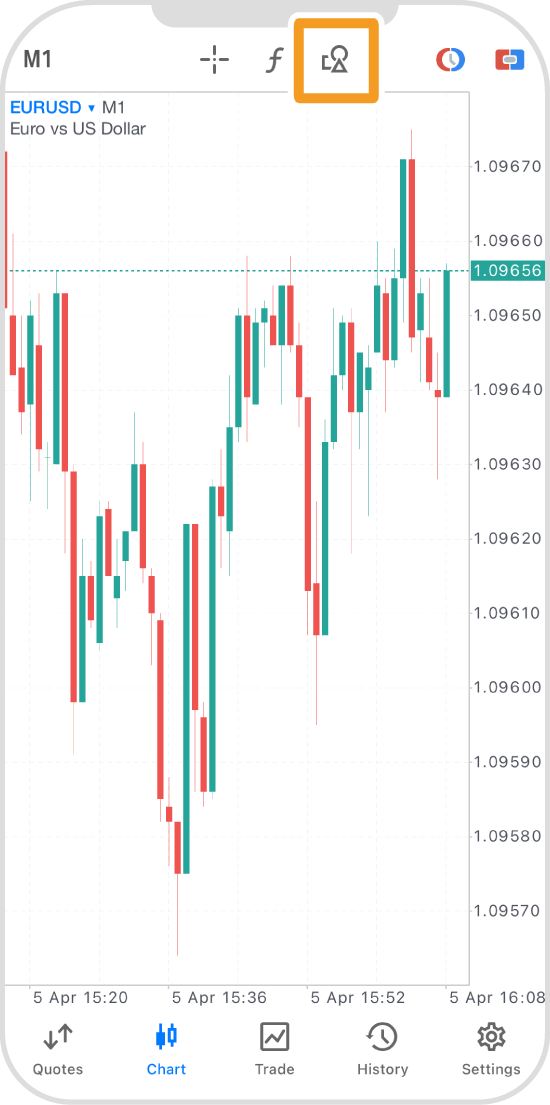
Tap the "Objects" icon at the top.
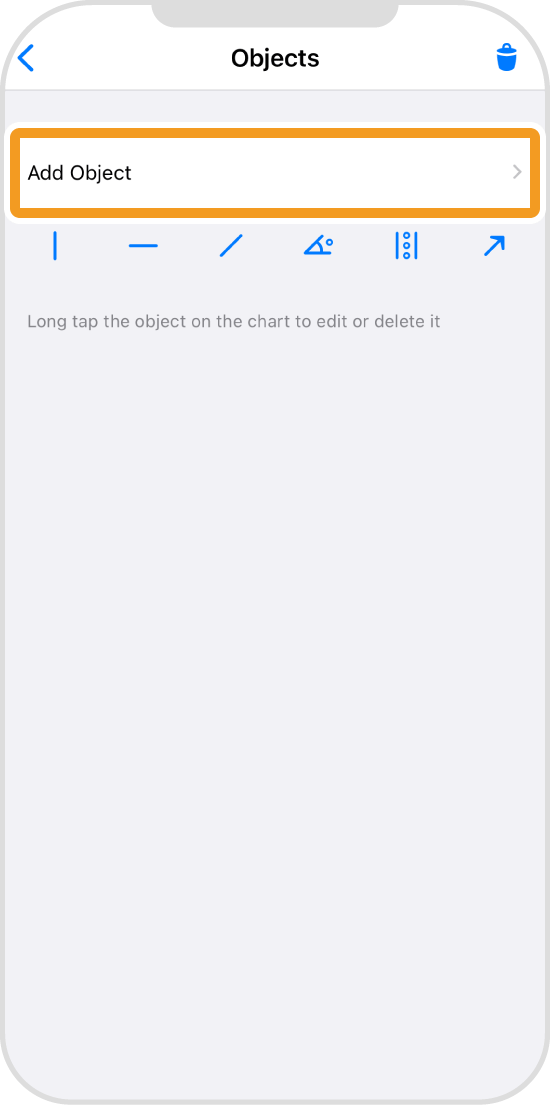
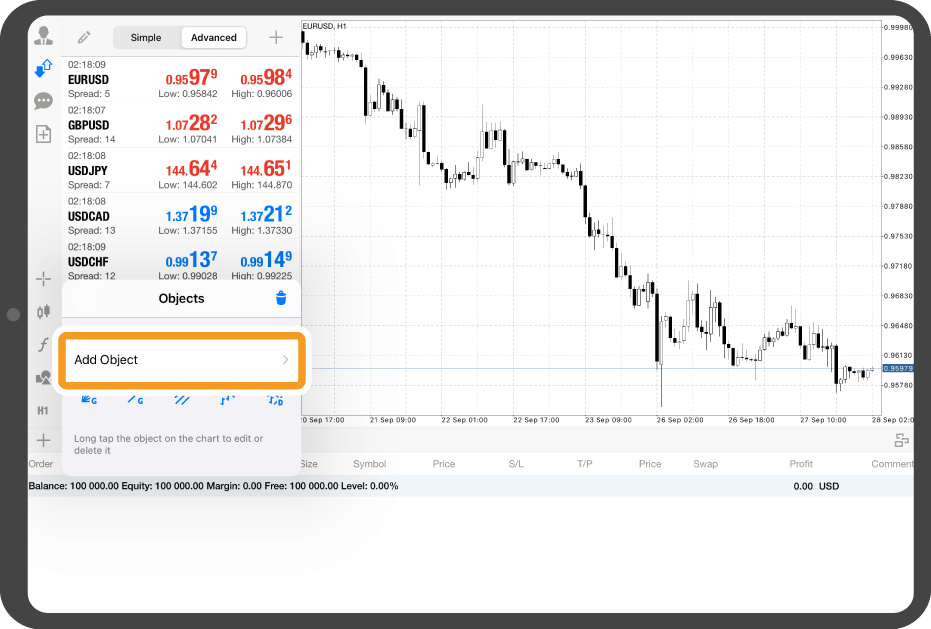
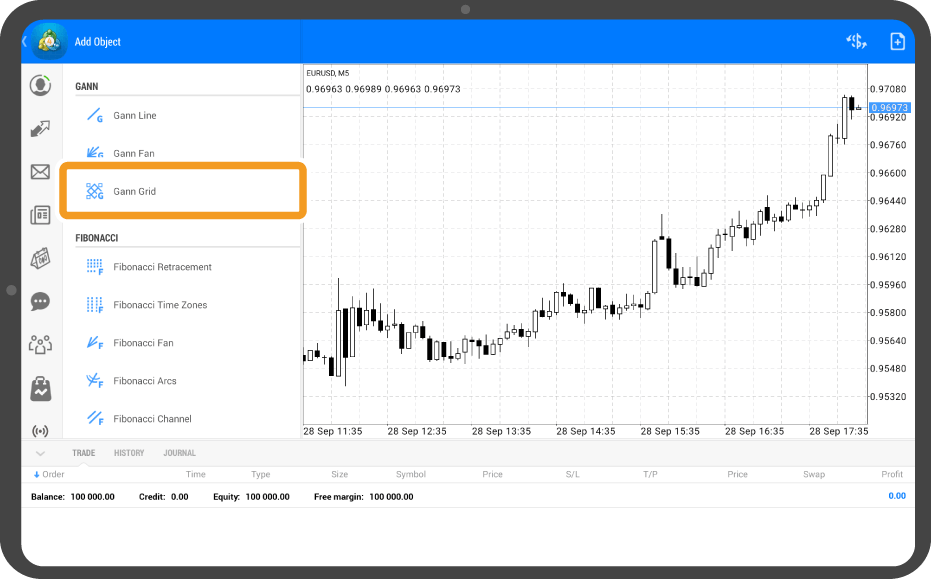
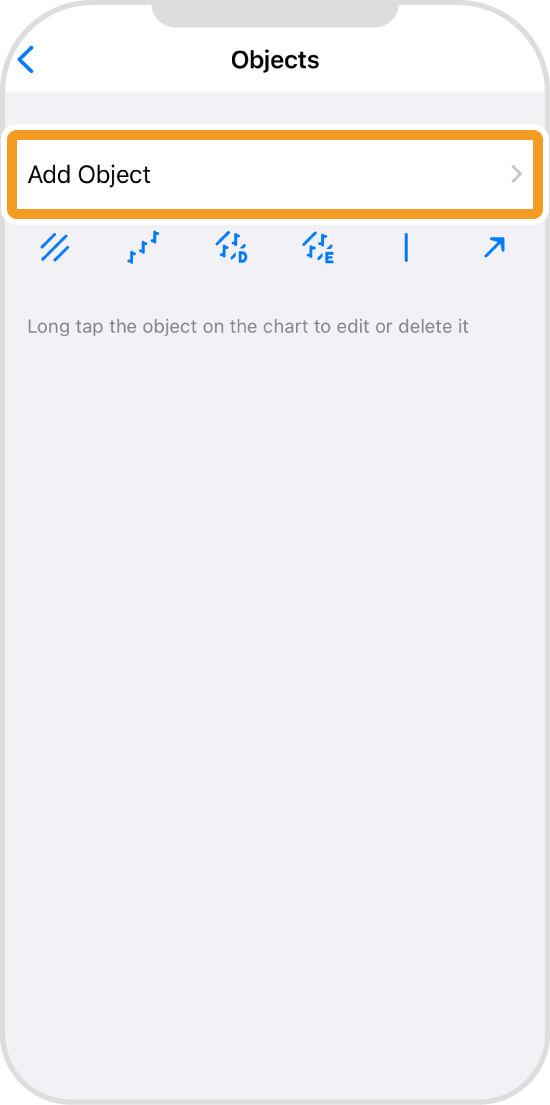
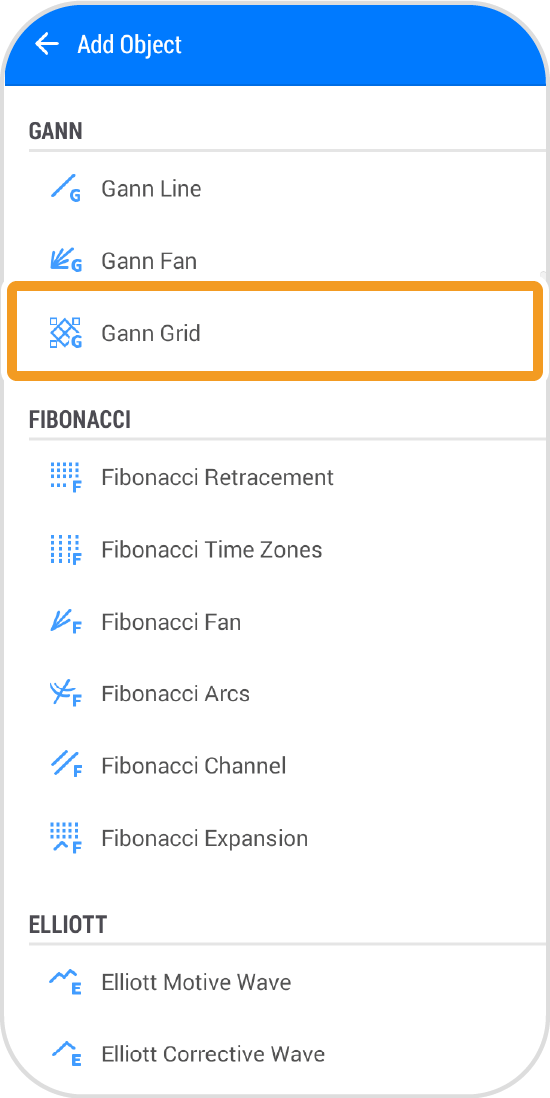
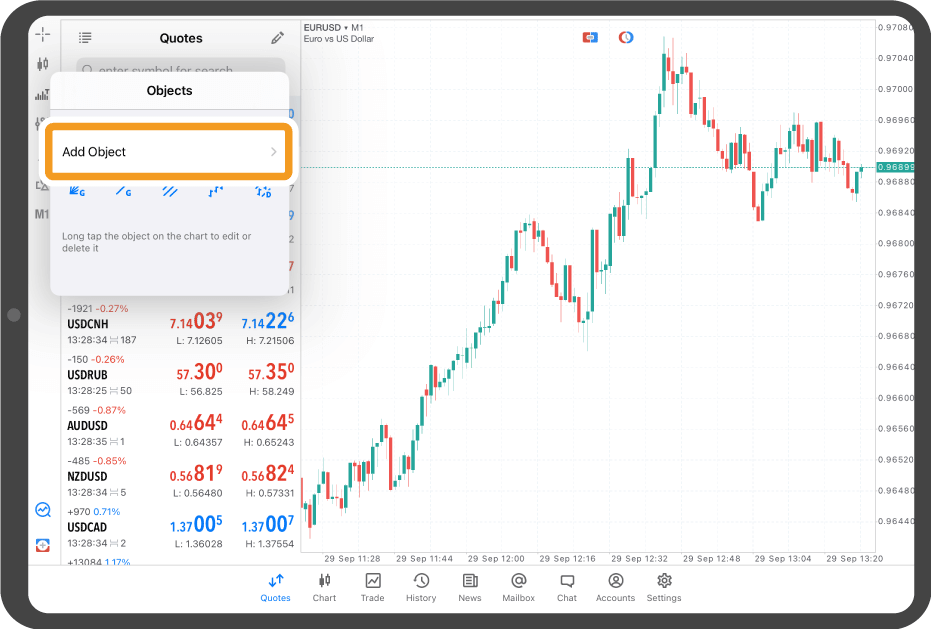
Tap "Add Object".
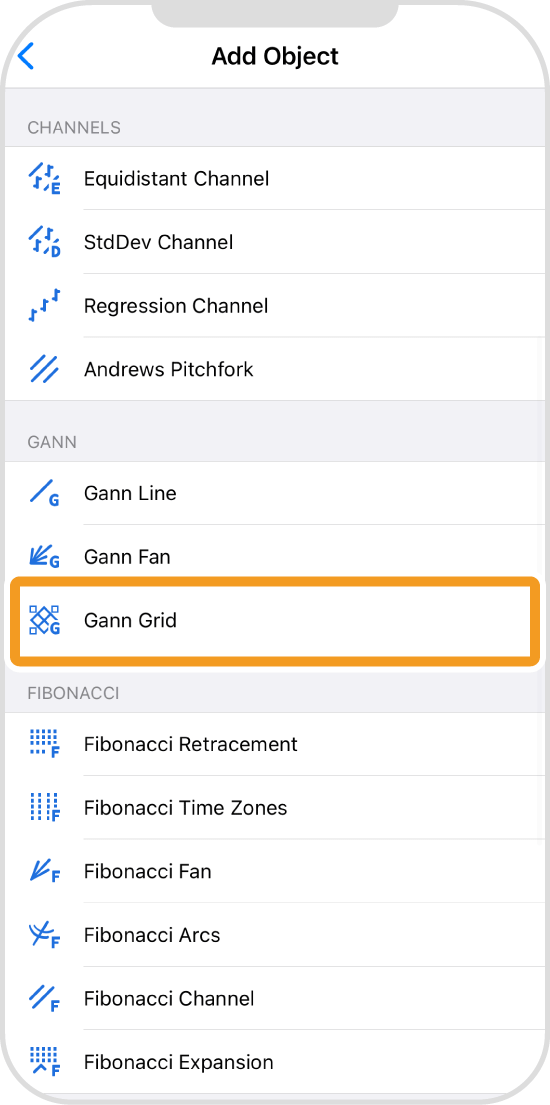
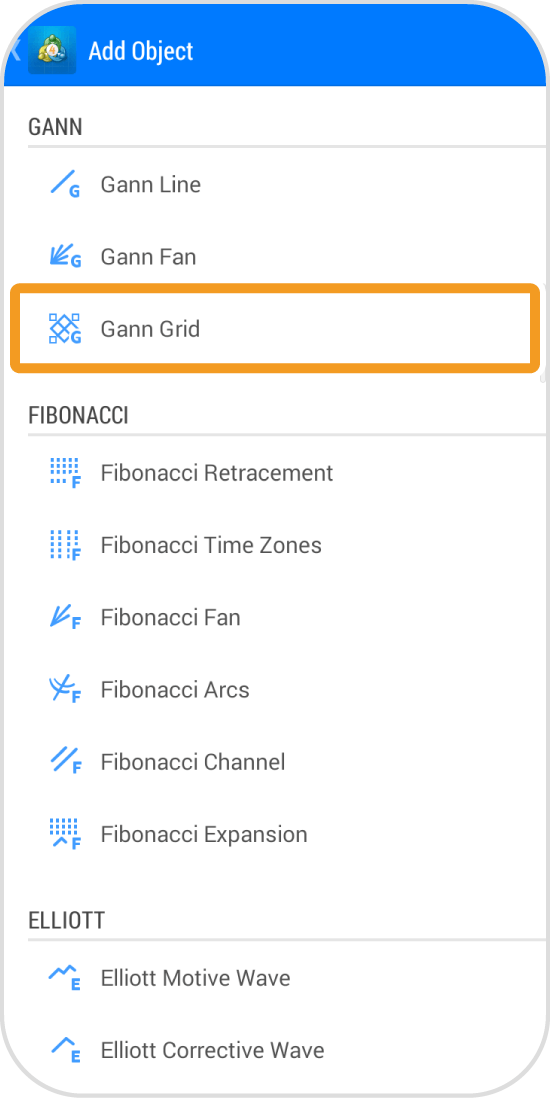
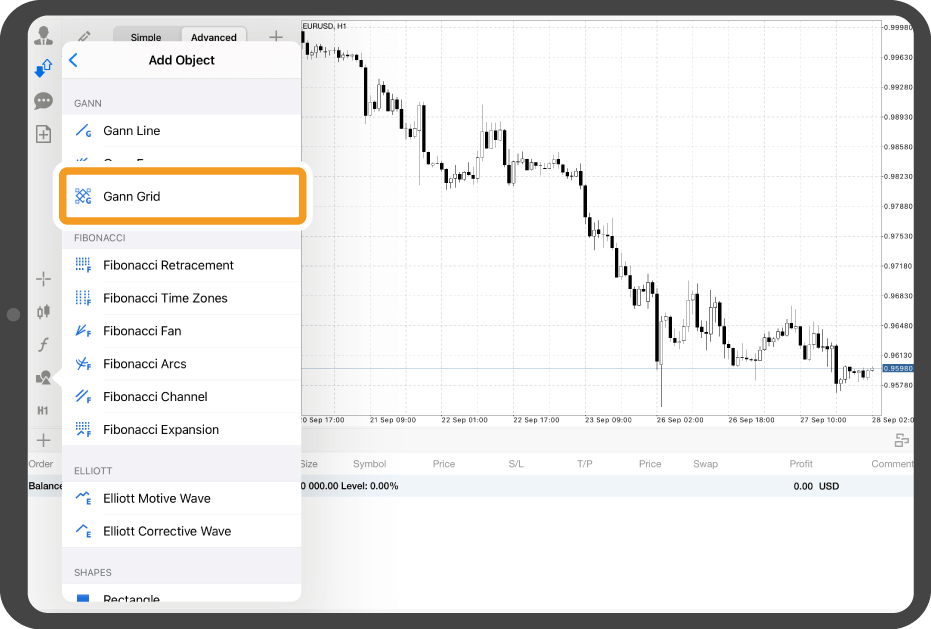
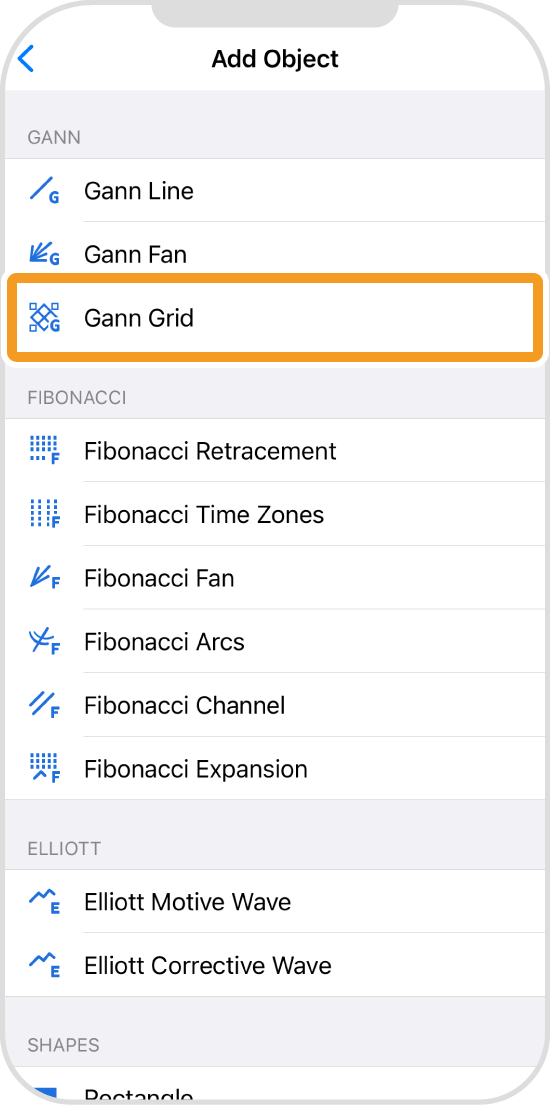
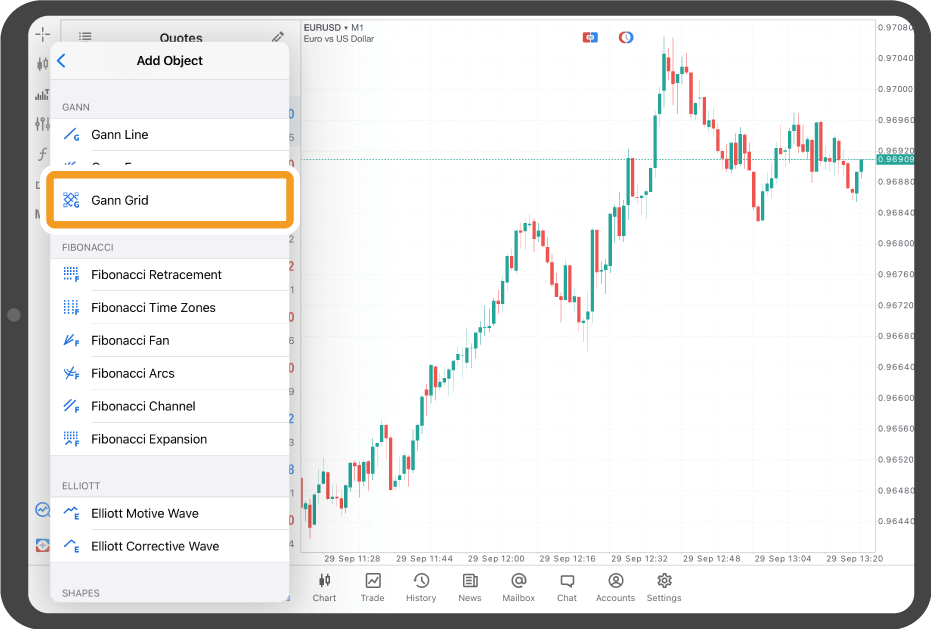
Tap "Gann Grid".
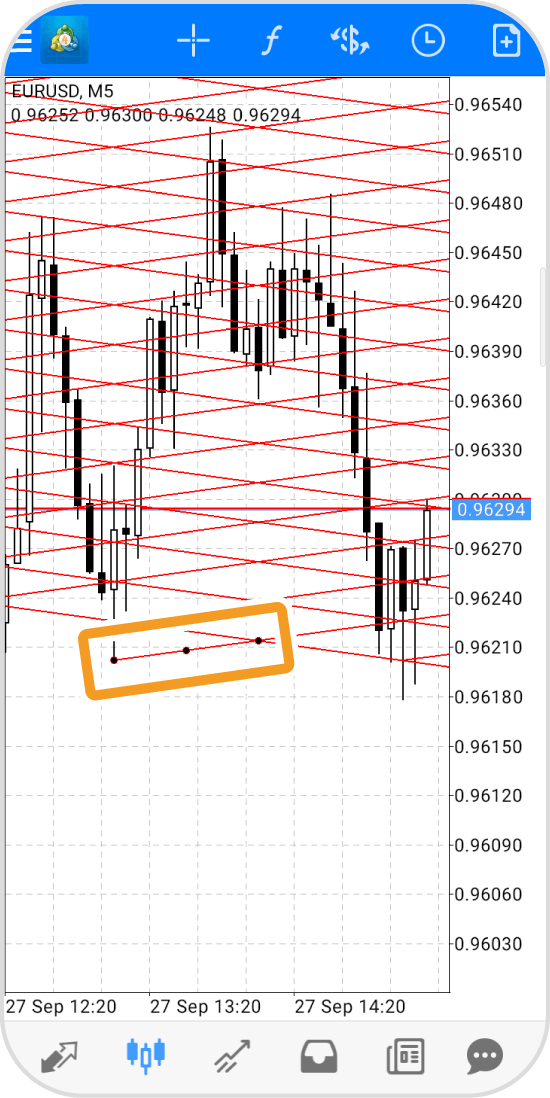
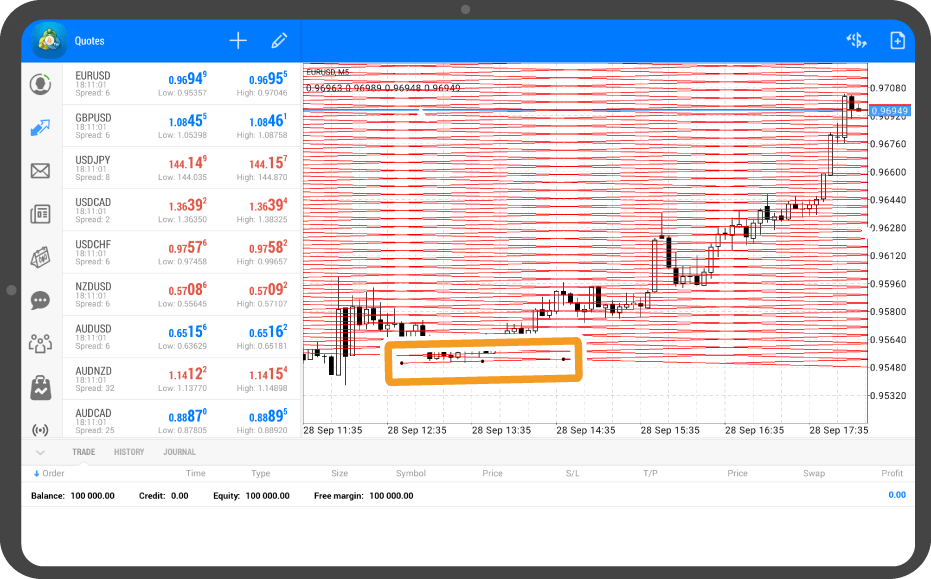
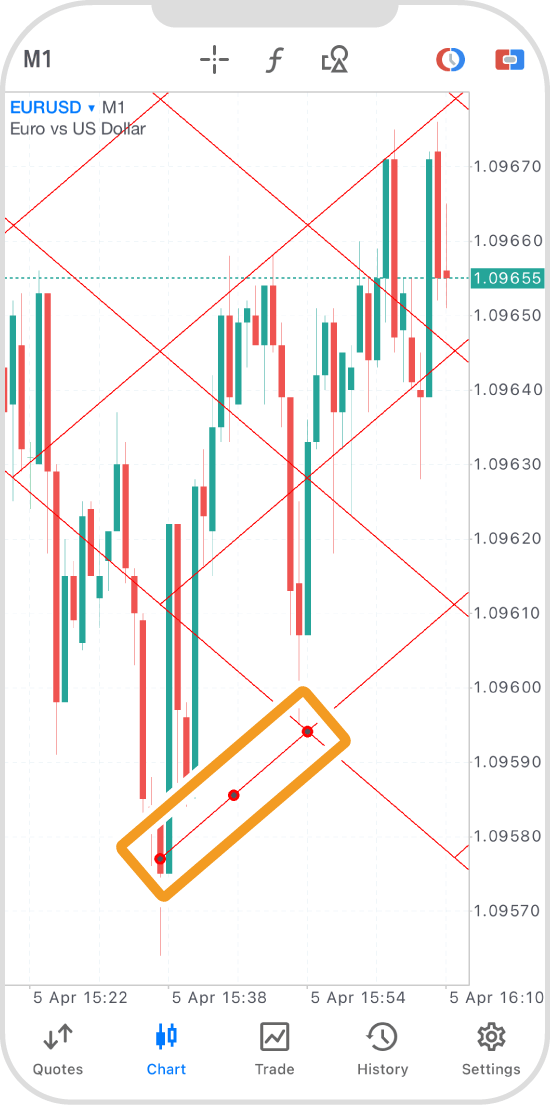
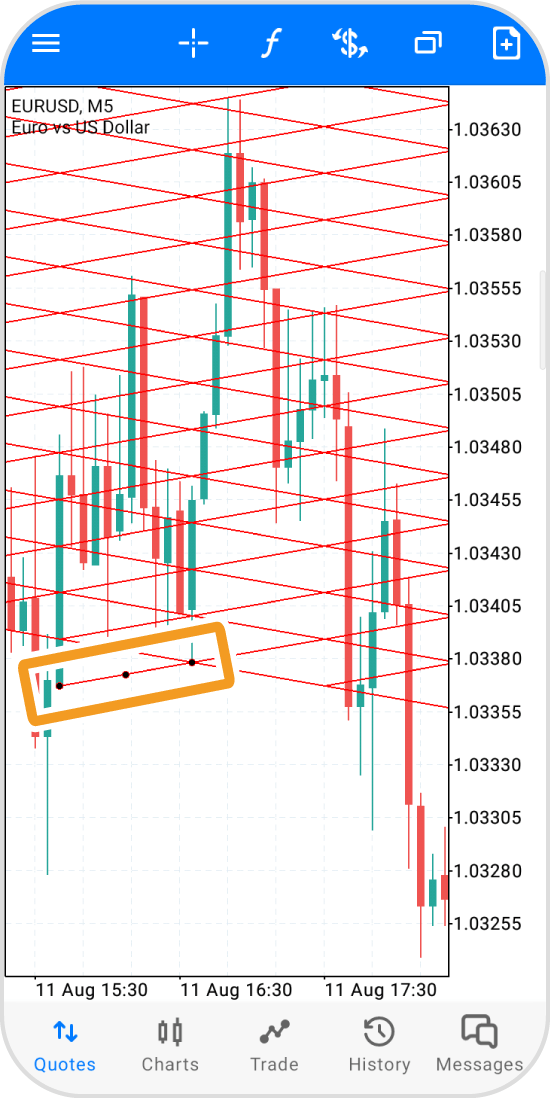
Tap at the starting point and drag to the end point to adjust the position.
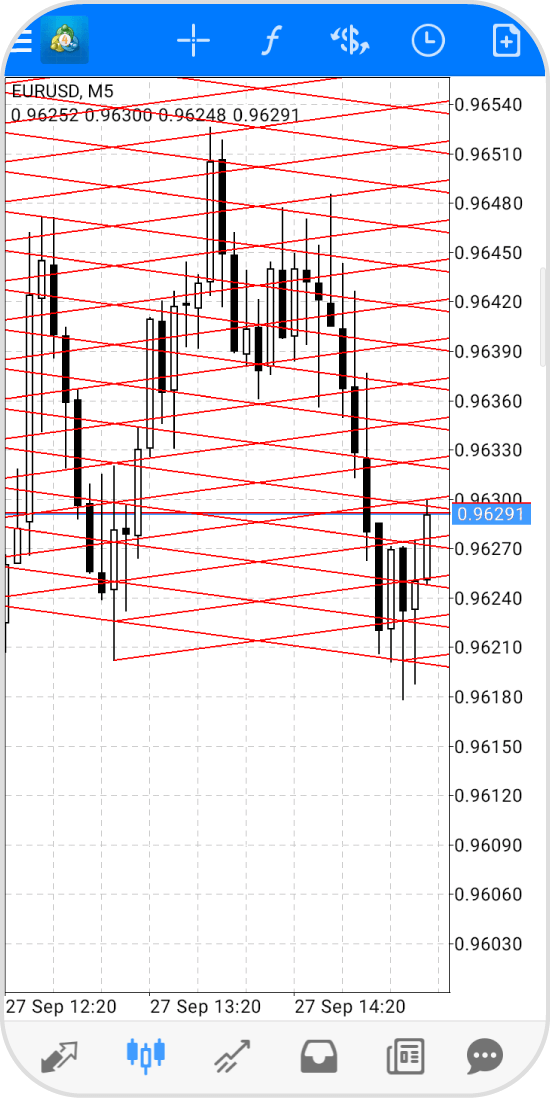
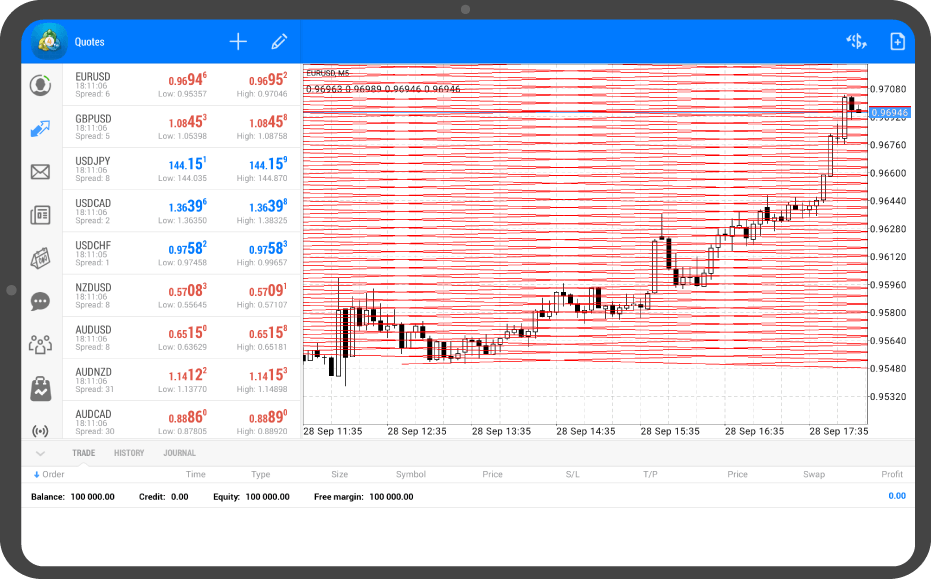
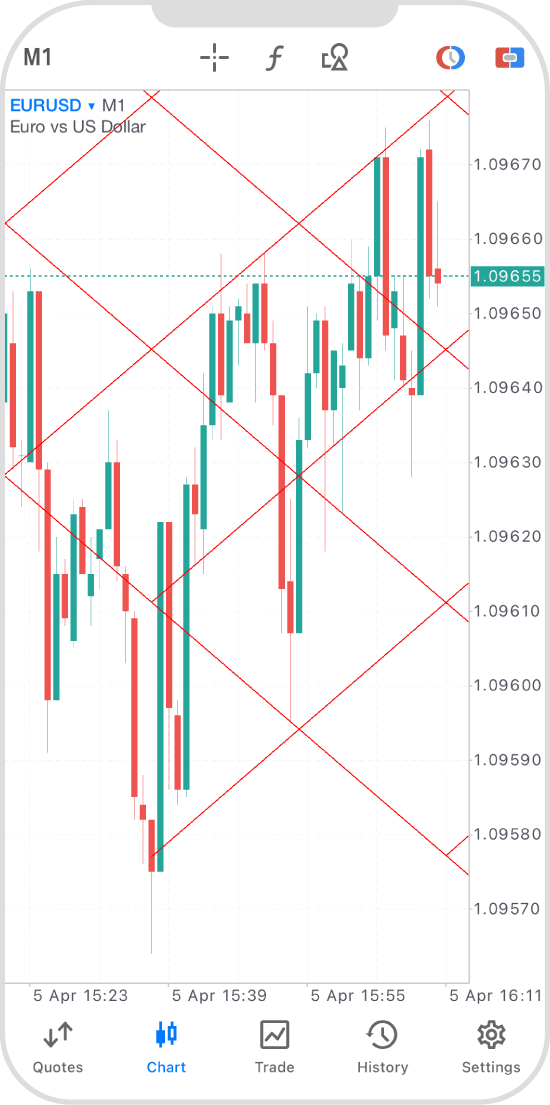
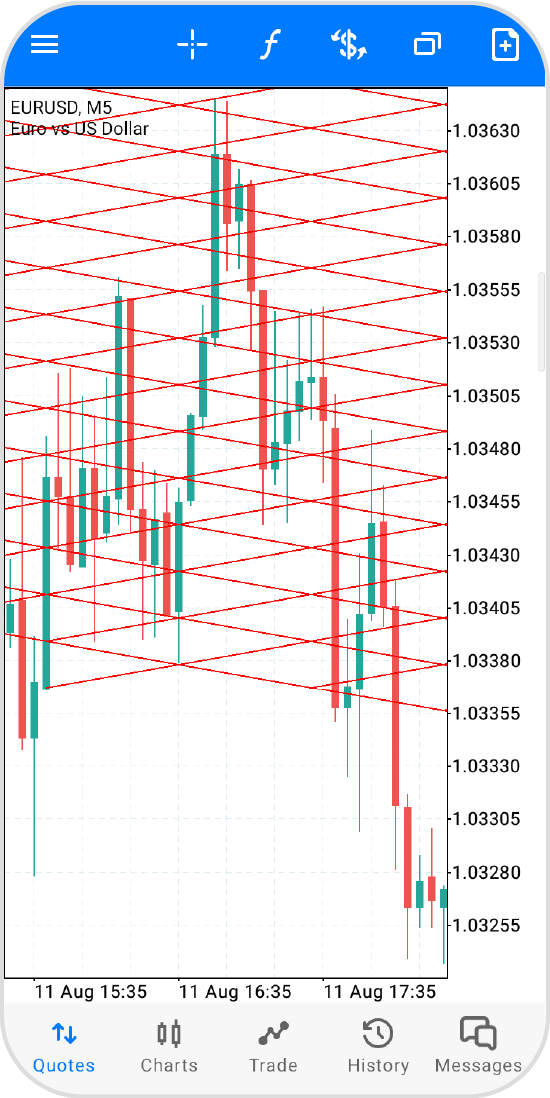
To fix the Gann grid, tap on the line to hide the dots.
Tap "Chart" on the bottom navigation bar.
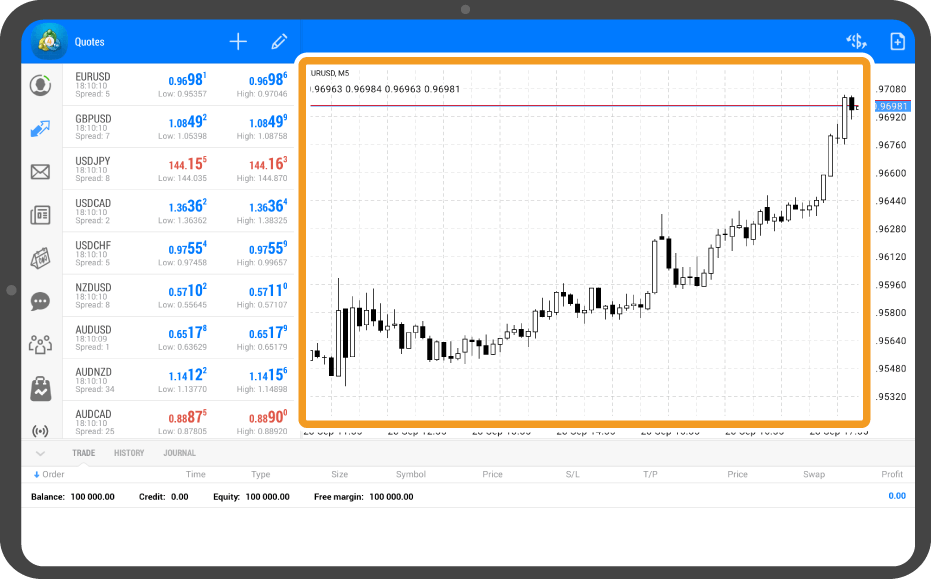
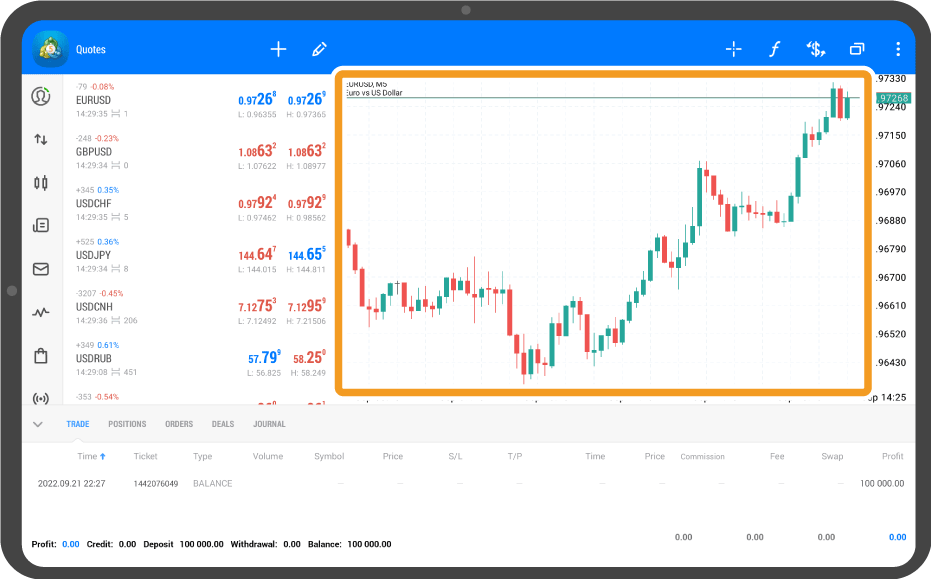
Tap on the chart.
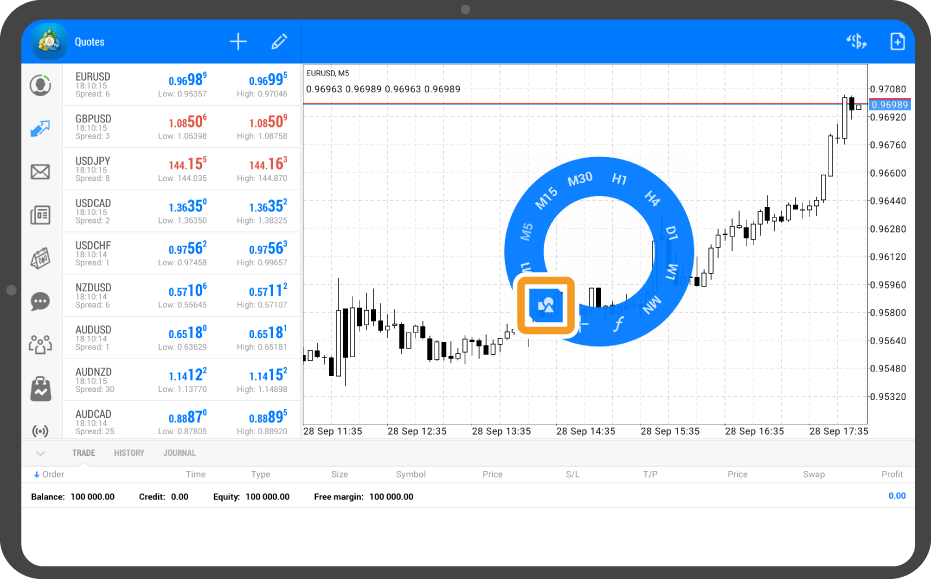
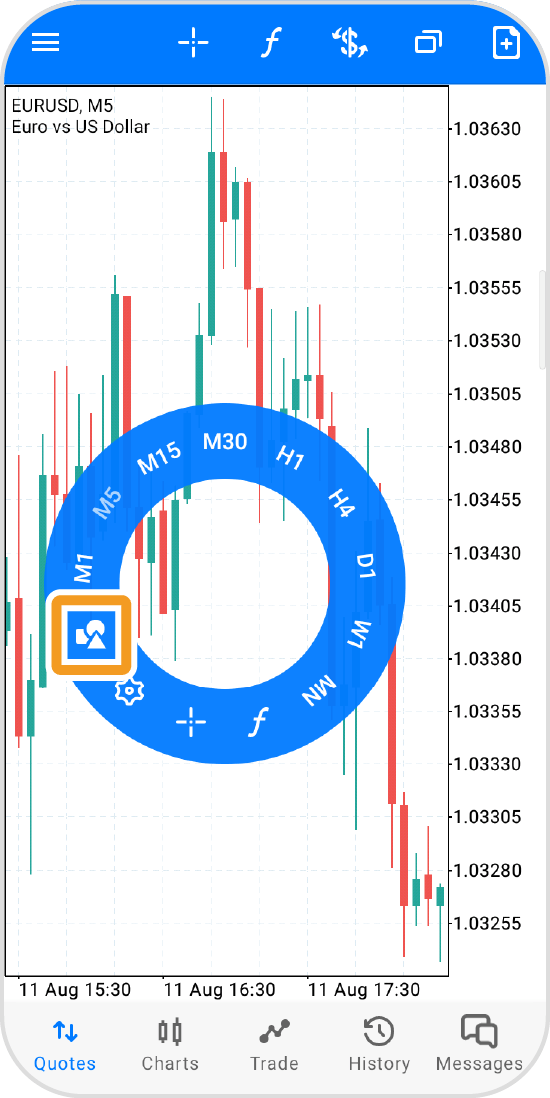
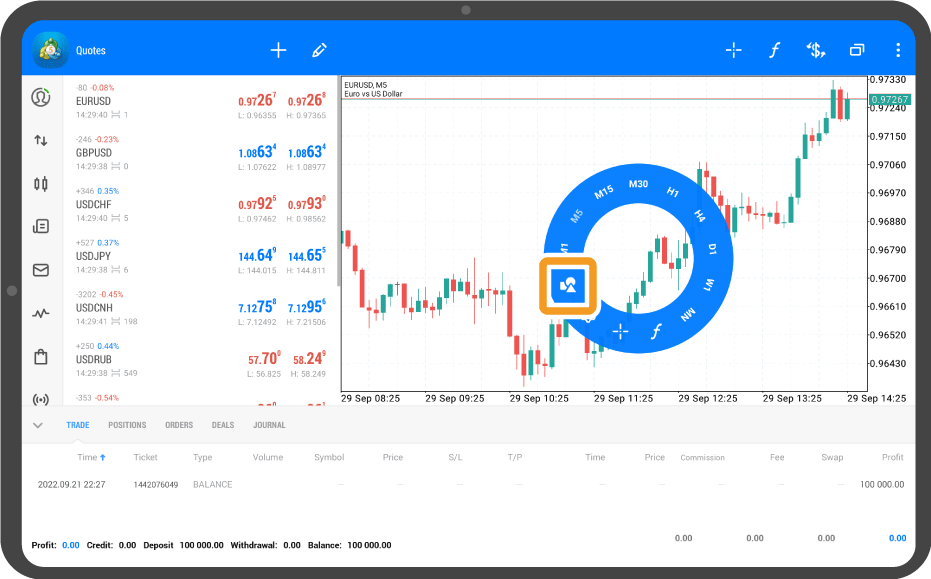
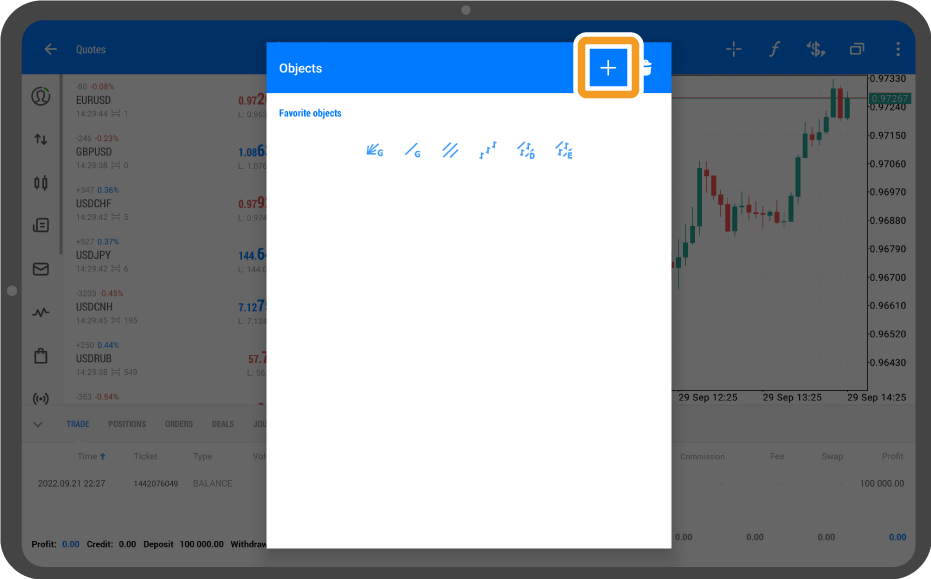
Tap the "Objects" icon.
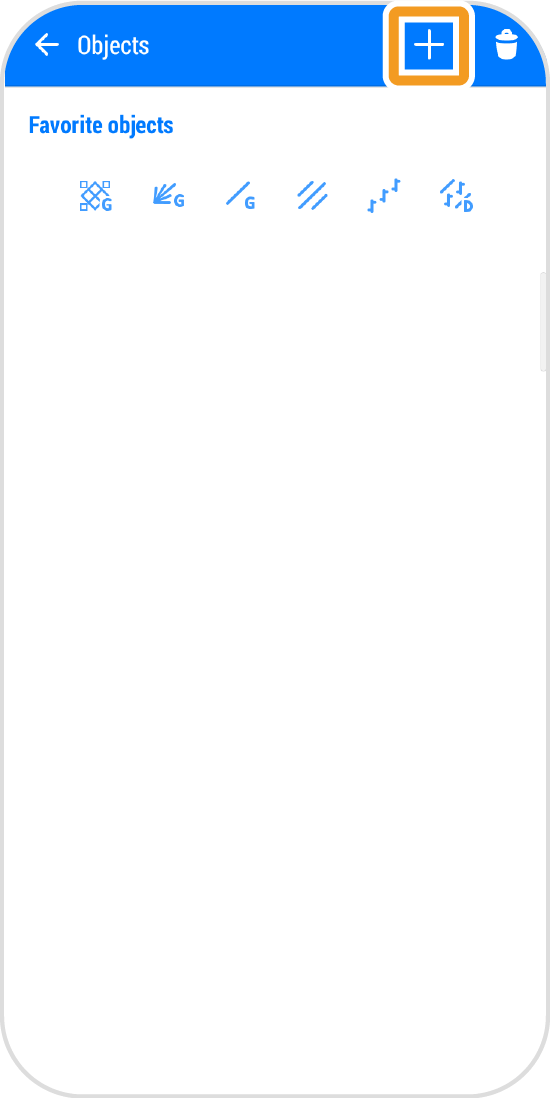
Tap the "+" button in the top right corner.
Tap at the starting point and drag to the end point to adjust the position.
Tap at the starting point and swipe right.
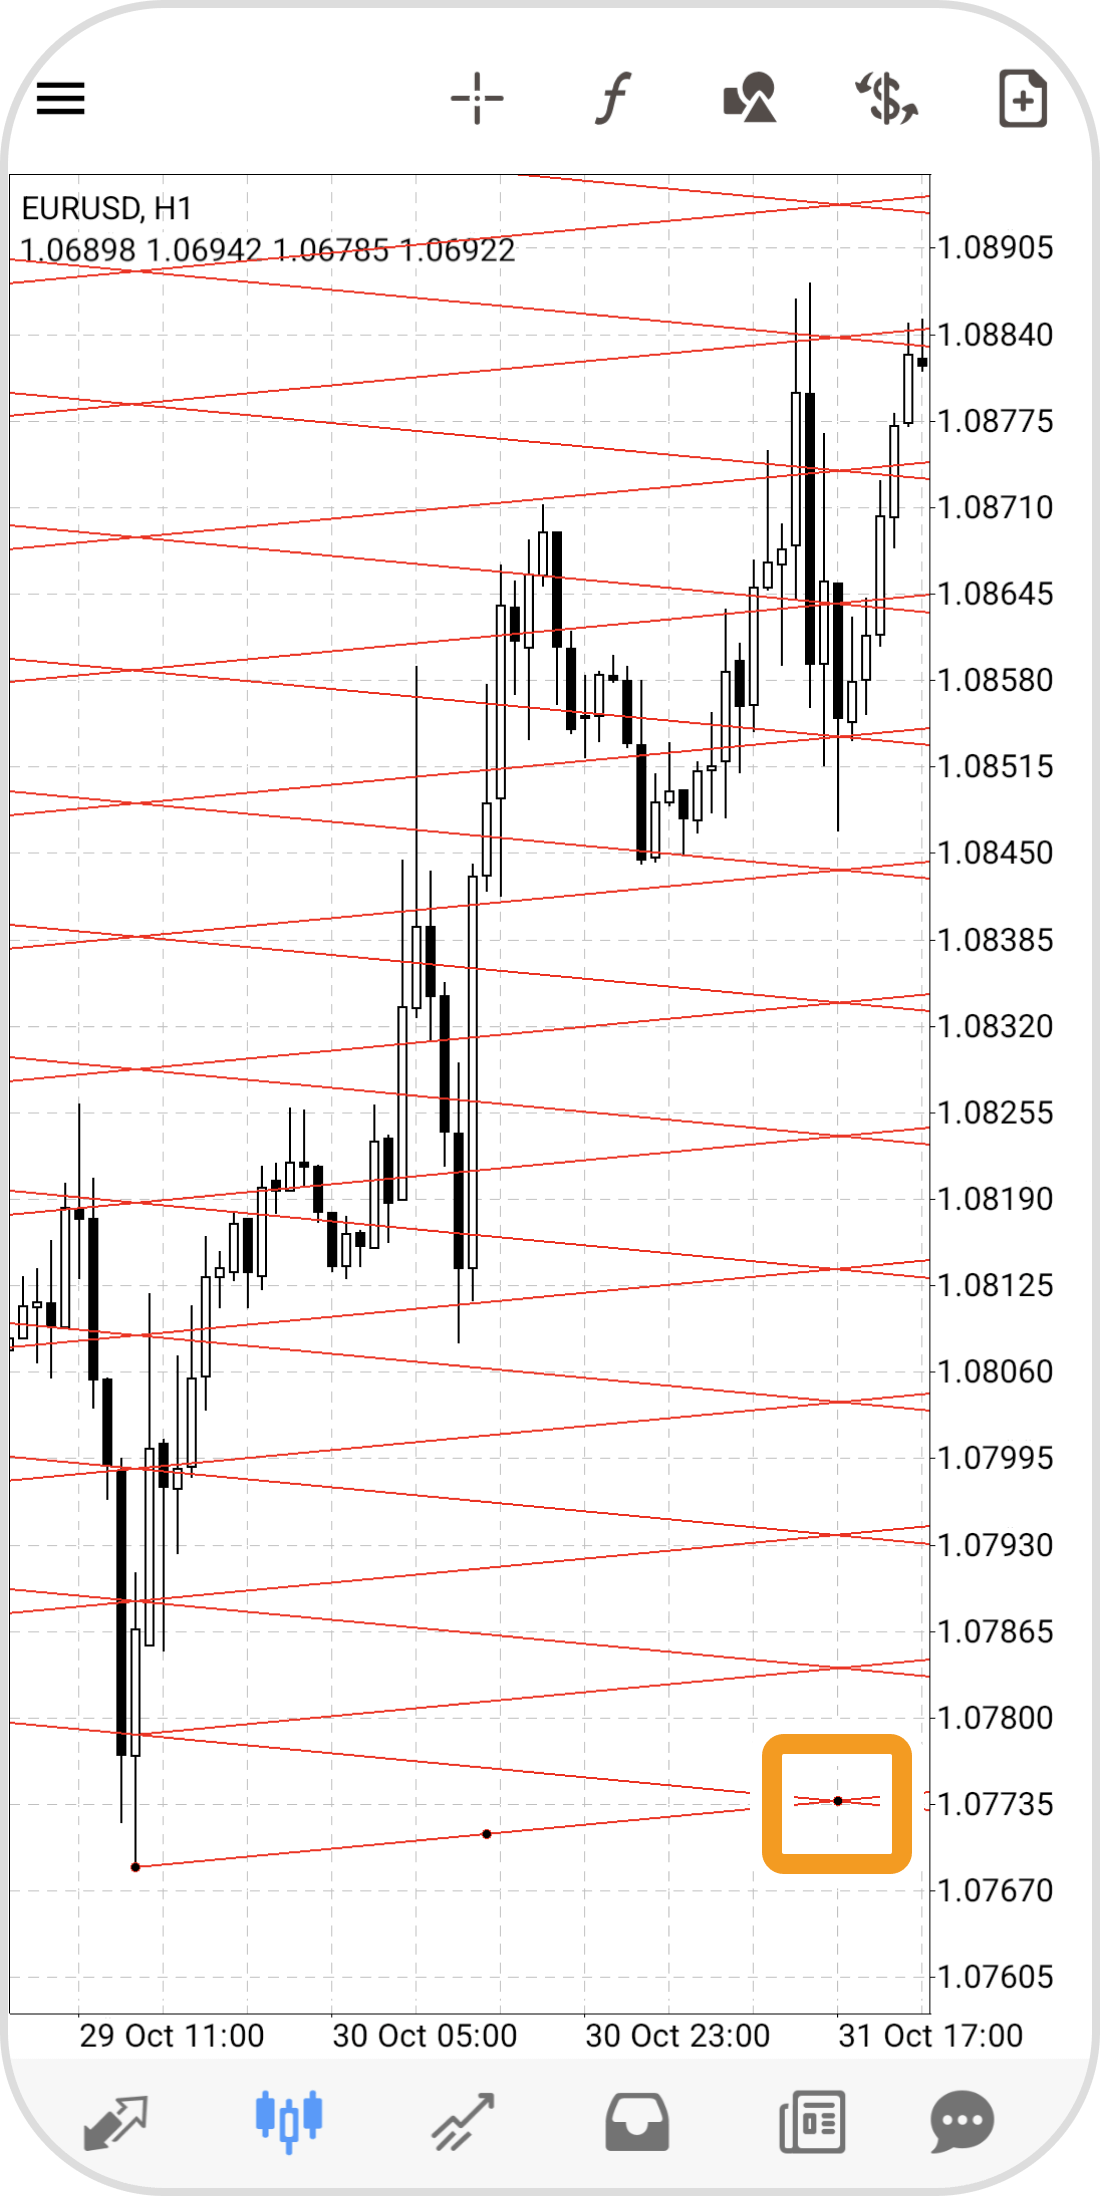
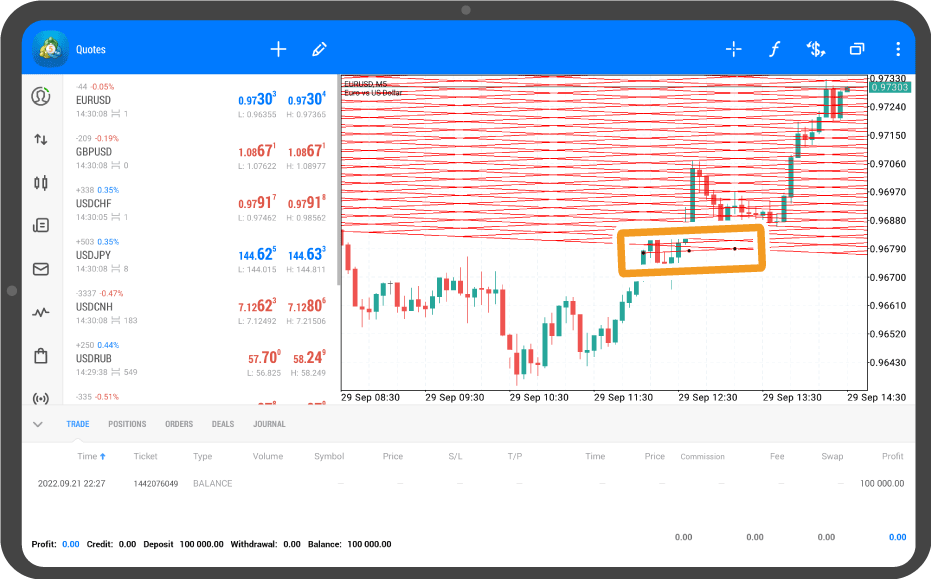
The Gann grid will appear with three black dots. To adjust the endpoint, tap the rightmost dot and drag it to your desired position.
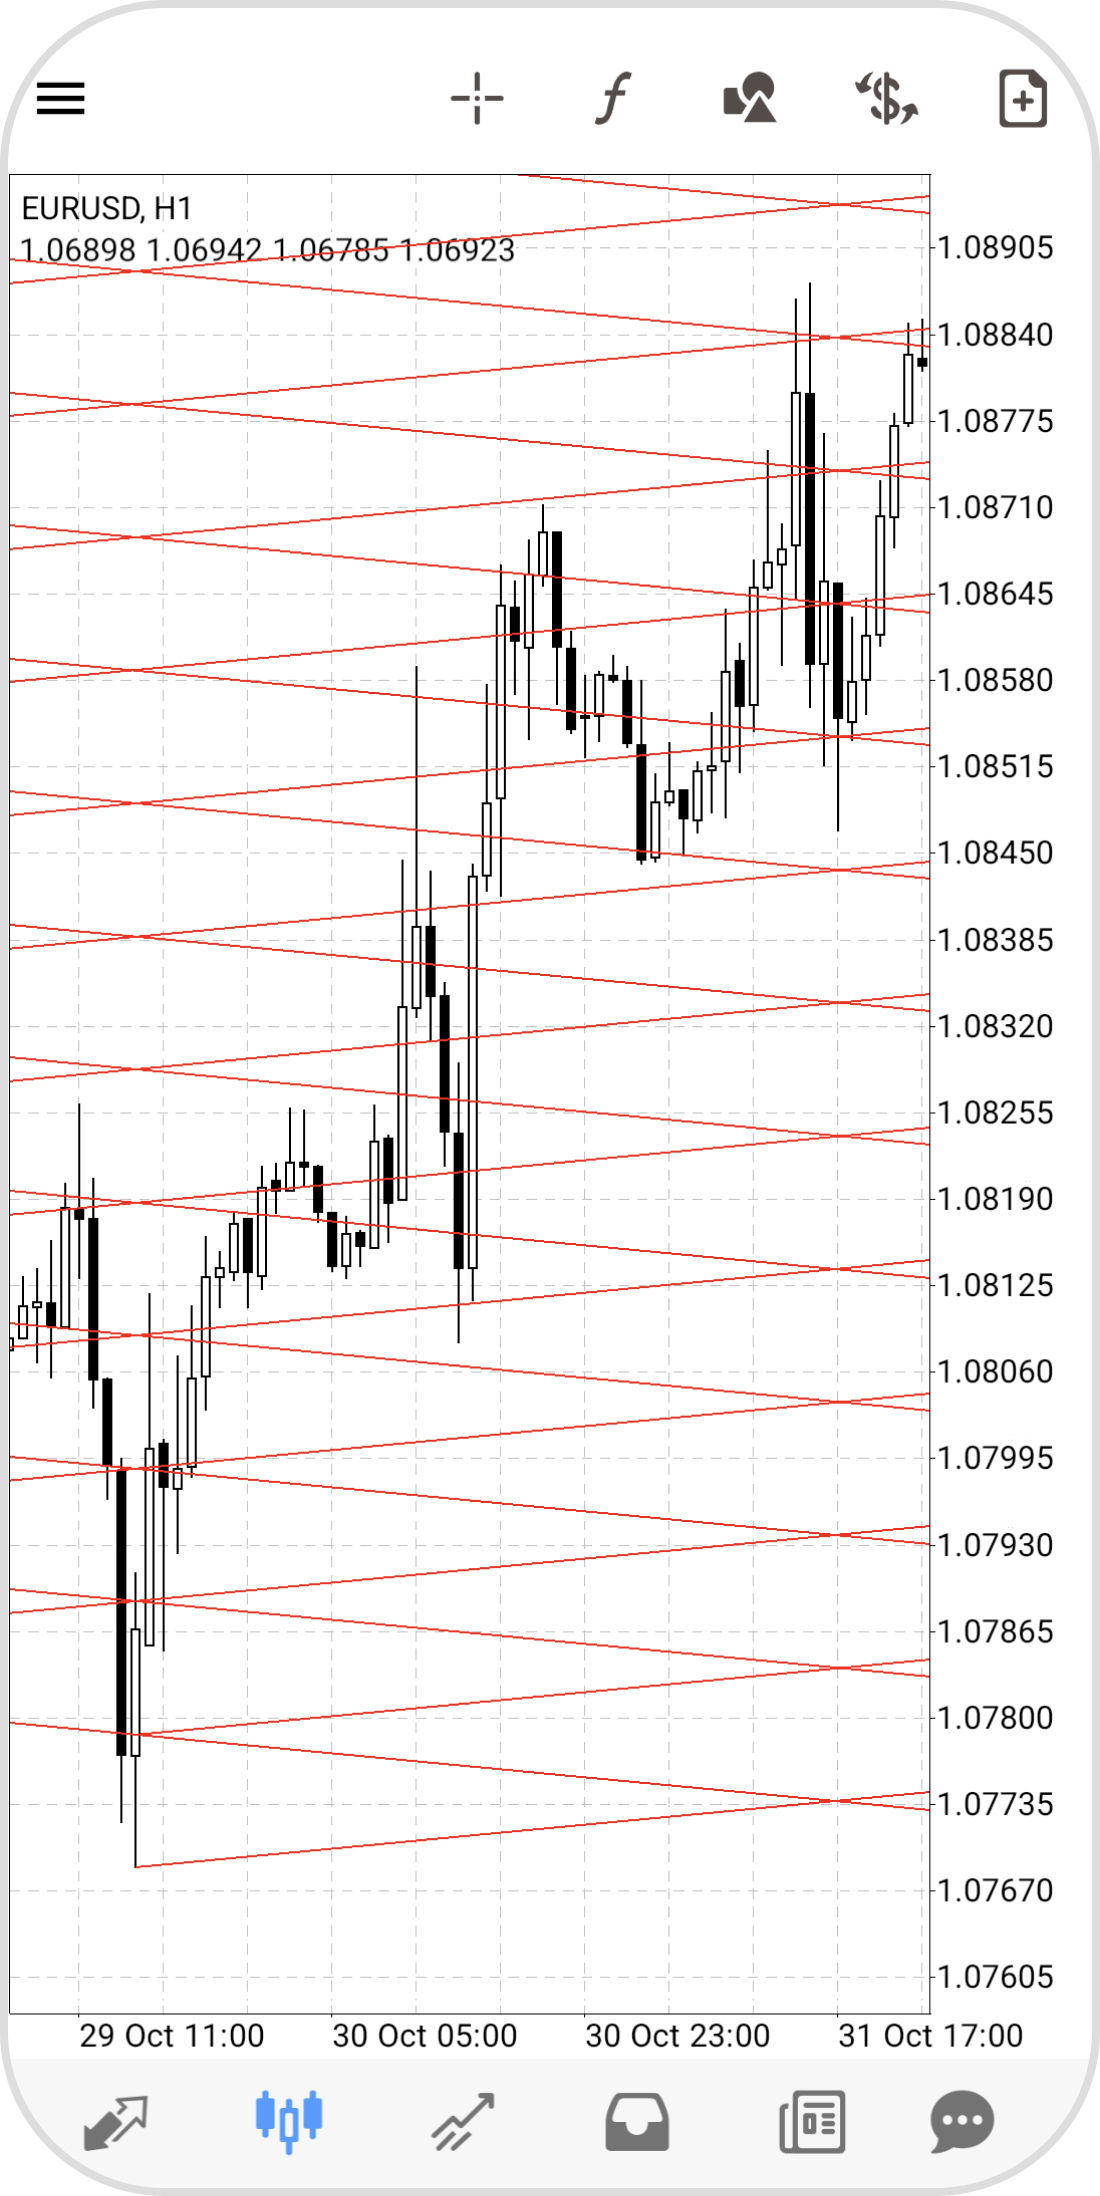
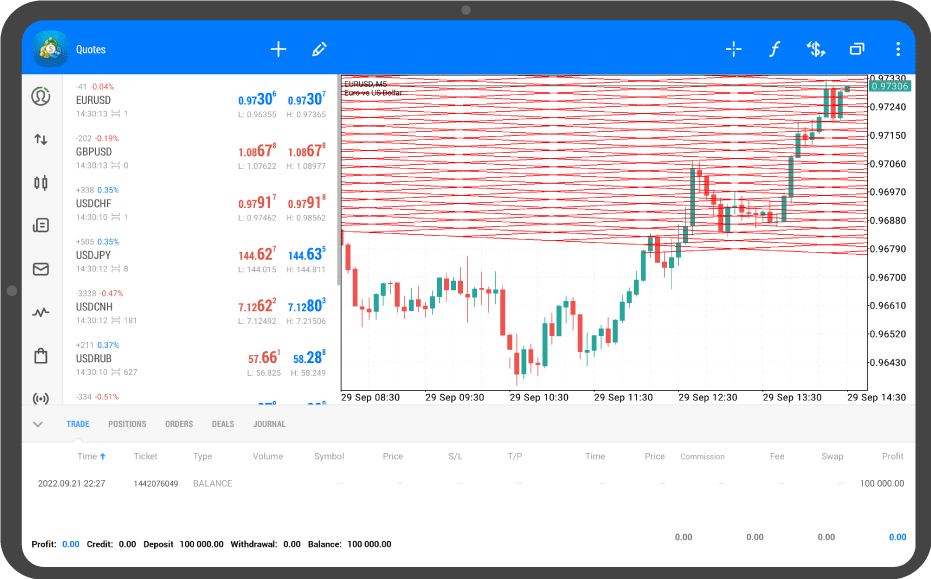
To fix the Gann grid, tap anywhere between the starting point and endpoint to hide the dots.
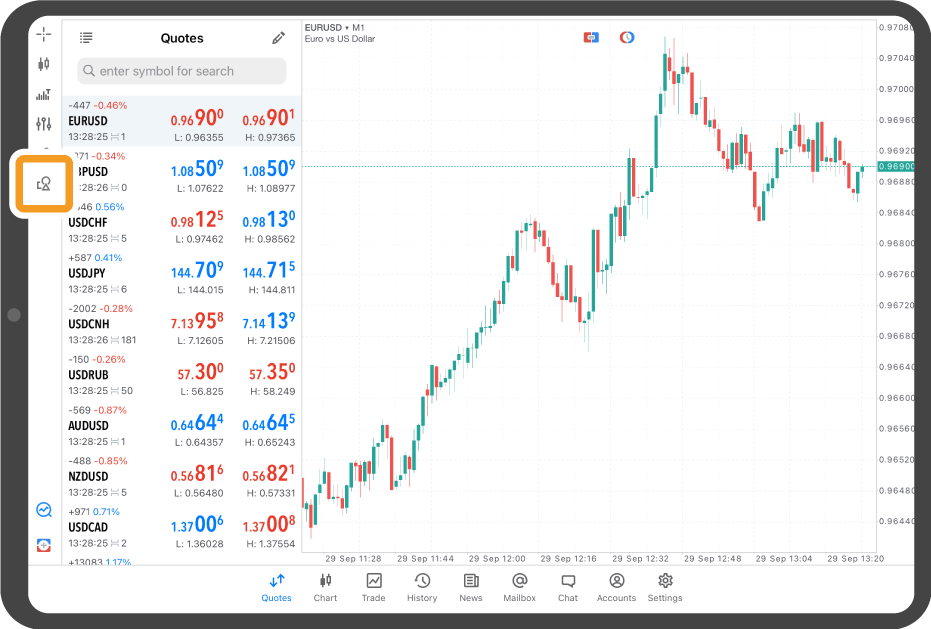
Tap the "Objects" icon on the left.

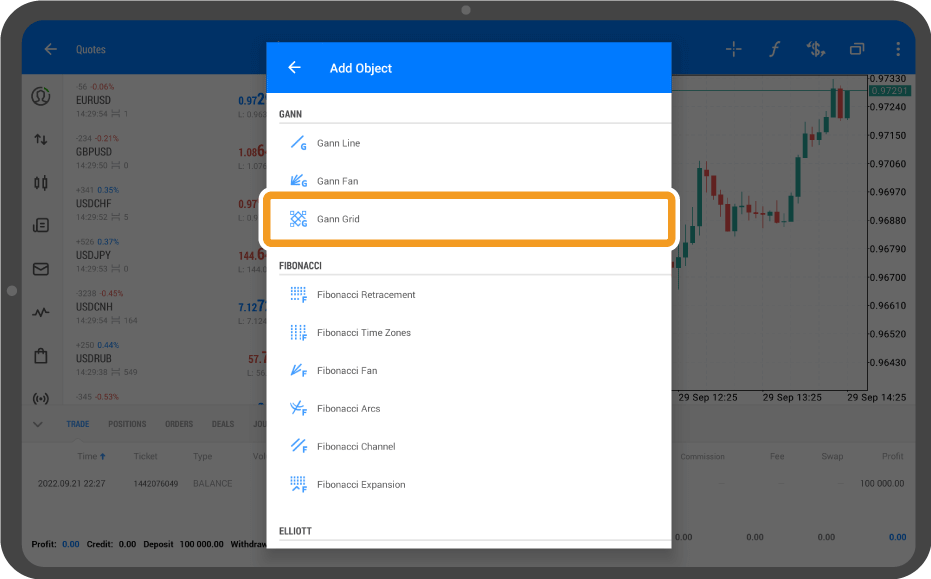
Tap "Add Object".
Tap "Gann Grid".
Tap the starting point and swipe to the position of the endpoint.
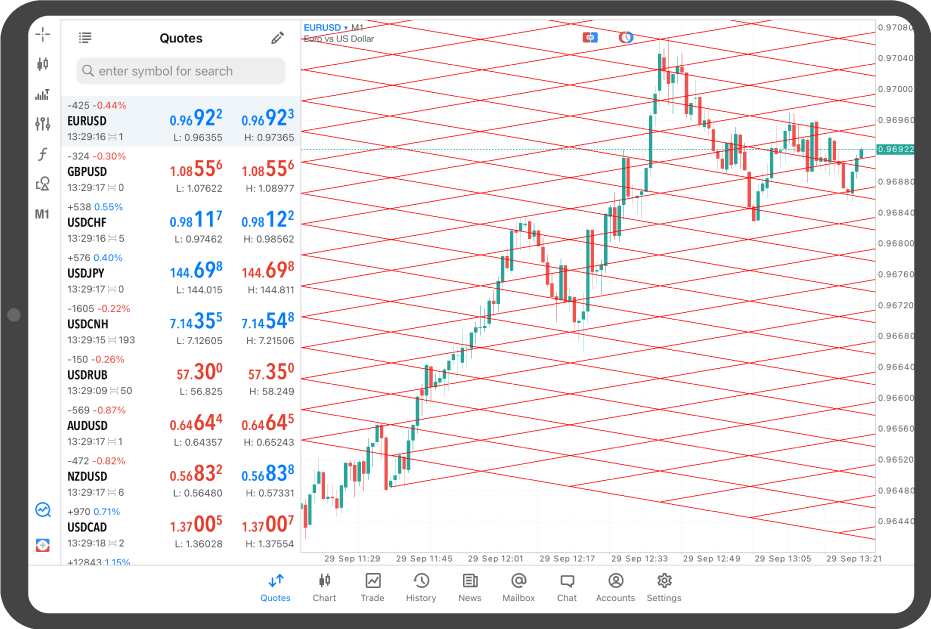
To fix the Gann grid, tap anywhere between the starting point and endpoint to hide the dots.
Tap on the chart.
Tap the "Objects" icon.
The list of objects on the chart will be displayed. Tap "+" in the top right corner.
Tap "Gann Grid".
Tap the starting point and swipe to the position of the endpoint.
To fix the Gann grid, tap around the line with black dots to hide the them.
Tap "Chart" on the bottom navigation bar.
Tap the "Objects" icon at the top.
Tap "Add Object".
Tap "Gann Grid".
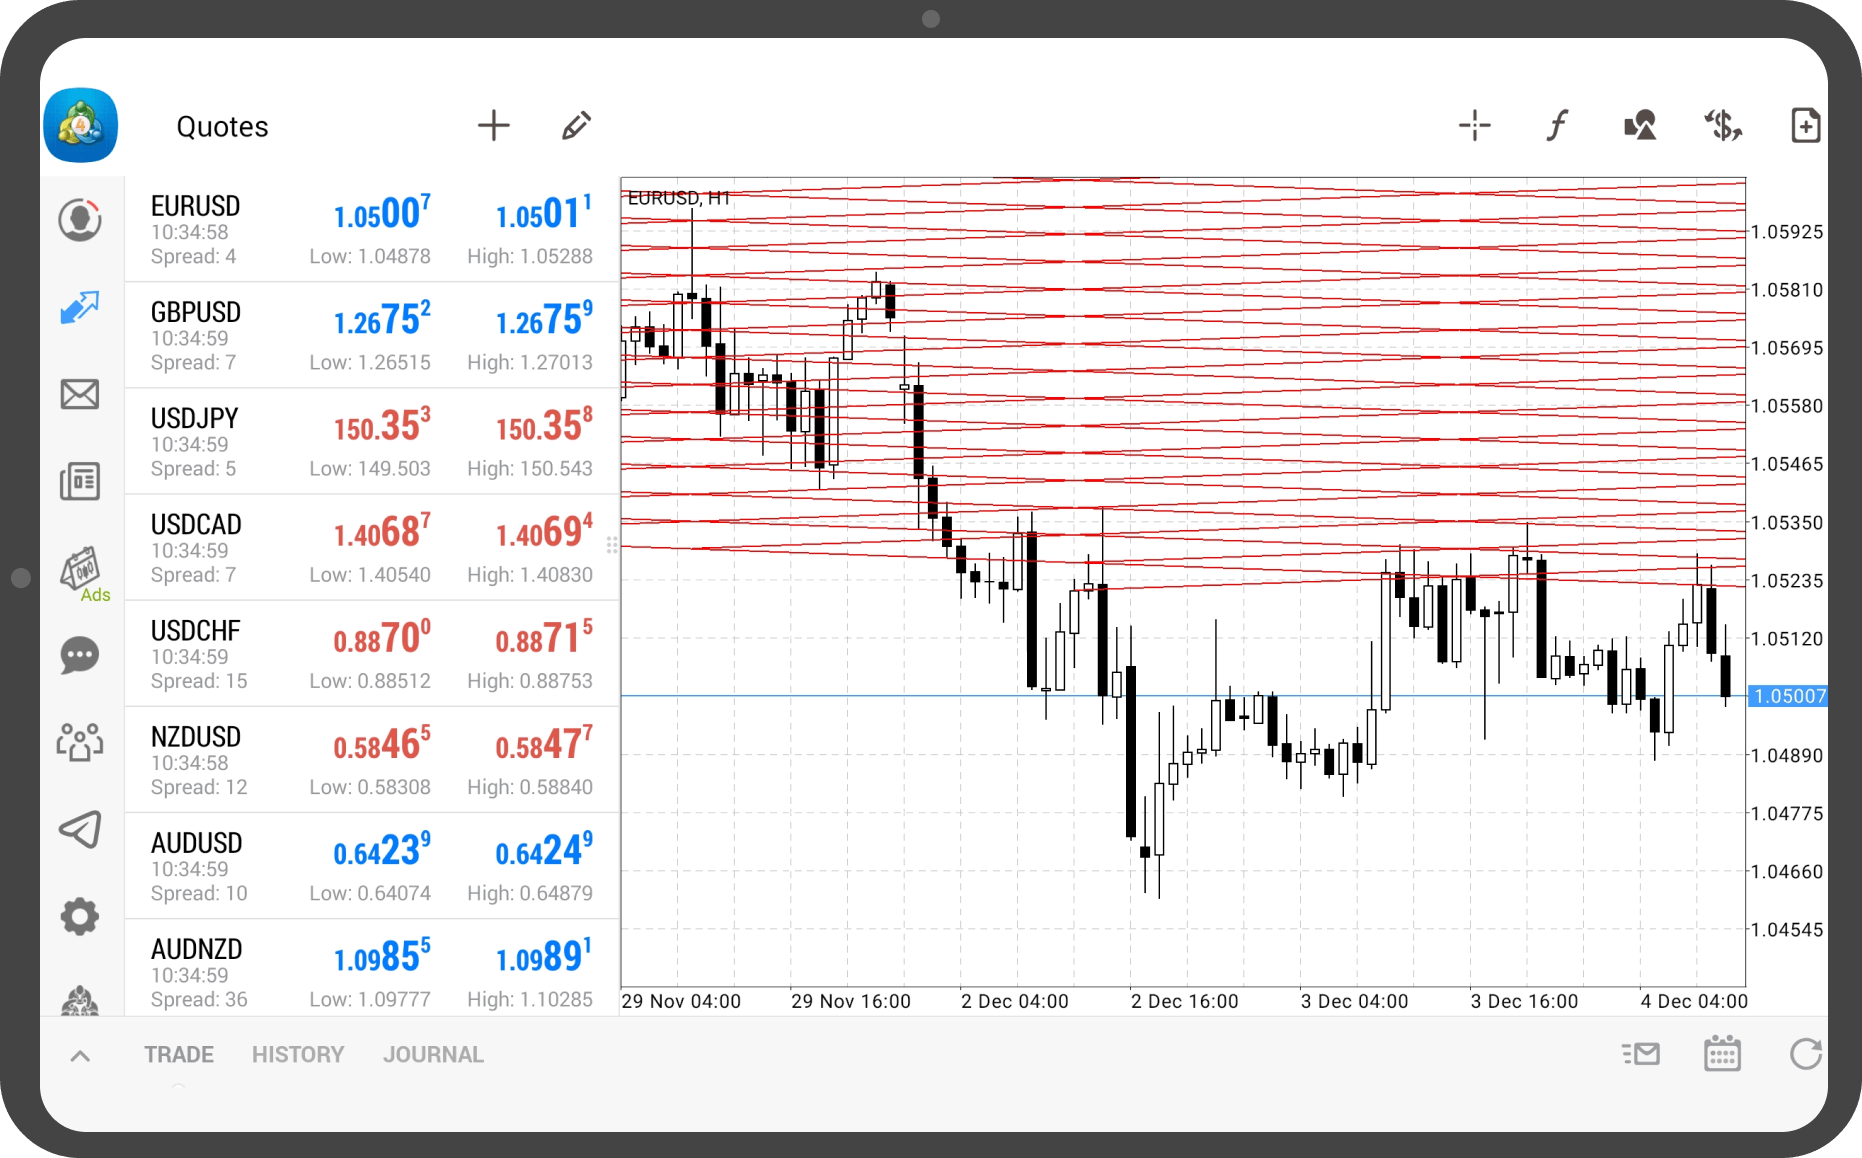
Tap at the starting point and move the end point to adjust the position.
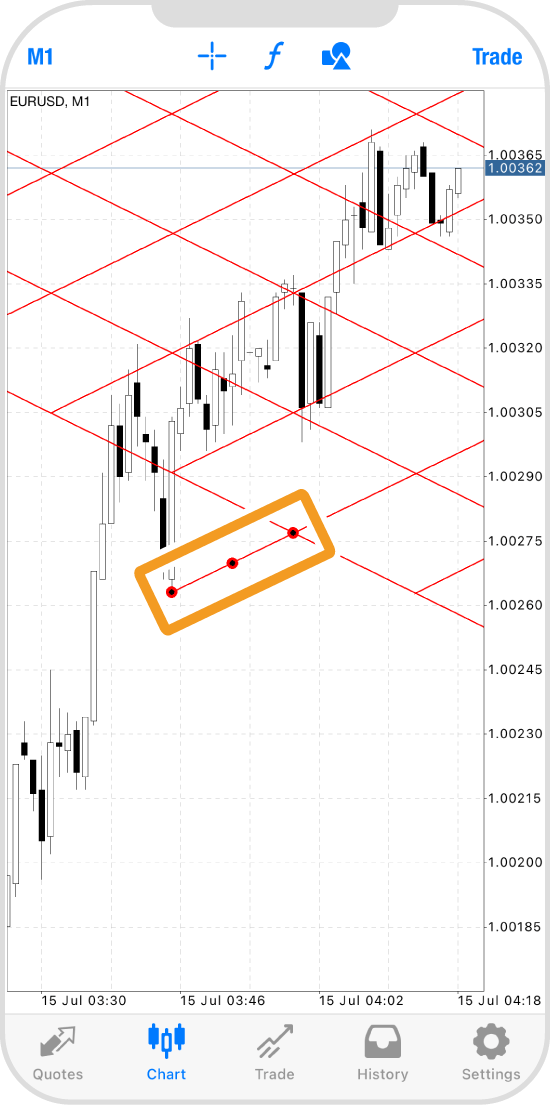
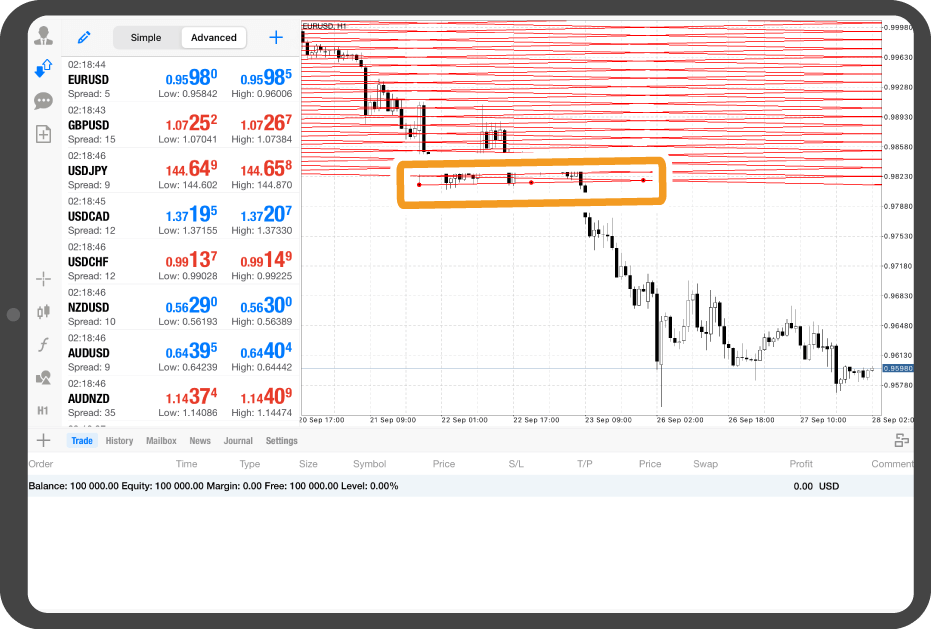
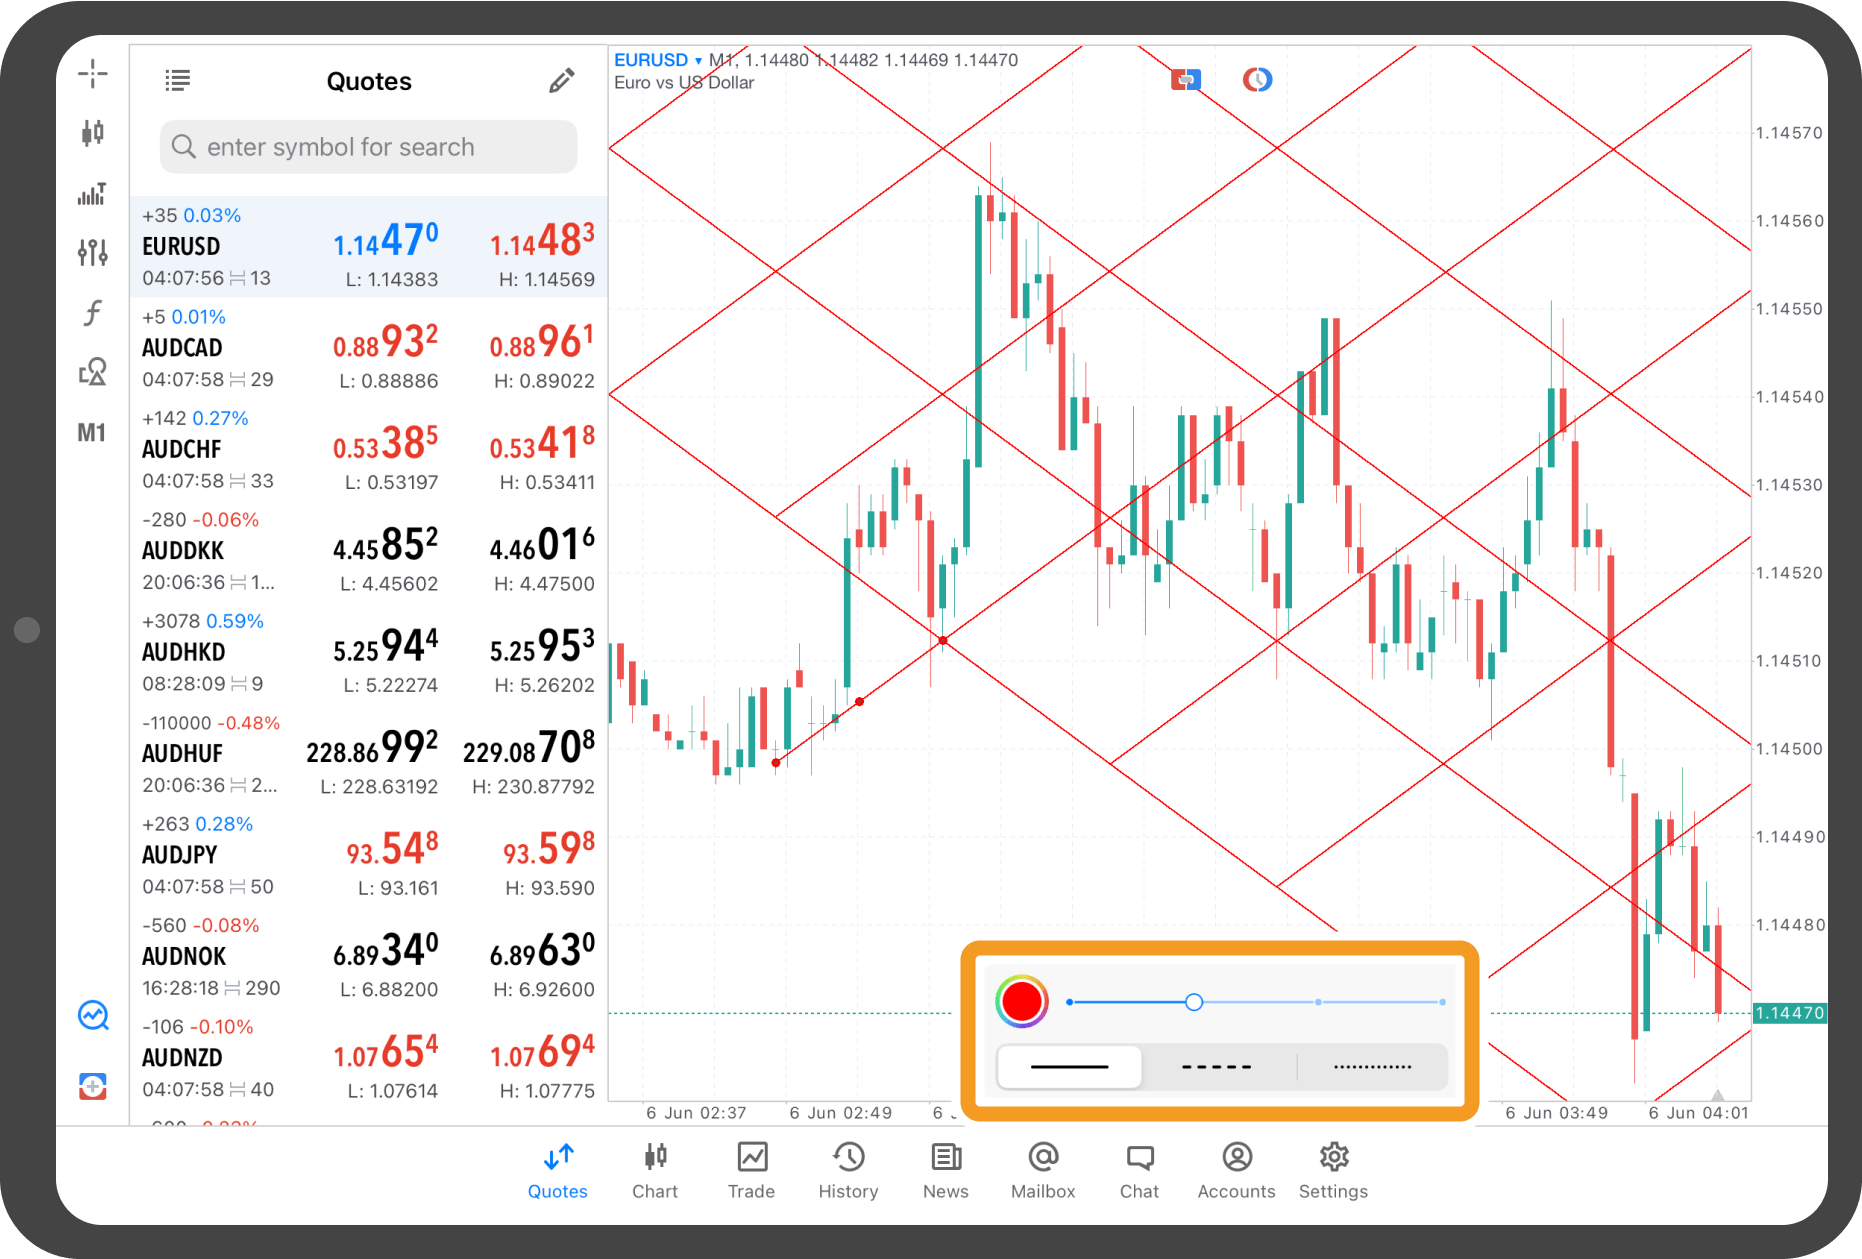
The Gann grid will appear with three red dots. To adjust the endpoint, tap the rightmost dot and drag it to your desired position.
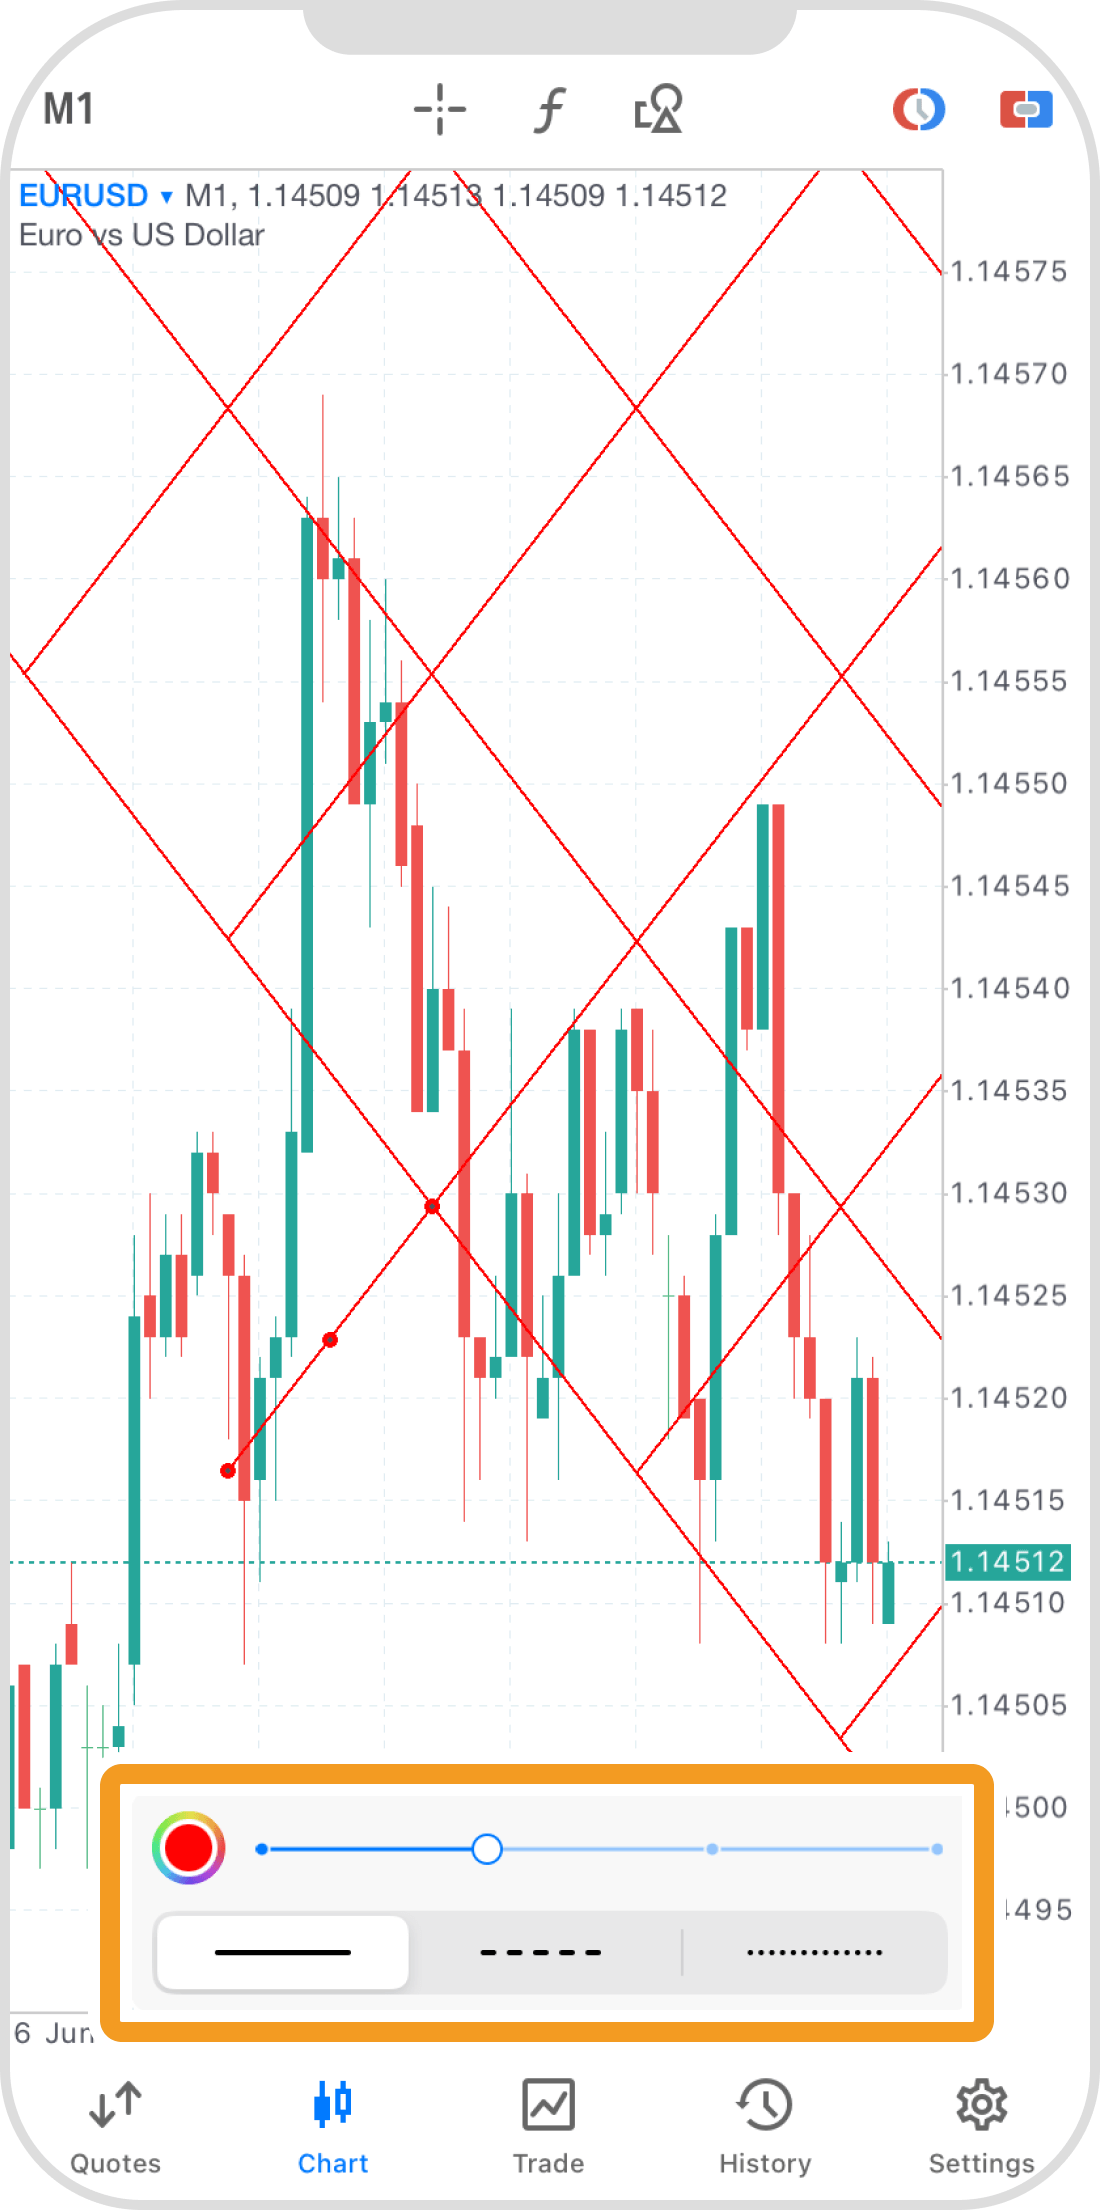
In the menu that appears after swiping, you can also change the line's color, thickness, and style.
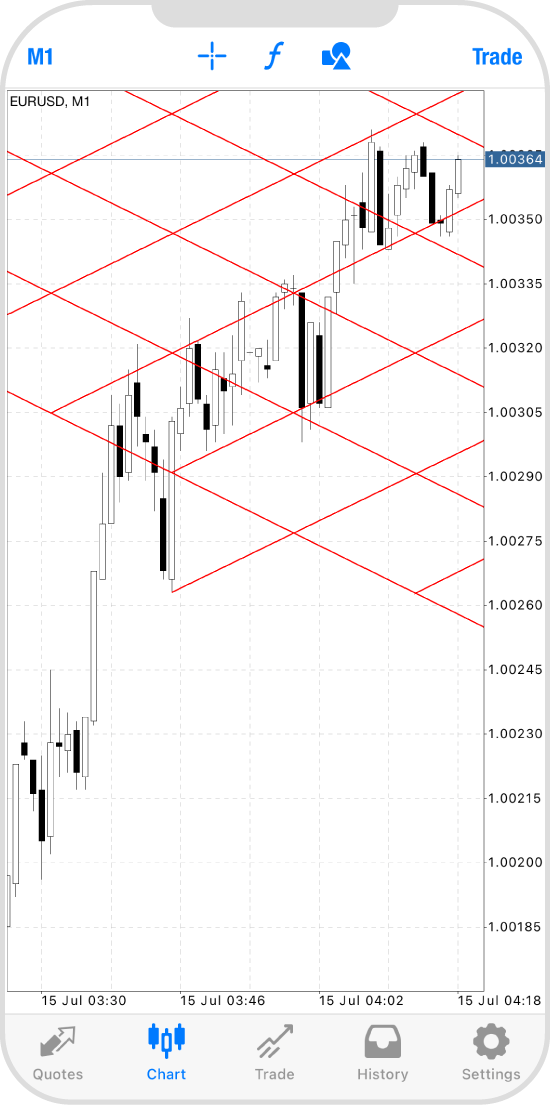
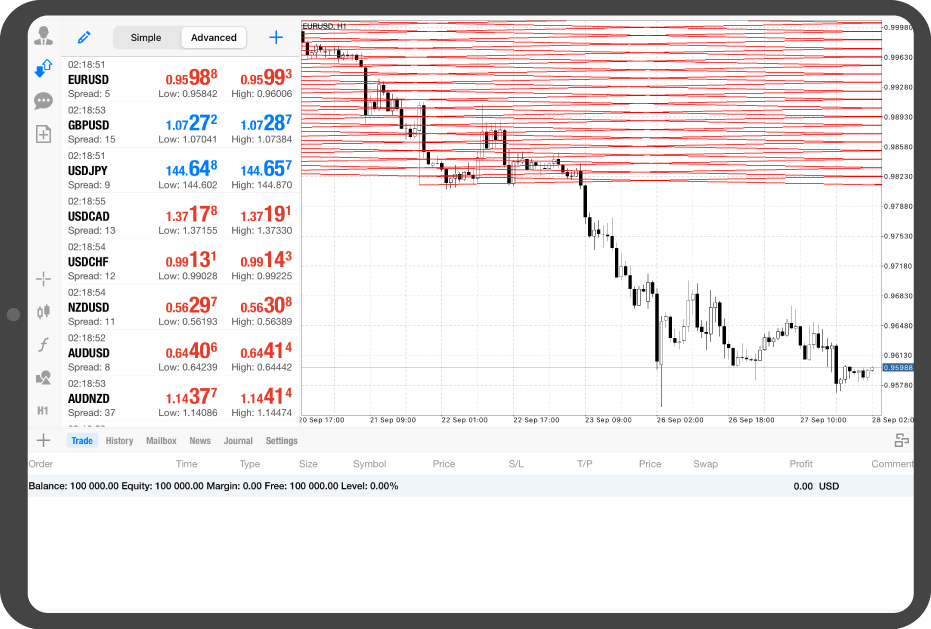
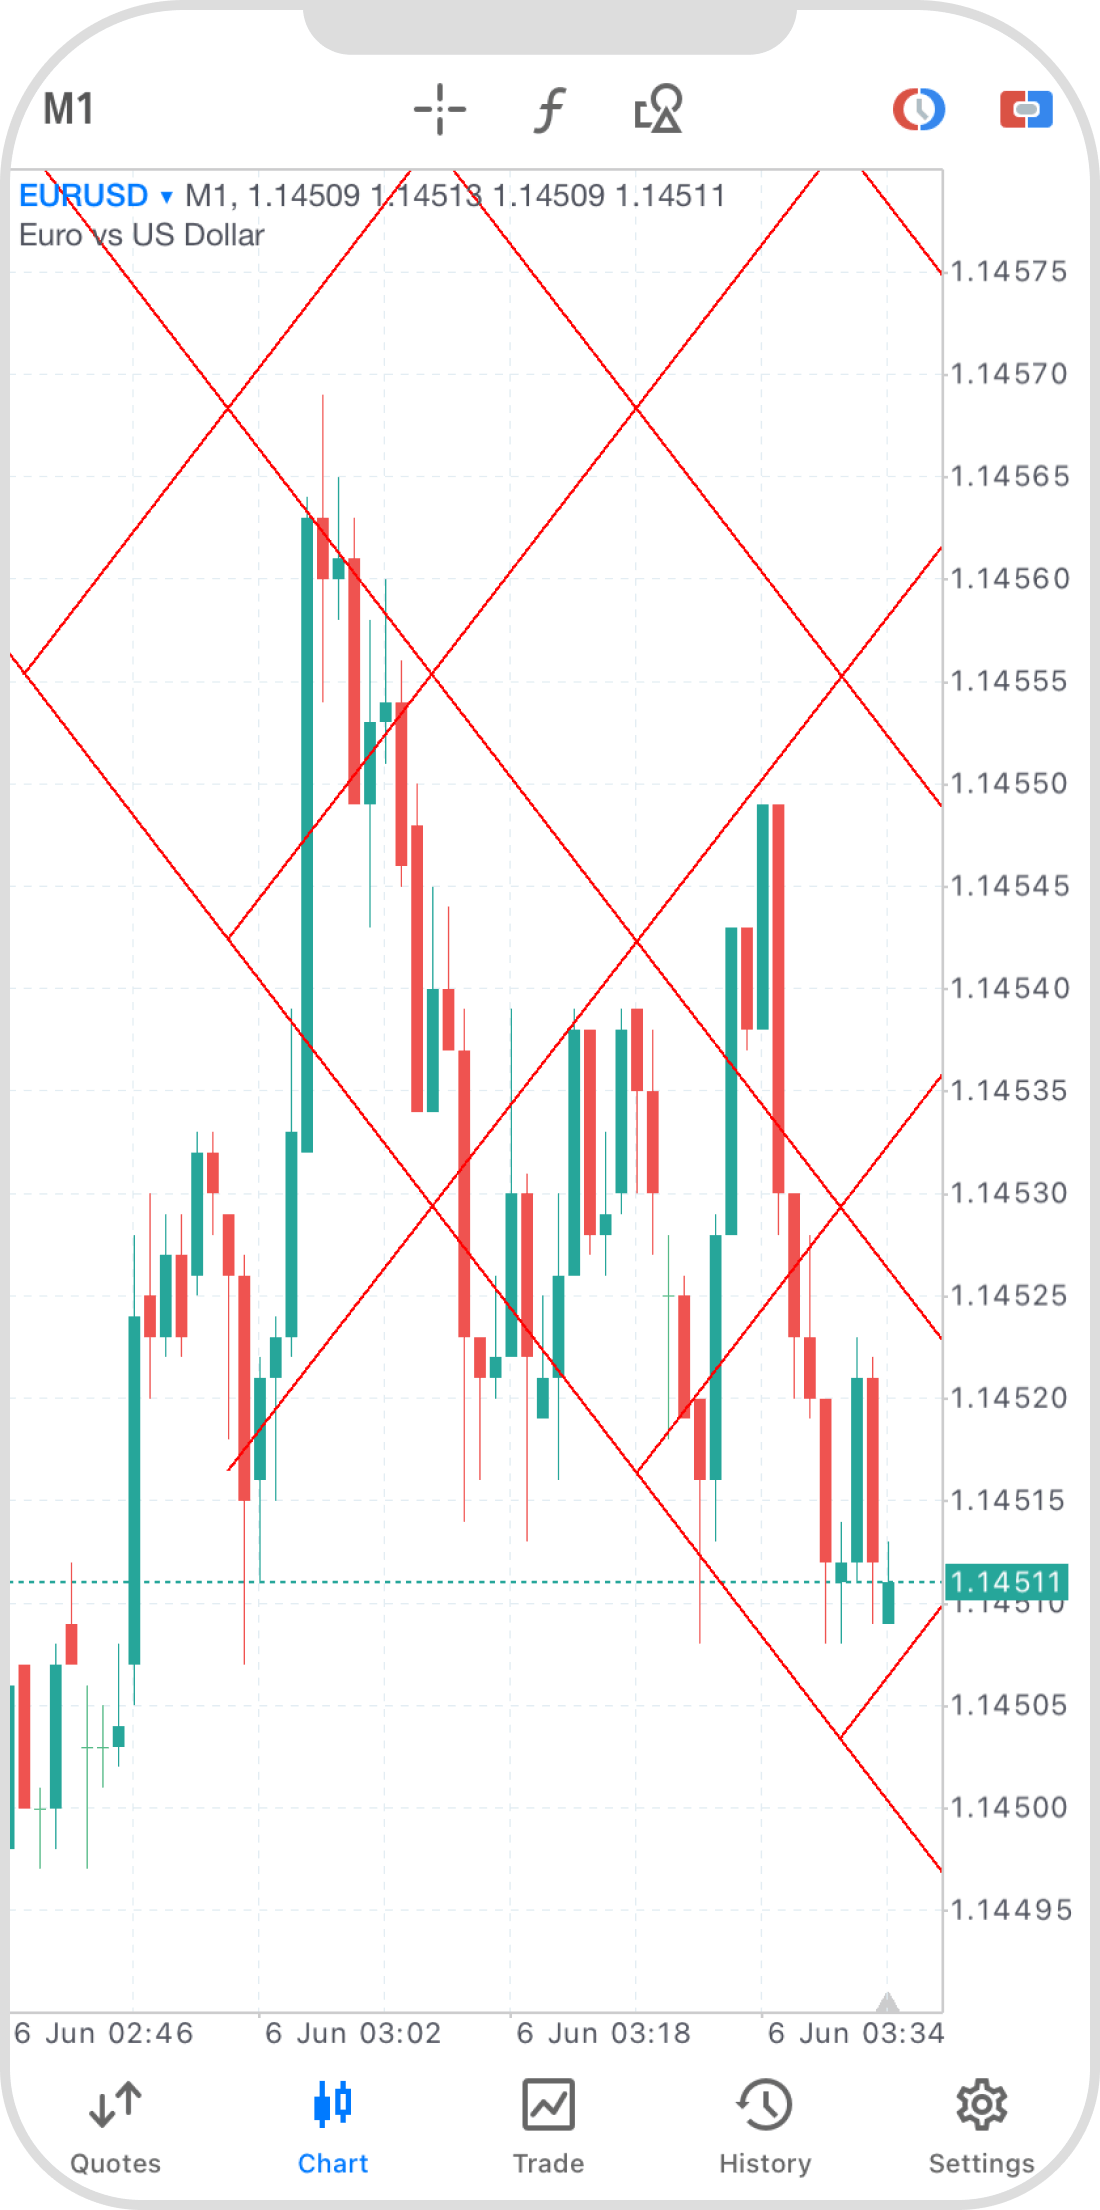
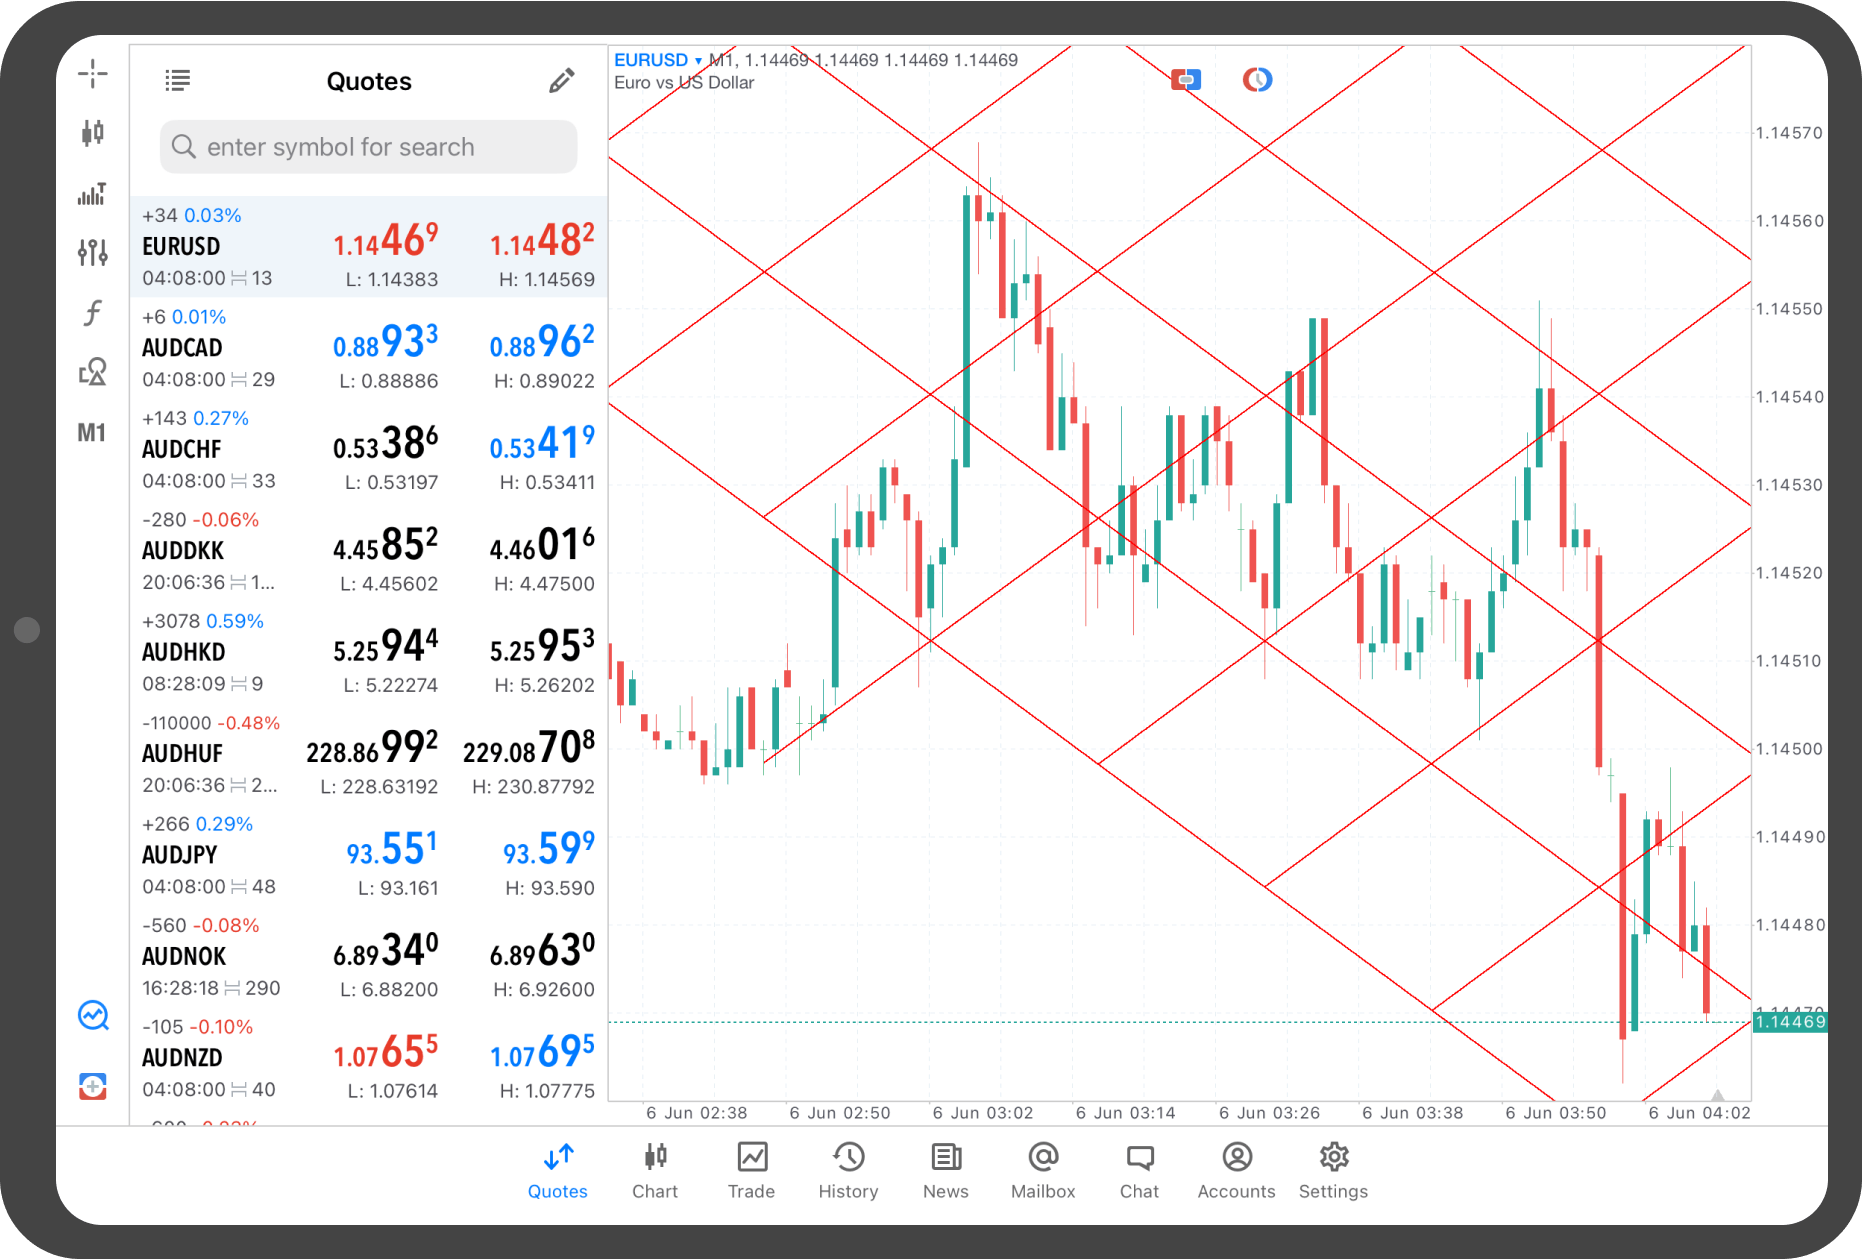
To fix the Gann grid, tap on the line to hide the dots.
Tap "Charts" on the bottom navigation bar.
Tap on the chart.
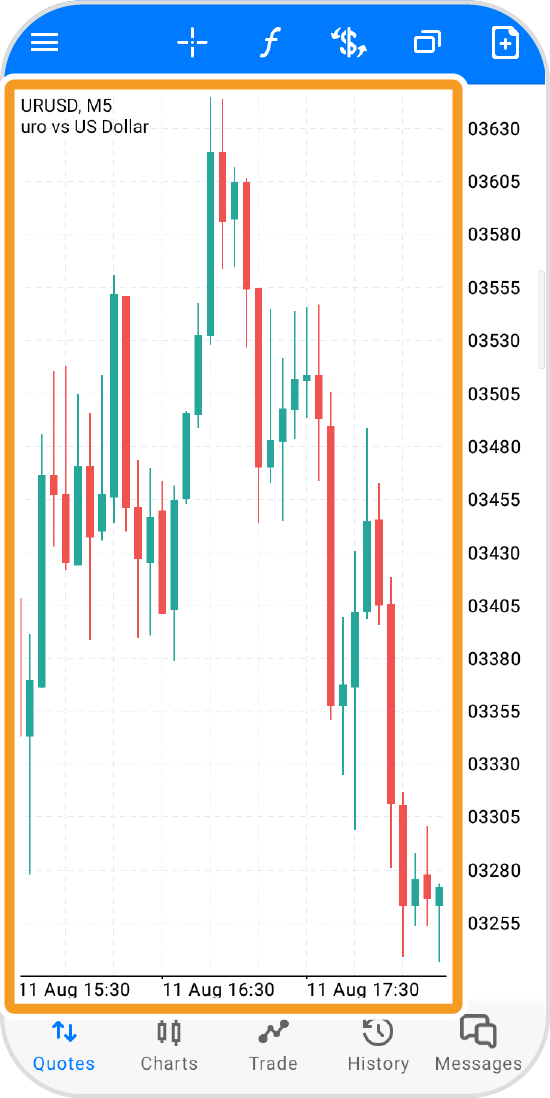
Tap the "Objects" icon.
Tap the "+" icon at the top.
Tap "Gann Grid".
Tap at the starting point and swipe right.
The Gann grid will appear with three black dots. To adjust the endpoint, tap the rightmost dot and drag it to your desired position.
To fix the Gann grid, double-tap anywhere between the starting point and endpoint to hide the dots.

Tap the "Objects" icon on the left.
Tap "Add Object".
Tap "Gann Grid".
Tap at the starting point and swipe right.
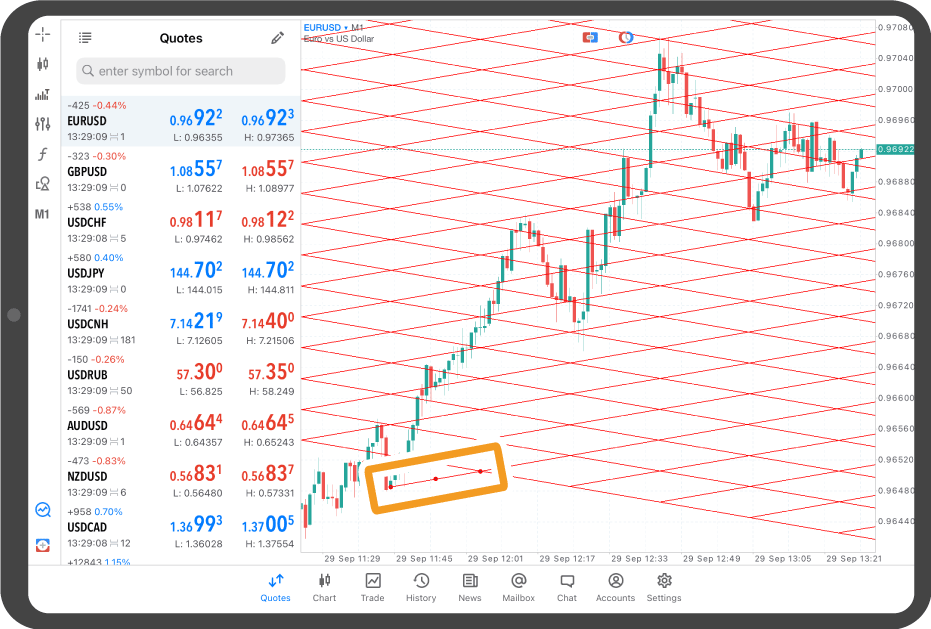
The Gann grid will appear with three red dots. To adjust the endpoint, tap the rightmost dot and drag it to your desired position.
In the menu that appears after swiping, you can also change the line's color, thickness, and style.
To fix the Gann grid, tap around the line with red dots to hide the them.
Tap on the chart.
Tap the "Objects" icon.
Tap the "+" icon at the top.
Tap "Gann Grid".
Tap at the starting point and swipe right.
The Gann grid will appear with three black dots. To adjust the endpoint, tap the rightmost dot and drag it to your desired position.
To fix the Gann grid, double-tap around the line with black dots to hide the them.

Was this article helpful?
0 out of 0 people found this article helpful.
Thank you for your feedback.