- Features
-
Services/ProductsServices/ProductsServices/Products

Learn more about the retail trading conditions, platforms, and products available for trading that FXON offers as a currency broker.
You can't start without it.
Trading Platforms Trading Platforms Trading Platforms
Features and functionality comparison of MetaTrader 4/5, and correspondence table of each function by OS
Two account types to choose
Trading Account Types Trading Account Types Trading Account Types
Introducing FXON's Standard and Elite accounts.
close close

-
SupportSupportSupport

Support information for customers, including how to open an account, how to use the trading tools, and a collection of QAs from the help desk.
Recommended for beginner!
Account Opening Account Opening Account Opening
Detailed explanation of everything from how to open a real account to the deposit process.
MetaTrader4/5 User Guide MetaTrader4/5 User Guide MetaTrader4/5 User Guide
The most detailed explanation of how to install and operate MetaTrader anywhere.
FAQ FAQ FAQ
Do you have a question? All the answers are here.
Coming Soon
Glossary Glossary GlossaryGlossary of terms related to trading and investing in general, including FX, virtual currencies and CFDs.
News News News
Company and License Company and License Company and License
Sitemap Sitemap Sitemap
Contact Us Contact Us Contact Us
General, personal information and privacy inquiries.
close close

- Promotion
- Trader's Market
- Partner
-
close close
Learn more about the retail trading conditions, platforms, and products available for trading that FXON offers as a currency broker.
You can't start without it.
Features and functionality comparison of MetaTrader 4/5, and correspondence table of each function by OS
Two account types to choose
Introducing FXON's Standard and Elite accounts.
Support information for customers, including how to open an account, how to use the trading tools, and a collection of QAs from the help desk.
Recommended for beginner!
Detailed explanation of everything from how to open a real account to the deposit process.
The most detailed explanation of how to install and operate MetaTrader anywhere.
Do you have a question? All the answers are here.
Coming Soon
Glossary of terms related to trading and investing in general, including FX, virtual currencies and CFDs.
General, personal information and privacy inquiries.
Useful information for trading and market information is posted here. You can also view trader-to-trader trading performance portfolios.
Find a trading buddy!
Share trading results among traders. Share operational results and trading methods.
- Legal Documents TOP
- Client Agreement
- Risk Disclosure and Warning Notice
- Order and Execution Policy
- Complaints Procedure Policy
- AML/CFT and KYC Policy
- Privacy Policy
- eKYC Usage Policy
- Cookies Policy
- Website Access and Usage Policy
- Introducer Agreement
- Business Partner Agreement
- VPS Service Terms and Condition


This article was :
published
updated
On MetaTrader4 (MT4) / MetaTrader5 (MT5), you can display the Bollinger Bands, which consists of a set of trendlines plotted based on the standard deviations above and below a moving average of the price. The Bollinger Bands let you see the volatility at a glance and give you an idea of how much the price is dispersed from the average.
Here we will look at how to add the Bollinger Bands to a chart on MT4/MT5.
Switch between MT4/MT5 tabs to check the steps for each.
Step 1
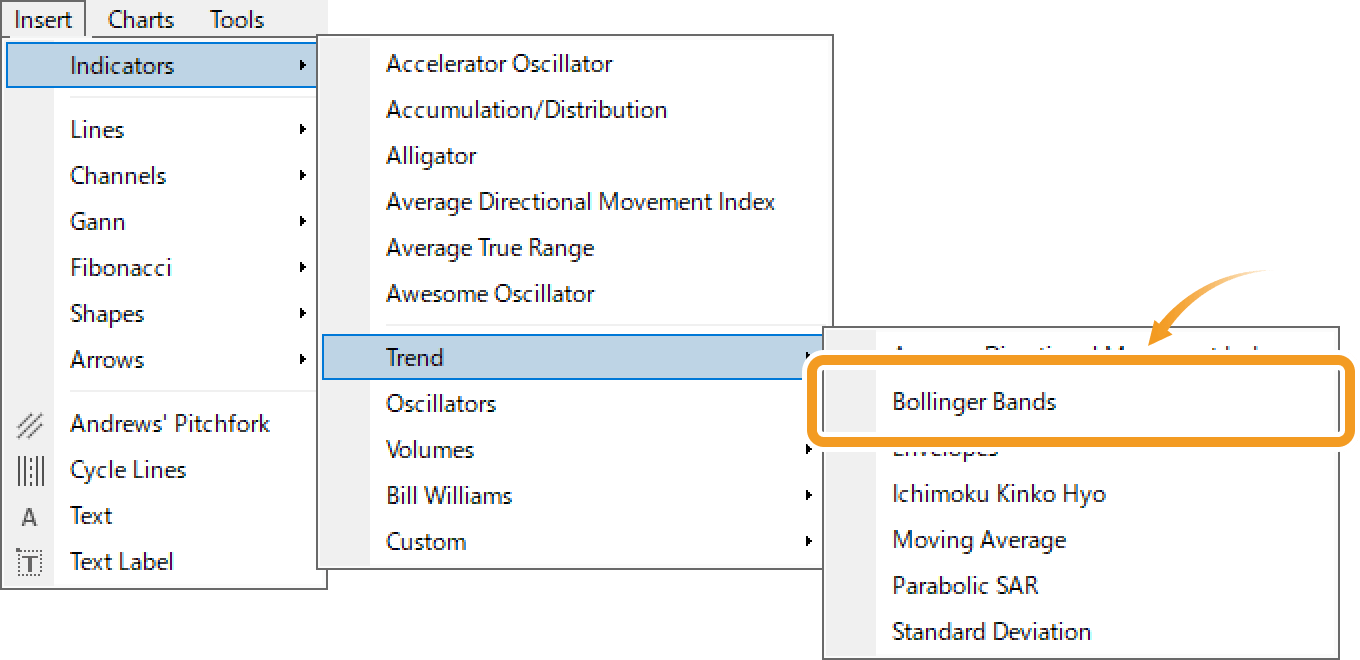
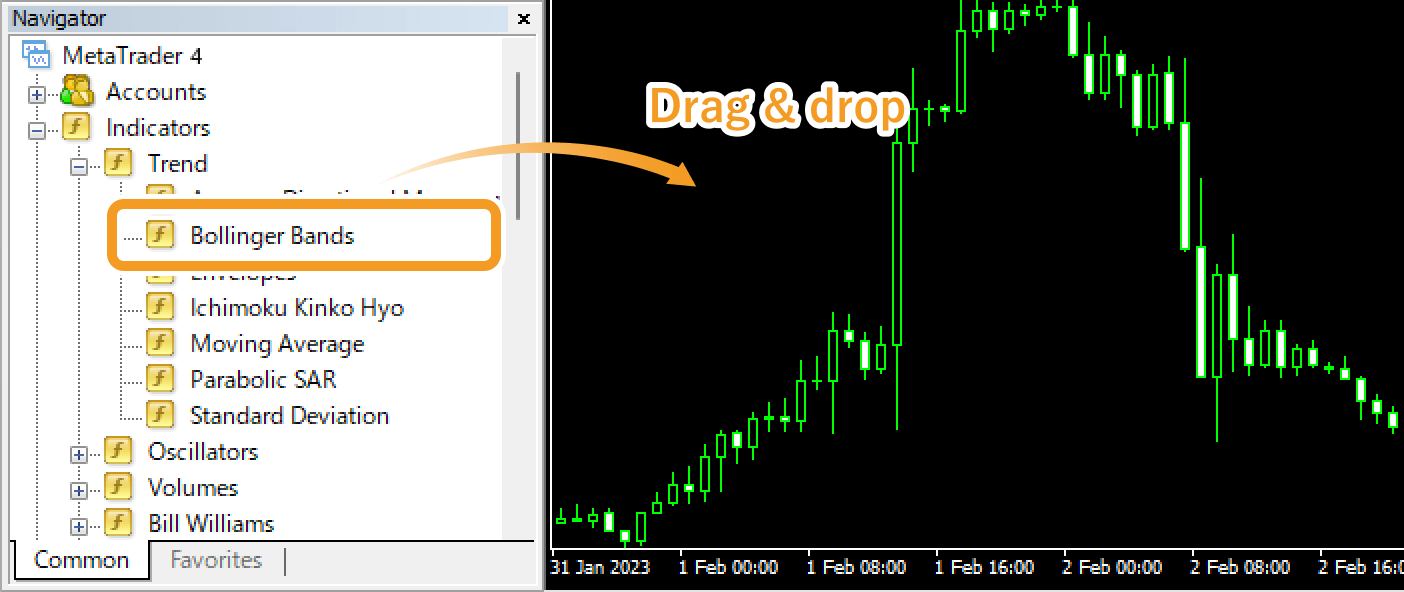
The Bollinger Bands can be set up from the menu or Navigator.
The middle line of the Bollinger Bands is a simple moving average (SMA). Changing it to an exponential moving average (EMA) or other MAs, or hiding it is not allowed in MT4/MT5.
Add Bollinger Bands from the menu
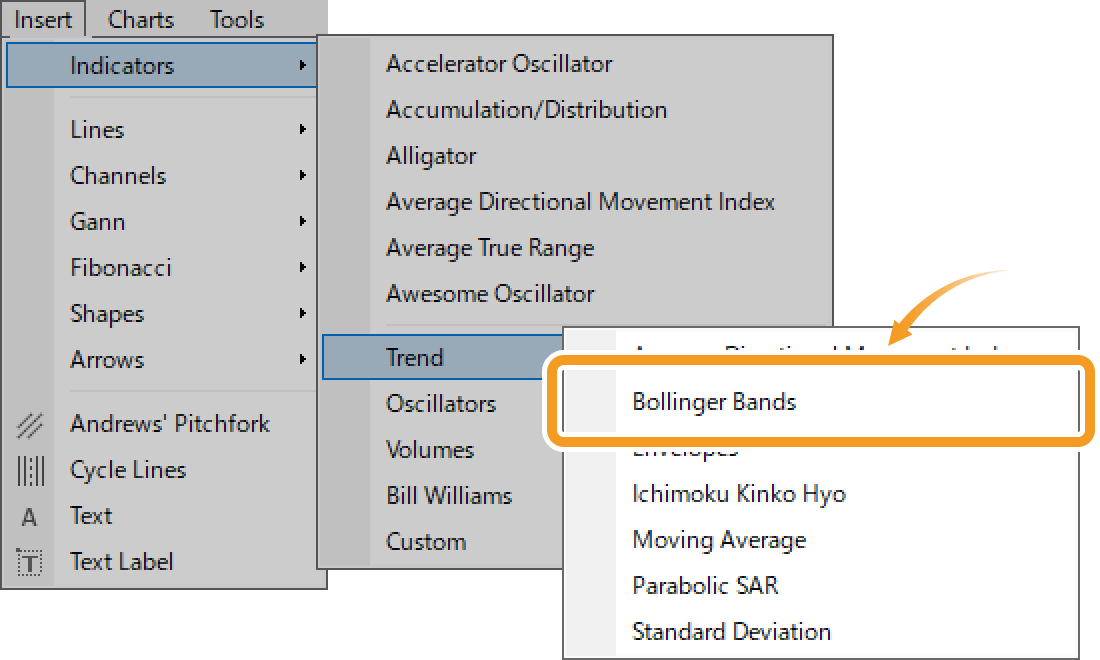
Click "Insert" in the menu. Hover the pointer over "Indicators" > "Trend" and select "Bollinger Bands".
Add Bollinger Bands from the Navigator
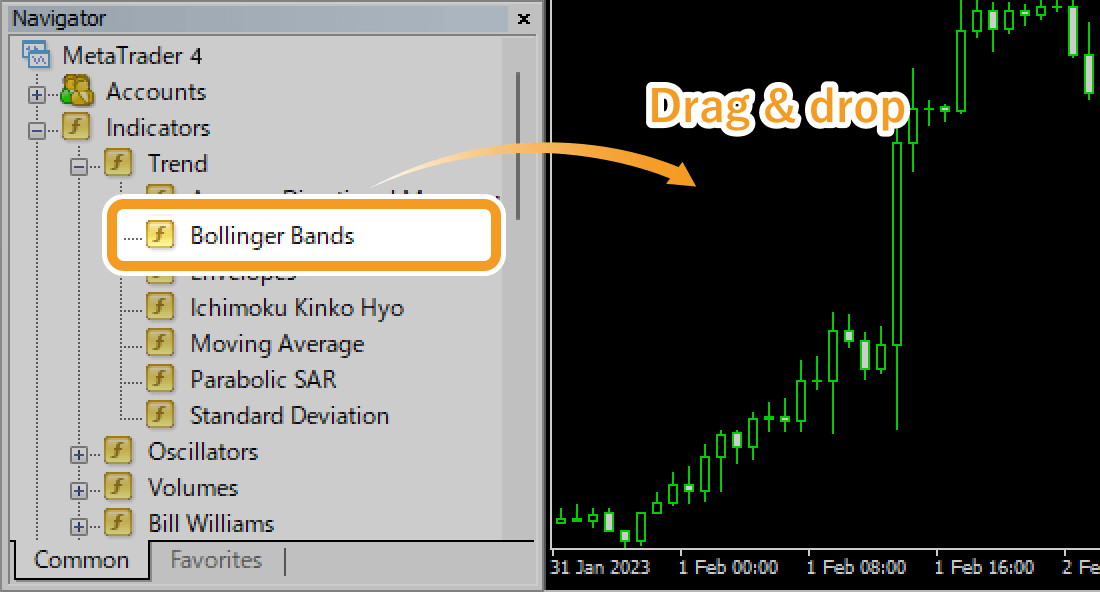
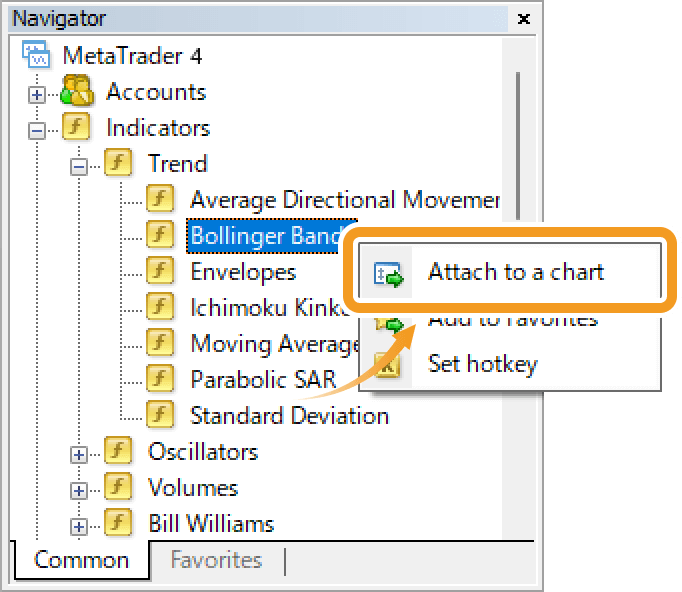
On the Navigator, click on the "+" signs next to "Indicators" and "Trend". Select "Bollinger Bands" and drag it onto the chart you wish to apply it to.
Or, right-click on "Bollinger Bands" and select "Attach to a chart".
Step 2
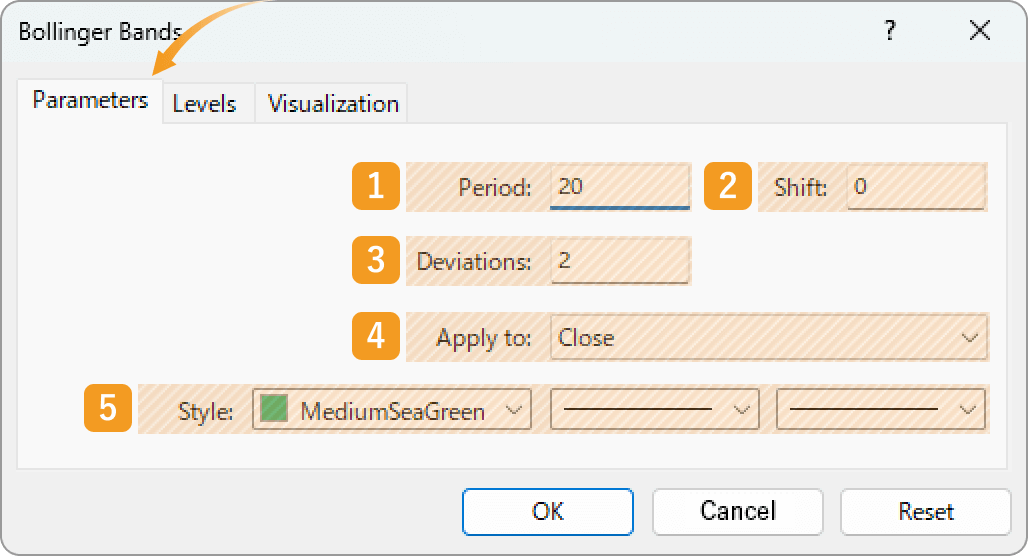
The setting window for Bollinger Bands will appear. Set the parameters in the "Parameters", "Levels", and "Visualization" tabs and click "OK".
"Parameters" tab
|
Number |
Item name |
Descriptions |
|---|---|---|
|
1 |
Period |
Set the period for the moving average. The unit here is the number of candlesticks. If you select the daily chart and set it to "20", the Bollinger Bands for the past 20 days will be generated. |
|
2 |
Shift |
You can shift the placement of the Bollinger Bands to the left or right. The unit is the number of candles. Type a positive value to move it to the right, and a negative value to move it to the left. |
|
3 |
Deviations |
Set the standard deviation. If you set it to "2", Bollinger Bands will be formed with ±2σ deviation. |
|
4 |
Apply to |
Price to use for calculating Bollinger Bands. Close: close price Open: open price High: high price Low: low price Median Price (HL/2): (high price + low price) ÷2 Typical Price (HLC/3): (high price + low price + close price) ÷3 Weighted Close (HLCC/4): (high price + low price + close price×2) ÷4 Previous Indicator's Data: the value of the indicator displayed last First Indicator's Data: the value of the indicator displayed first |
|
5 |
Style |
Set the color, line type, and line thickness for Bollinger bands. |
Among the options in the "Apply to" field, "Previous Indicator's Data" and "First Indicator's Data" use the values of an indicator displayed in a sub-window, rather than the price of the chart's symbol.
For example, if volume is shown as the first indicator in a sub-window and you select First Indicator's Data, the Bollinger Bands will be calculated based on the volume.
On MT4, these options remain visible even when not available, but if selected in such cases, they will automatically default to Close.
"Levels" tab
To add a band, go to the "Levels" tab and click "Add" to enter your preferred multiplier for the standard deviation of the main Bollinger Bands. For example, if "Deviations" is set at "2" and the level is also "2", a new band will be formed with "4σ".
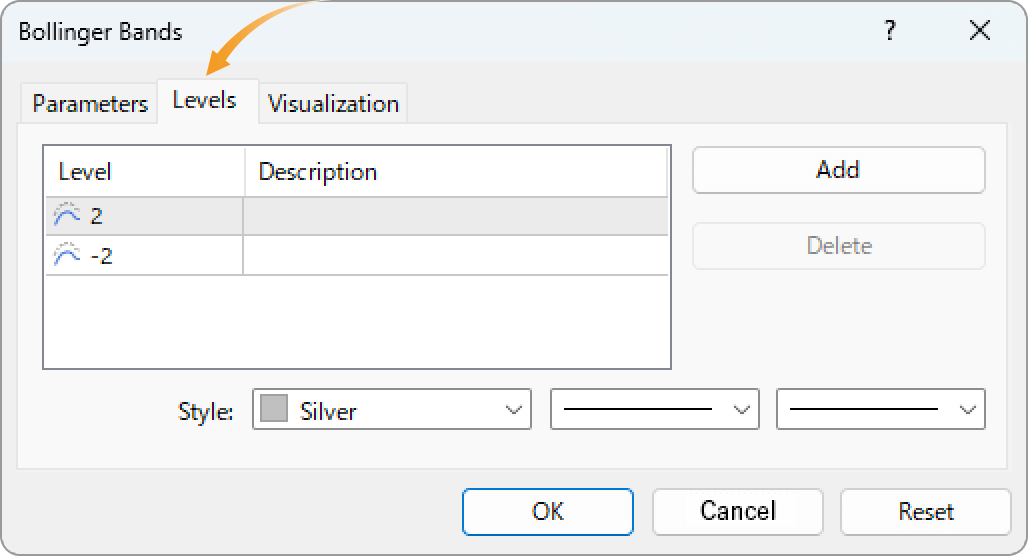
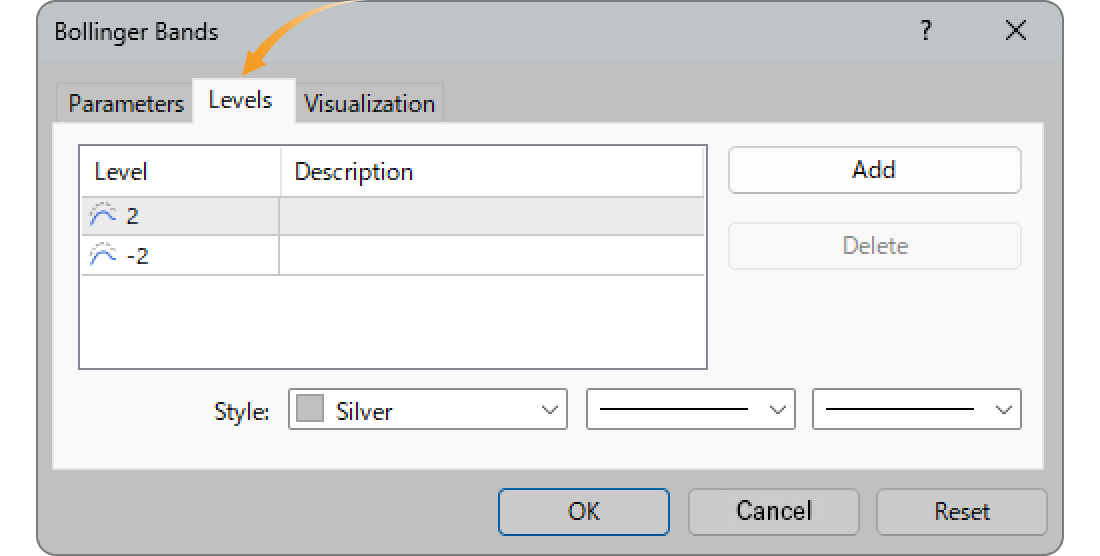
When the "Deviations" parameter in the "Parameter" tab is set to "1", and "2" and "-2" are added in the "Levels" tab, you will see two sets of bands, ±1σ and ±2σ. The "Levels" tab specifies the value that the standard deviation of the main Bollinger Bands is to be multiplied by. Therefore, setting the "Deviation" parameter at "1" can make it simple to tell what a standard deviation of an additional band will be, which is, the same as the value of the multiplier.
"Visualization" tab
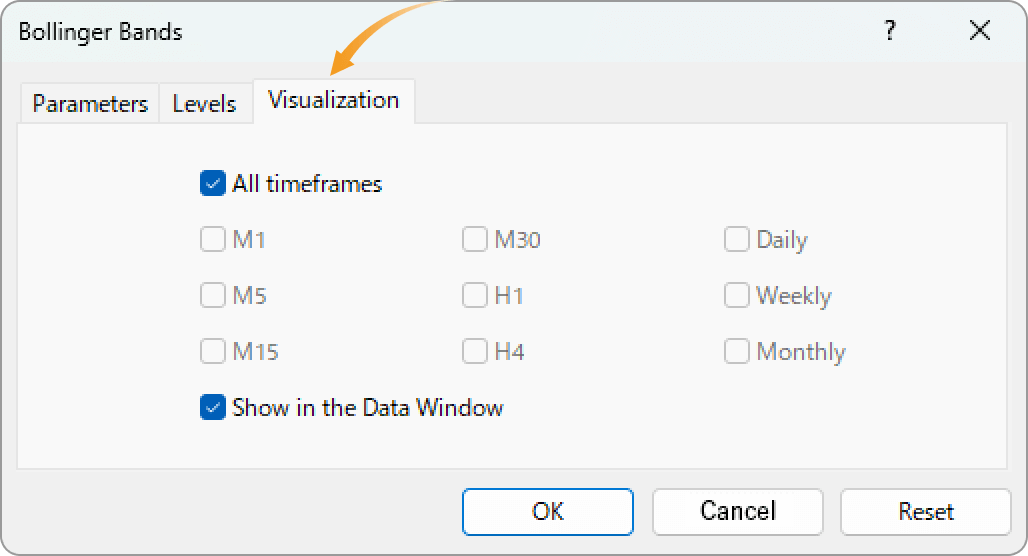
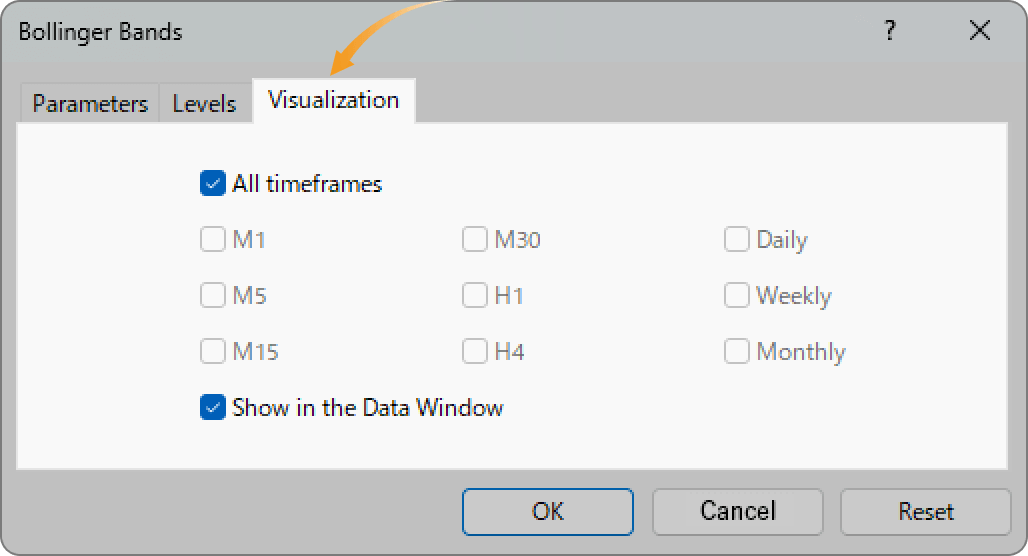
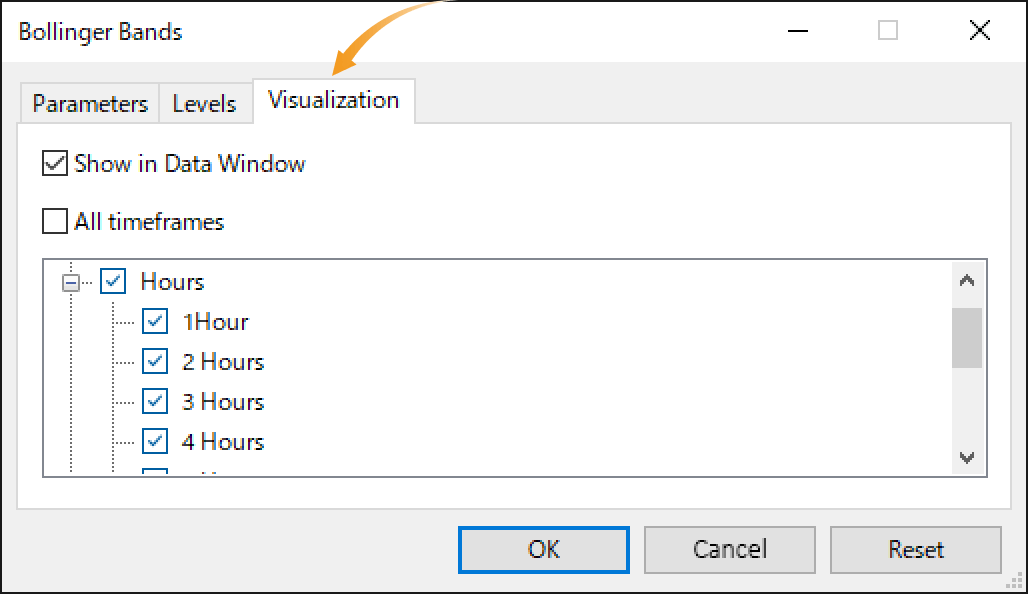
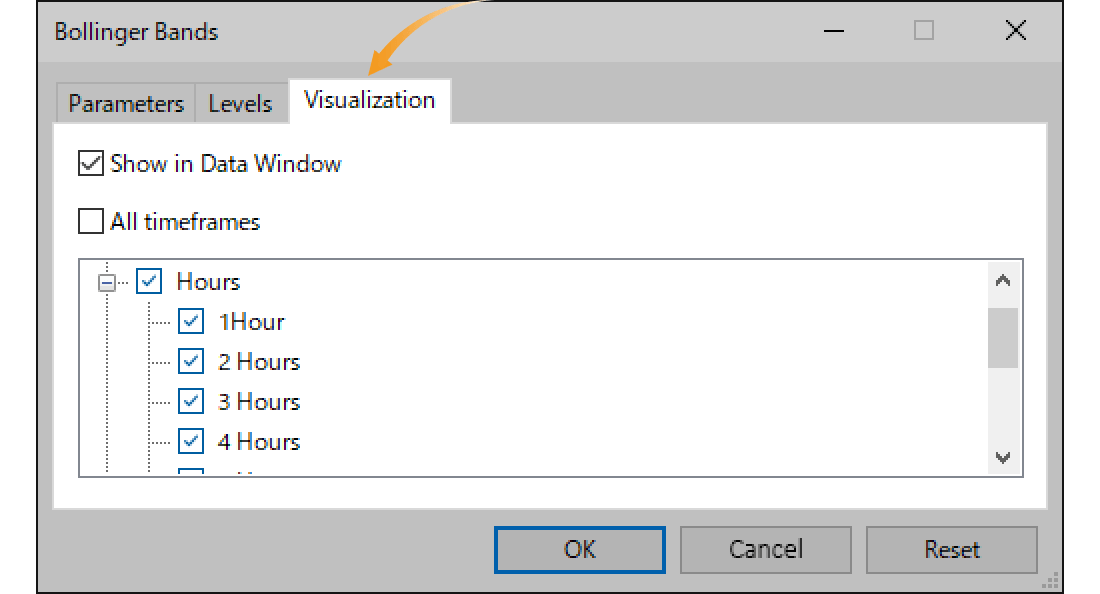
On the "Visualization" tab, you can show/hide Bollinger Bands in the Data Window and specify the timeframes to use Bollinger Bands with.
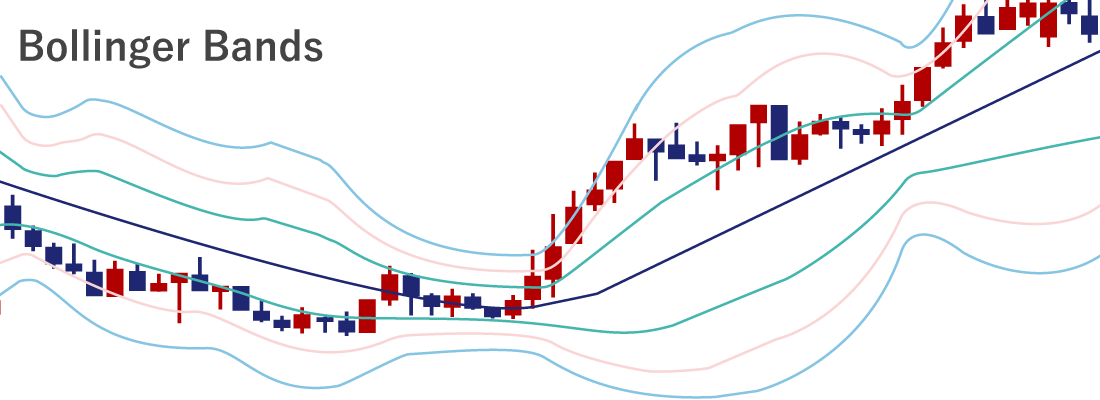
The Bollinger Bands come from the theory of standard deviation and normal distribution. Standard deviation shows how much the data (price in this case) is spread out relative to the average. The theory of normal distribution defines the probability of a data group falling within a certain range. See the figure on the right for more details.

Bollinger Bands are a technical indicator that applies statistics to charts. The lines represent ±1σ, ±2σ, and ±3σ, from the center outward. However, keep in mind that markets do not always follow the rules of normal distribution.

Step 3
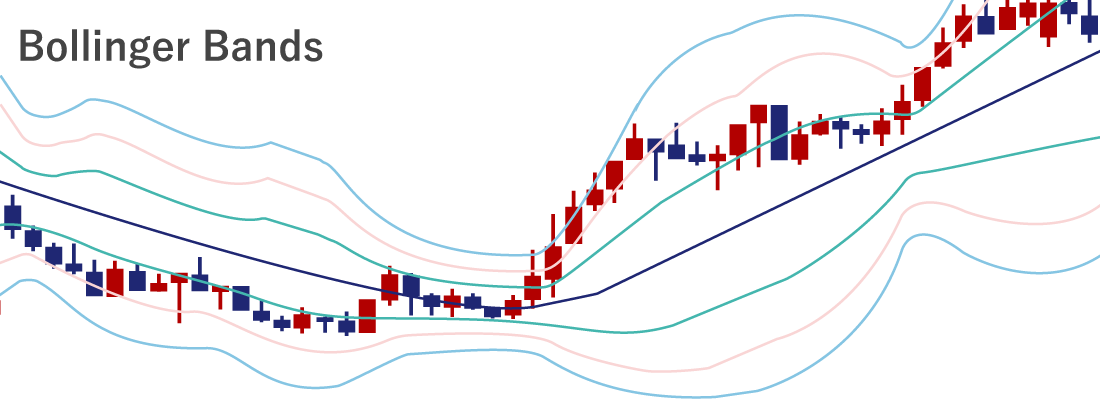
Bollinger Bands will be displayed on the chart. The upper line of the Bollinger Bands is called the upper band, the middle one is the middle line, and the lower one is the lower band.
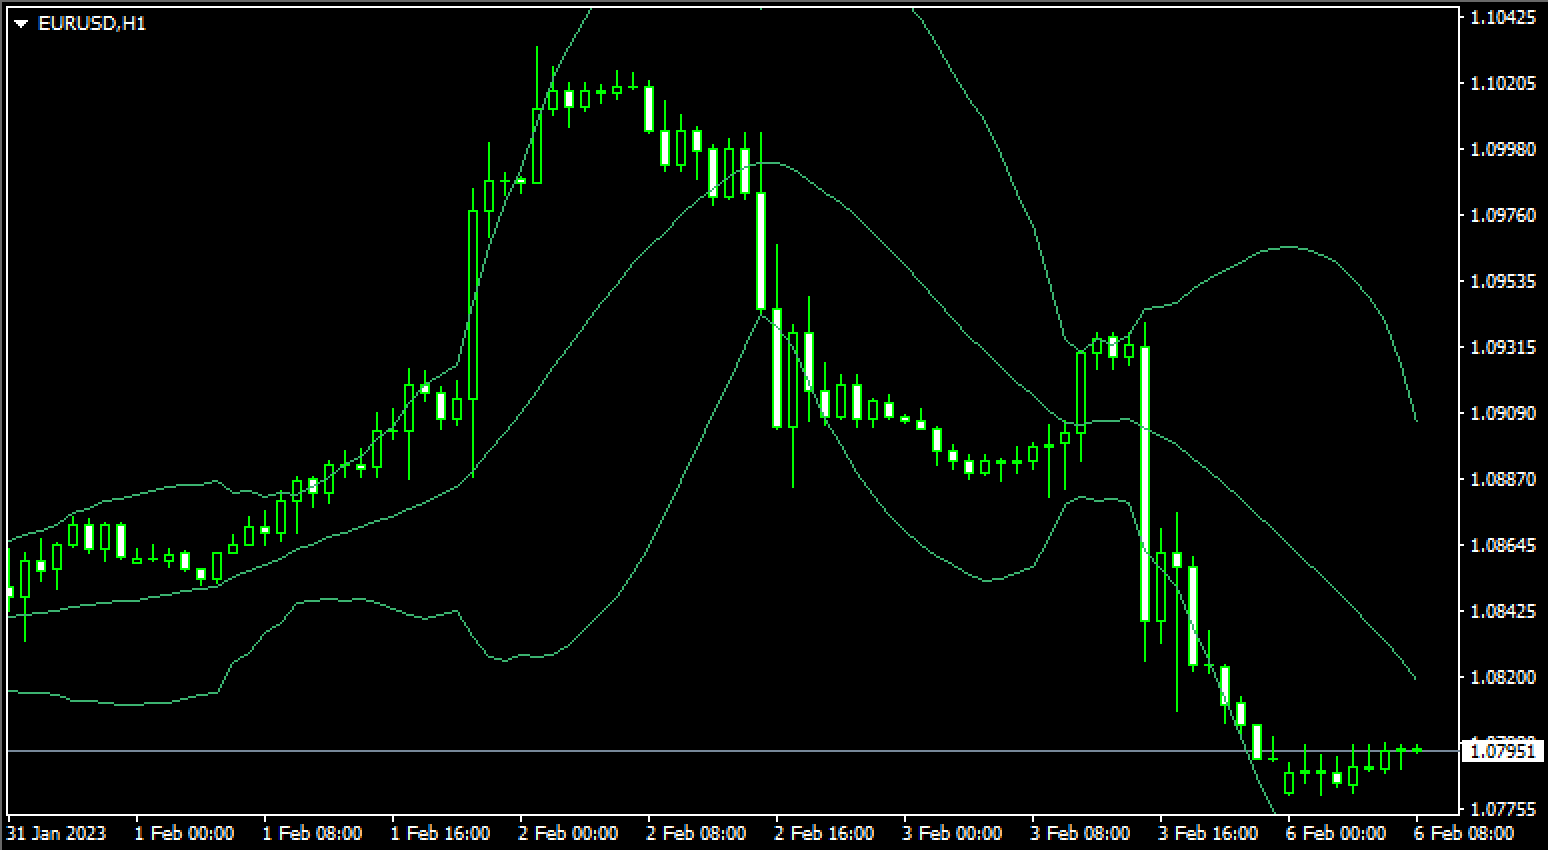
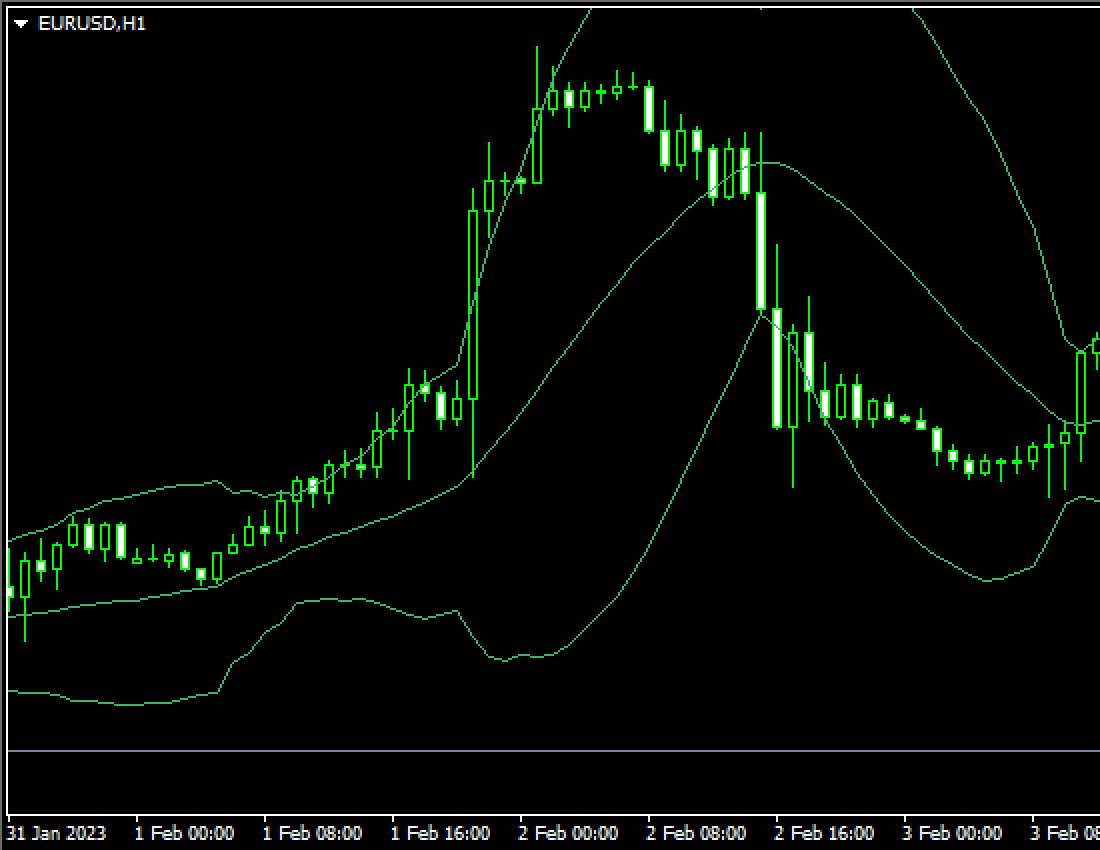
To display multiple Bollinger Bands on the chart, You can add a standard deviation from the "Levels" tab, or follow the same steps above to add another Bollinger Bands. Alternatively, go to the "Parameters" tab and adjust the moving average and standard deviation settings to display multiple Bollinger Bands on the same chart.
Step 1
The Bollinger Bands can be set up from the menu or Navigator.
The middle line of the Bollinger Bands is a simple moving average (SMA). Changing it to an exponential moving average (EMA) or other MAs, or hiding it is not allowed in MT4/MT5.
Add Bollinger Bands from the menu
Click "Insert" in the menu. Hover the pointer over "Indicators" > "Trend" and select "Bollinger Bands".
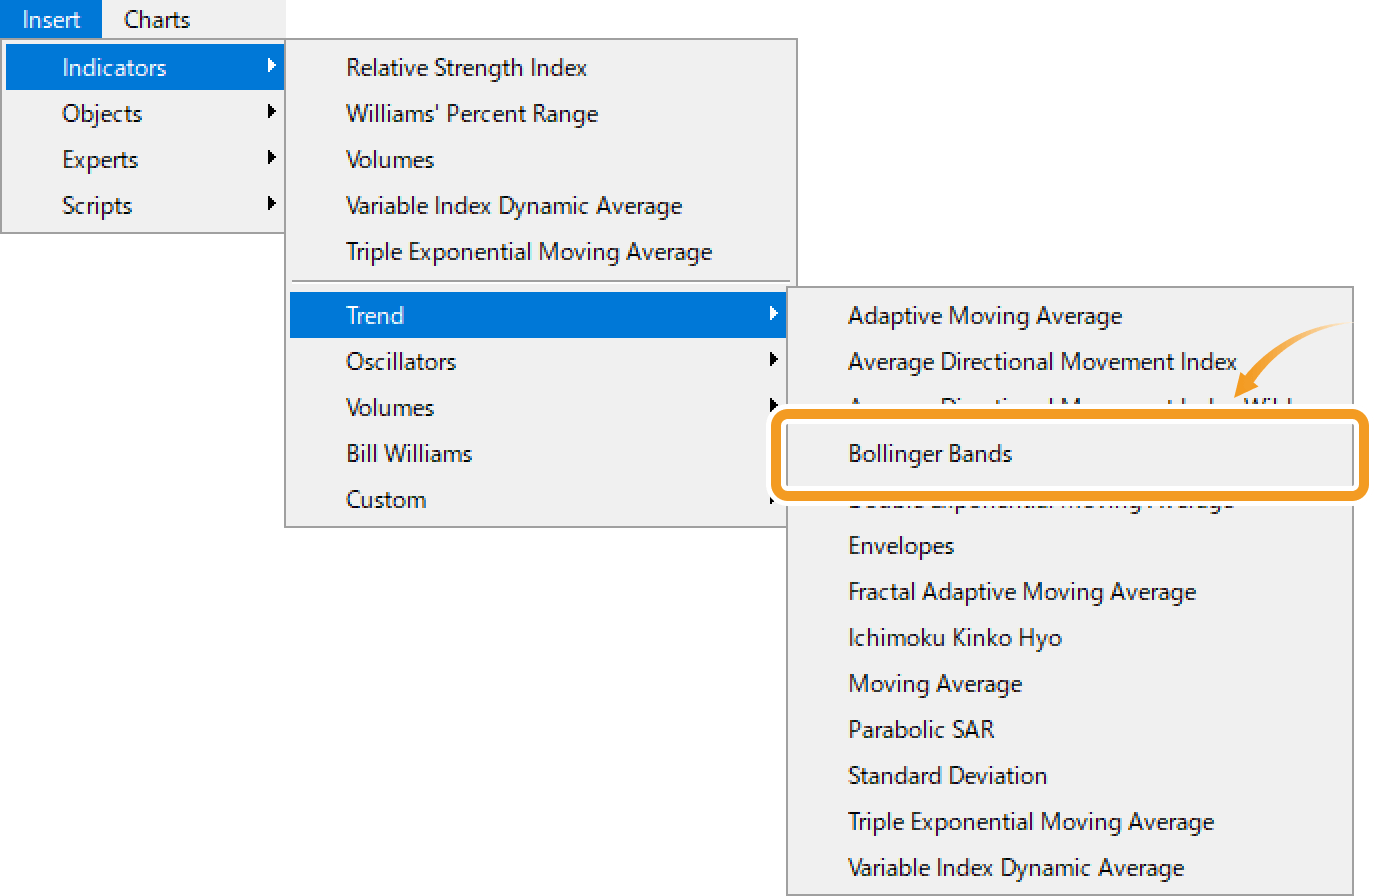
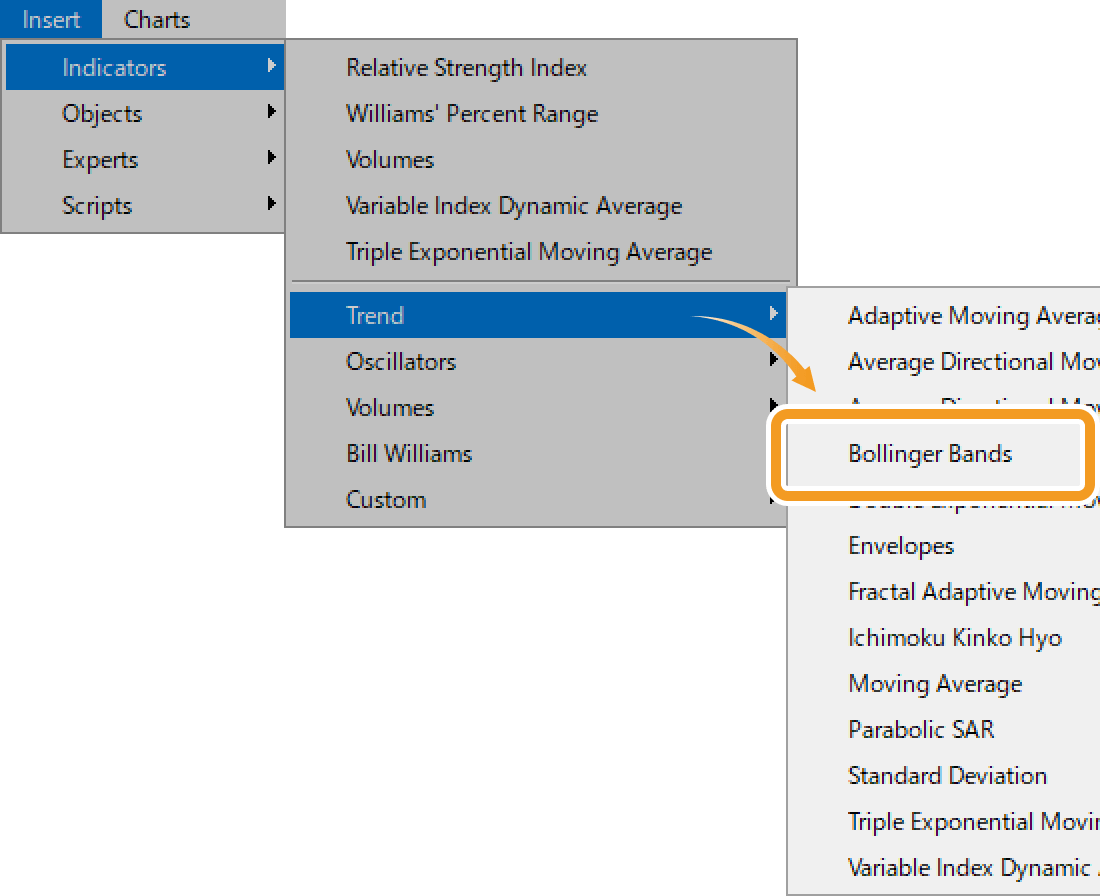
Add Bollinger Bands from the Navigator
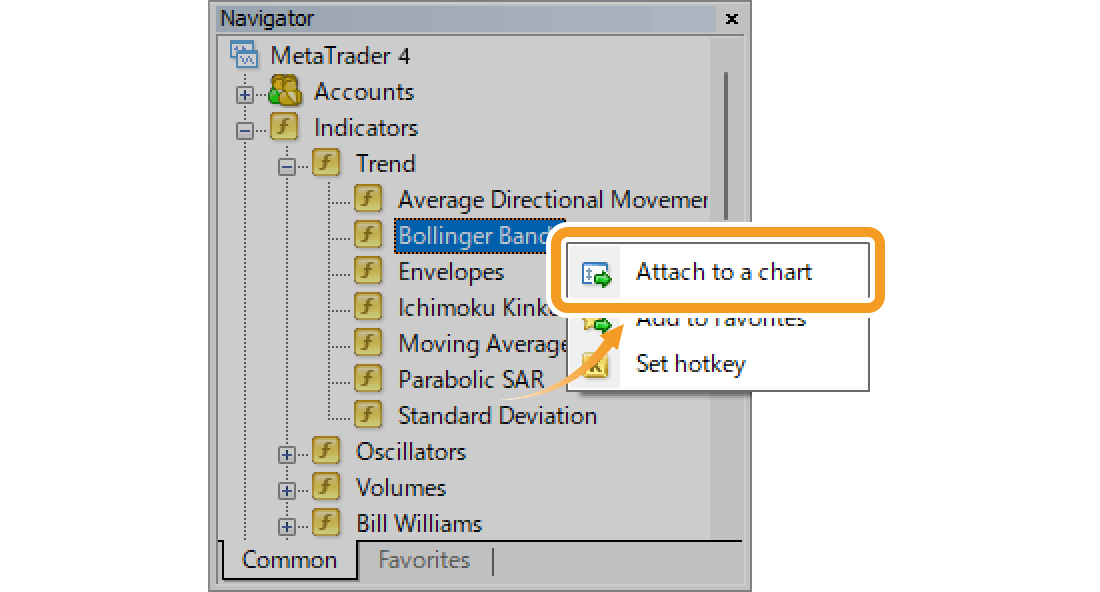
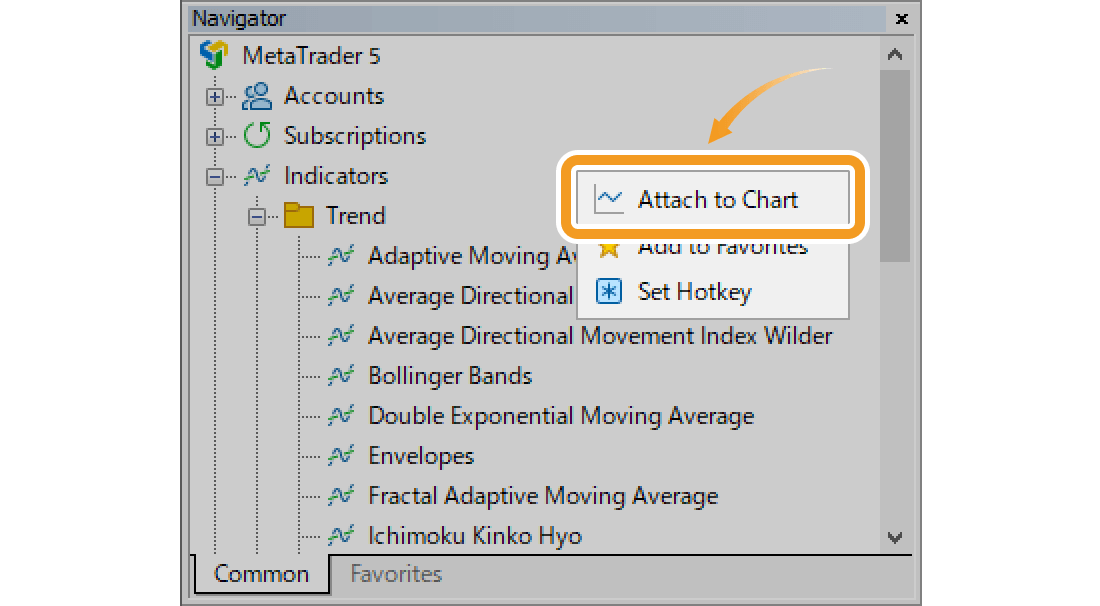
On the Navigator, go to "Indicators" and click on the "+" sign next to "Trend". Select "Bollinger Bands" and drag it onto the chart you wish to apply it to.
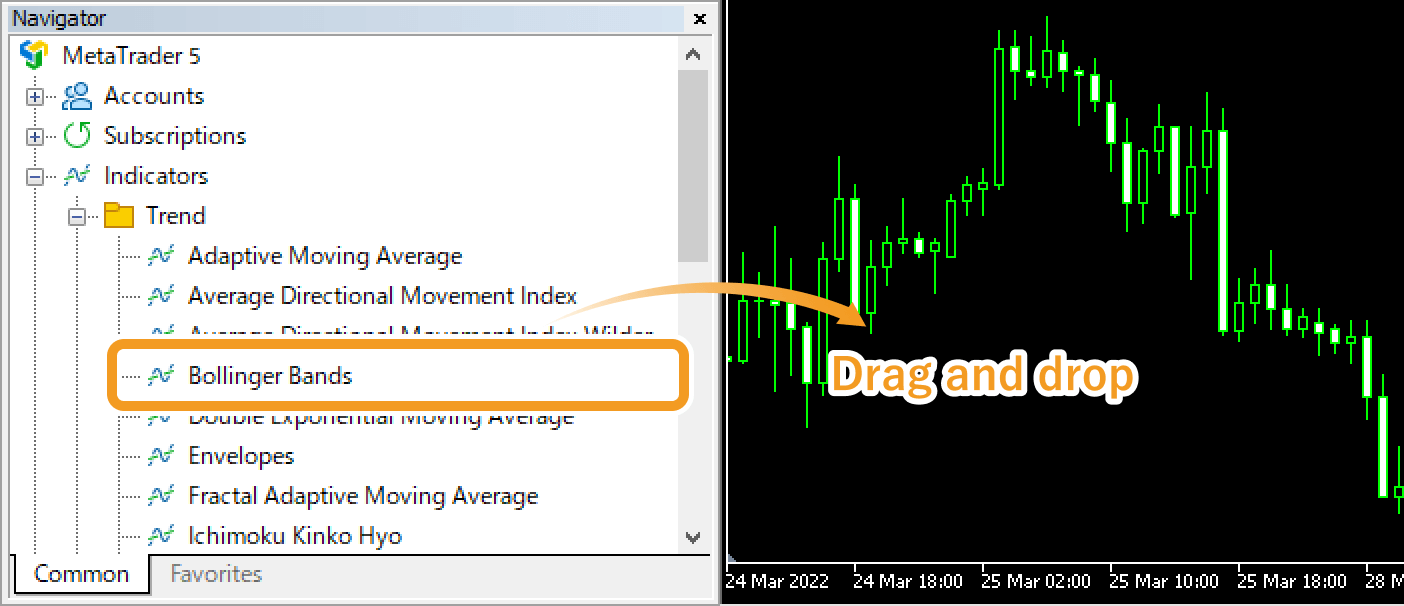
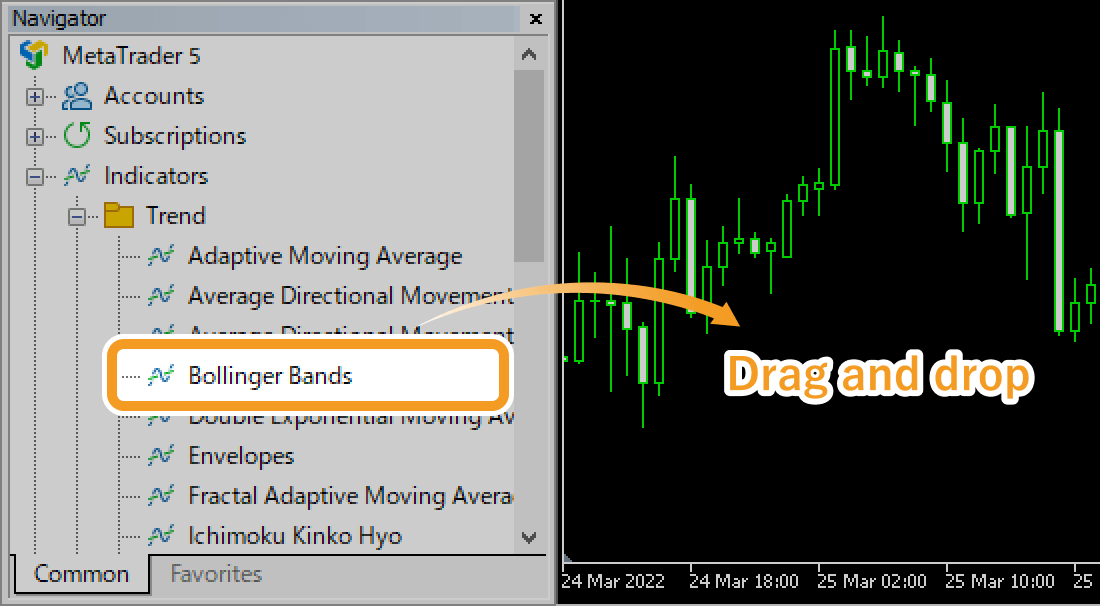
Or, right-click on "Bollinger Bands" and select "Attach to Chart".
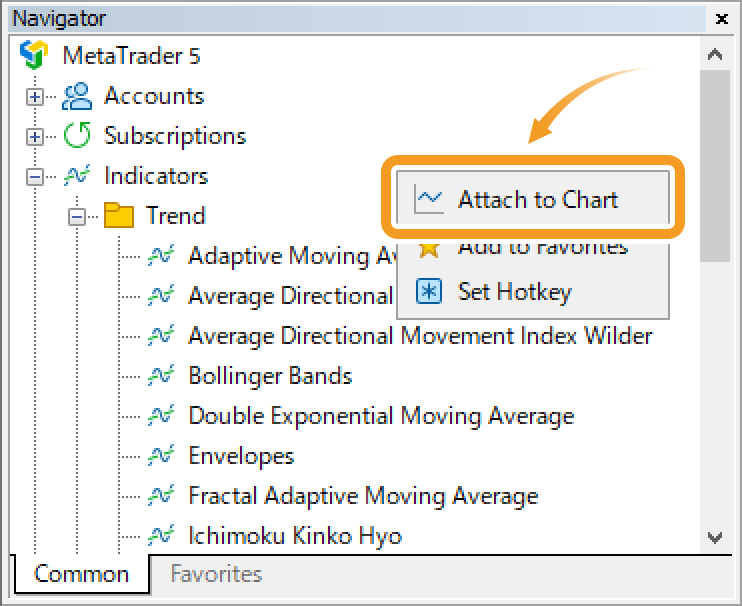
Step 2
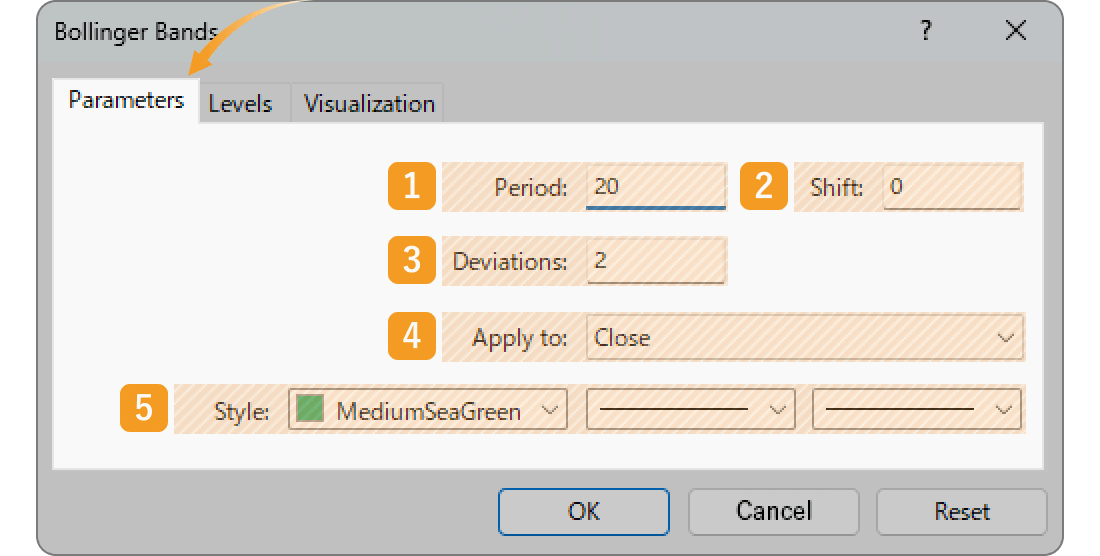
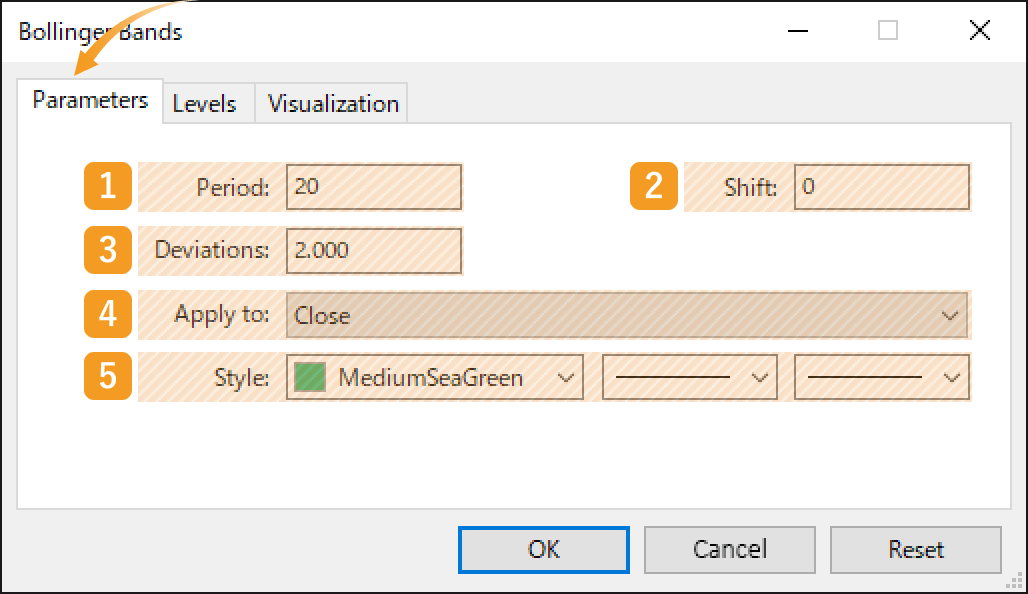
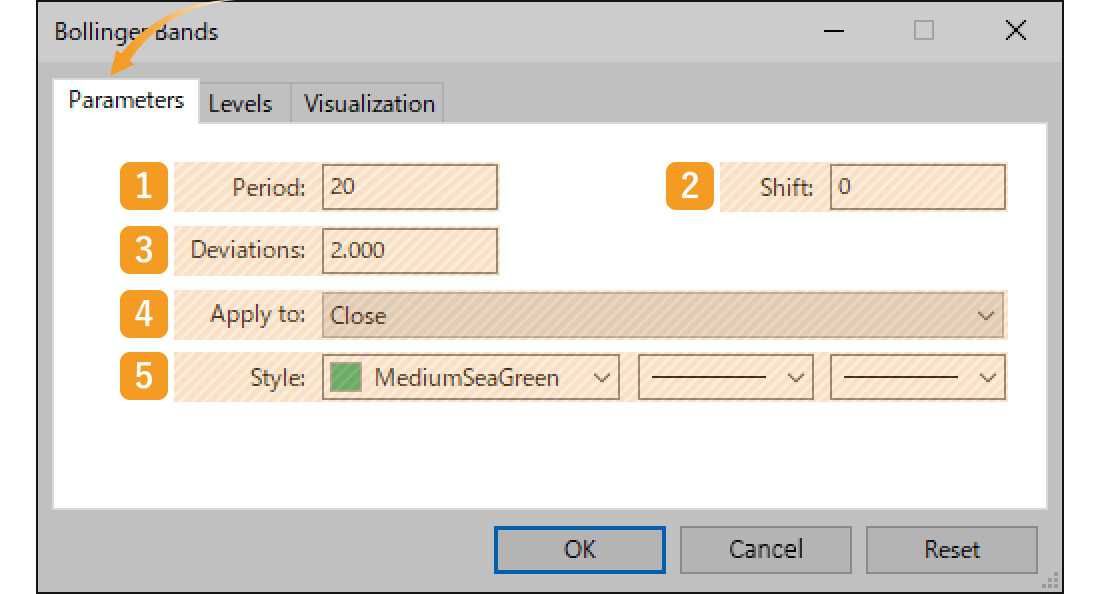
The setting window for Bollinger Bands will appear. Set the parameters in the "Parameters", "Levels", and "Visualization" tab and click "OK".
"Parameters" tab
|
Number |
Item name |
Descriptions |
|---|---|---|
|
1 |
Period |
Set the period for the moving average. The unit here is the number of candlesticks. If you select the daily chart and set it to "20", the Bollinger Bands for the past 20 days will be generated. |
|
2 |
Shift |
You can shift the placement of the Bollinger Bands to the left or right. The unit is the number of candles. Type a positive value to move it to the right, and a negative value to move it to the left. |
|
3 |
Deviations |
Set the standard deviation. If you set it to "2", Bollinger Bands will be formed with ±2σ deviation. |
|
4 |
Apply to |
Price to use for calculating Bollinger Bands. Close: close price Open: open price High: high price Low: low price Median Price (HL/2): (high price + low price) ÷2 Typical Price (HLC/3): (high price + low price + close price) ÷3 Weighted Close (HLCC/4): (high price + low price + close price×2) ÷4 Previous indicator's data: the price data applied to the previous indicator First indicator's data: the price data applied to the first indicator Previous Indicator's Data: the value of the indicator displayed last First Indicator's Data: the value of the indicator displayed first |
|
5 |
Style |
Set the color, line type, and line thickness for Bollinger bands. |
Among the options in the "Apply to" field, "Previous Indicator's Data" and "First Indicator's Data" use the values of an indicator displayed in a sub-window, rather than the price of the chart's symbol.
For example, if volume is shown as the first indicator in a sub-window and you select First Indicator's Data, the Bollinger Bands will be calculated based on the volume.
"Levels" tab
To add a band, go to the "Levels" tab and click "Add" to enter your preferred multiplier for the standard deviation of the main Bollinger Bands. For example, if "Deviations" is set at "2" and the level is also "2", a new band will be formed with "4σ".
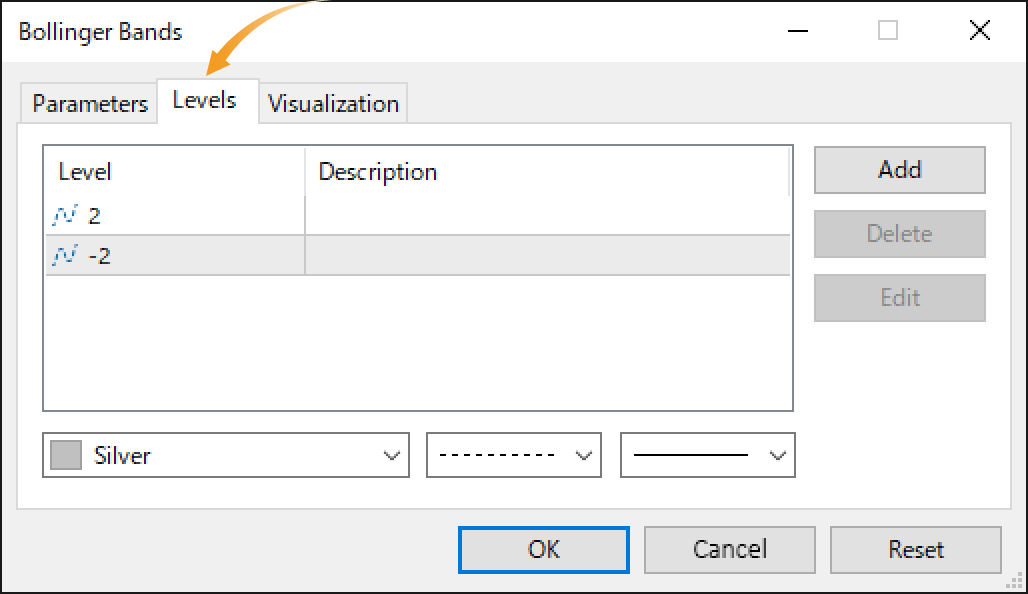
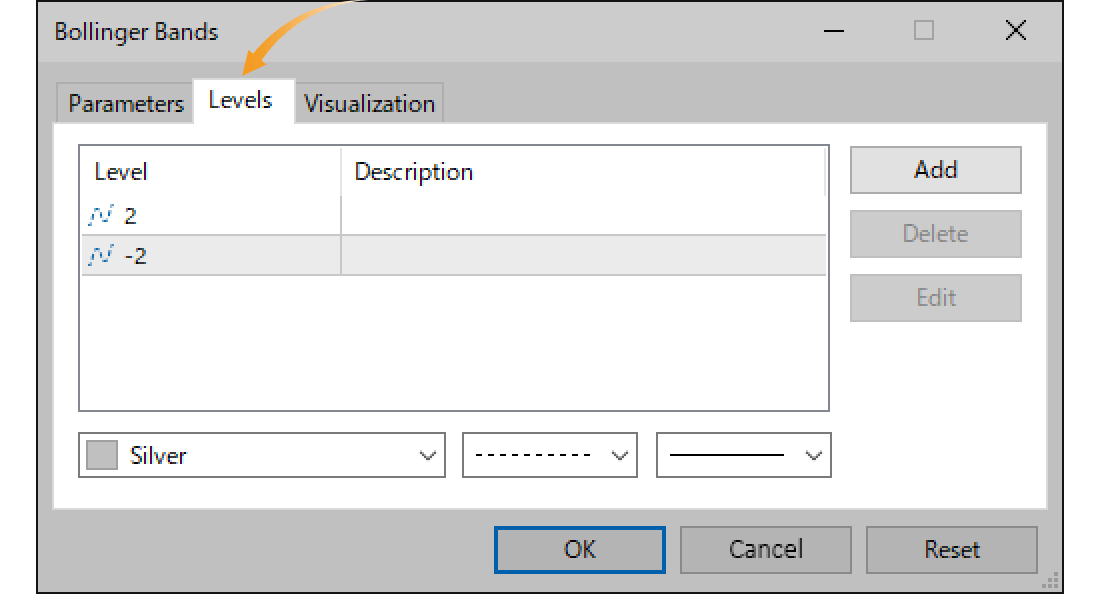
When the "Deviations" parameter in the "Parameter" tab is set to "1", and "2" and "-2" are added in the "Levels" tab, you will see two sets of bands, ±1σ and ±2σ. The "Levels" tab specifies the value that the standard deviation of the main Bollinger Bands is to be multiplied by. Therefore, setting the "Deviation" parameter at "1" can make it simple to tell what a standard deviation of an additional band will be, which is, the same as the value of the multiplier.
"Visualization" tab
On the "Visualization" tab, you can show/hide Bollinger Bands in the Data Window and specify the timeframes to use Bollinger Bands with.
The Bollinger Band comes from the theory of standard deviation and normal distribution. Standard deviation shows how much the data (price in this case) is spread out relative to the average. The theory of normal distribution defines the probability of a data group falling within a certain range. See the figure below for more details.

Bollinger Bands are a technical indicator that applies statistics to charts. The lines represent ±1σ, ±2σ, and ±3σ, from the center outward. However, keep in mind that markets do not always follow the rules of normal distribution.

Step 3
Bollinger Bands will be displayed on the chart.The upper line of the Bollinger Bands is called the upper band, the middle one is the middle line, and the lower one is the lower band.
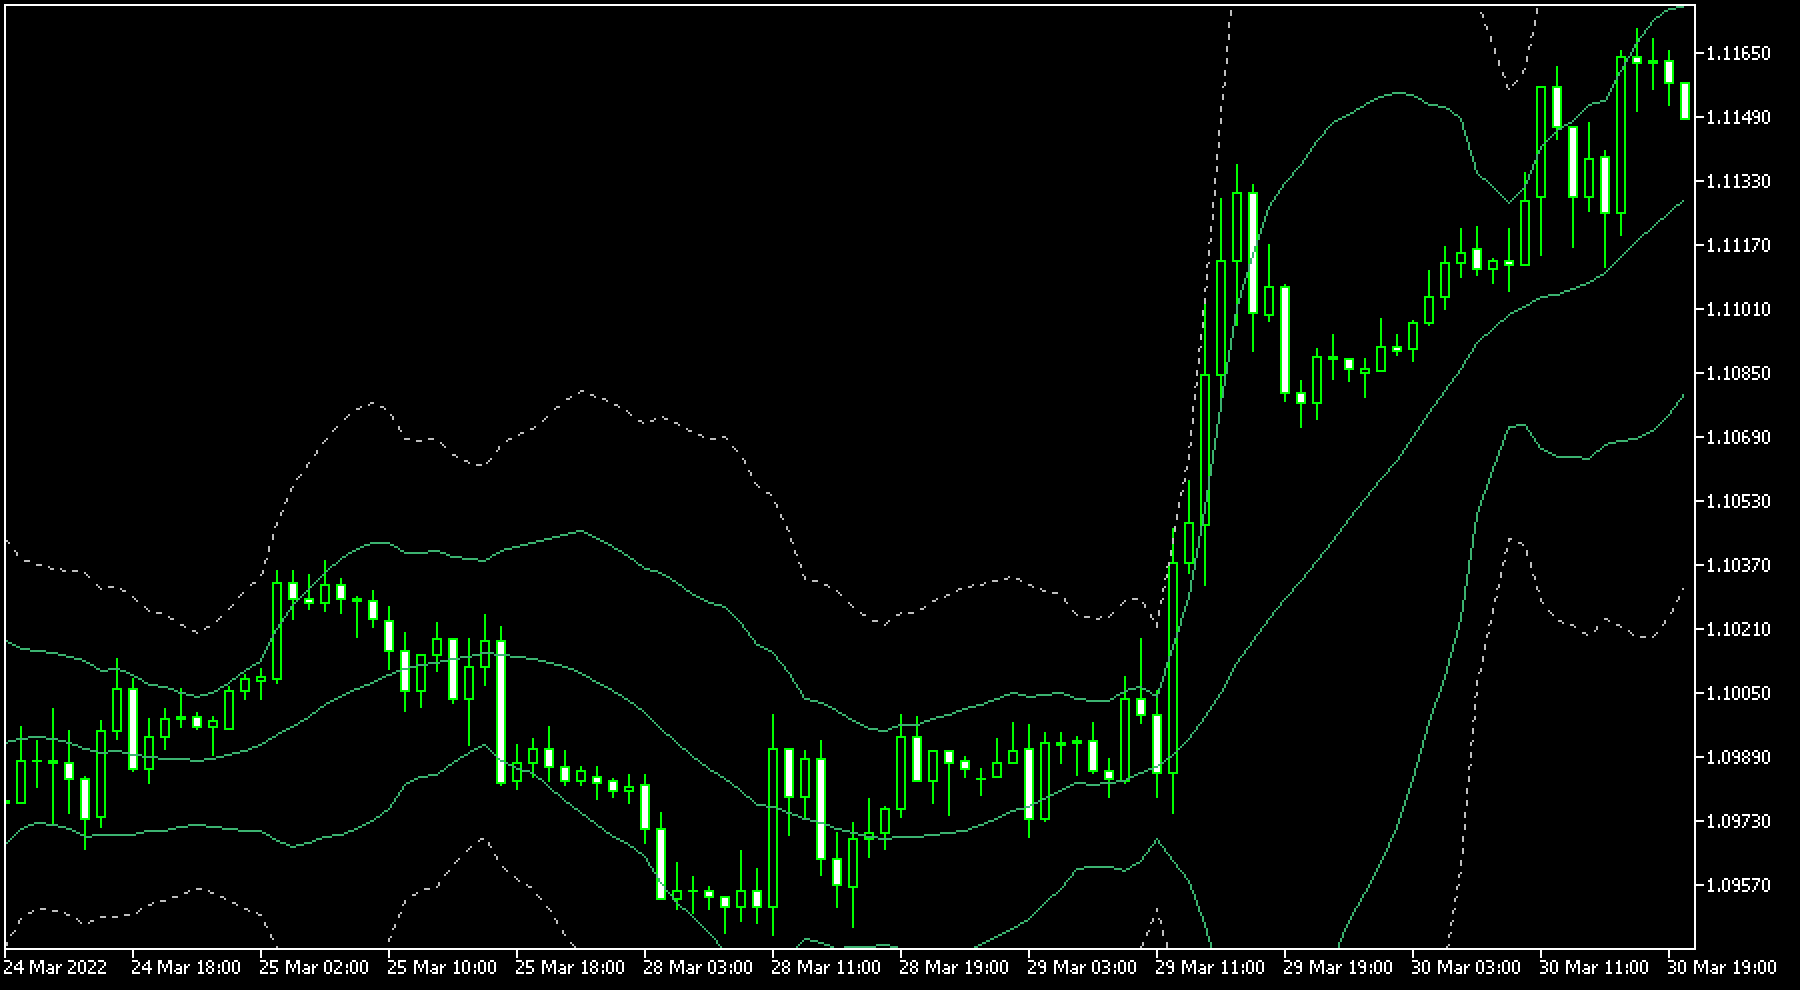
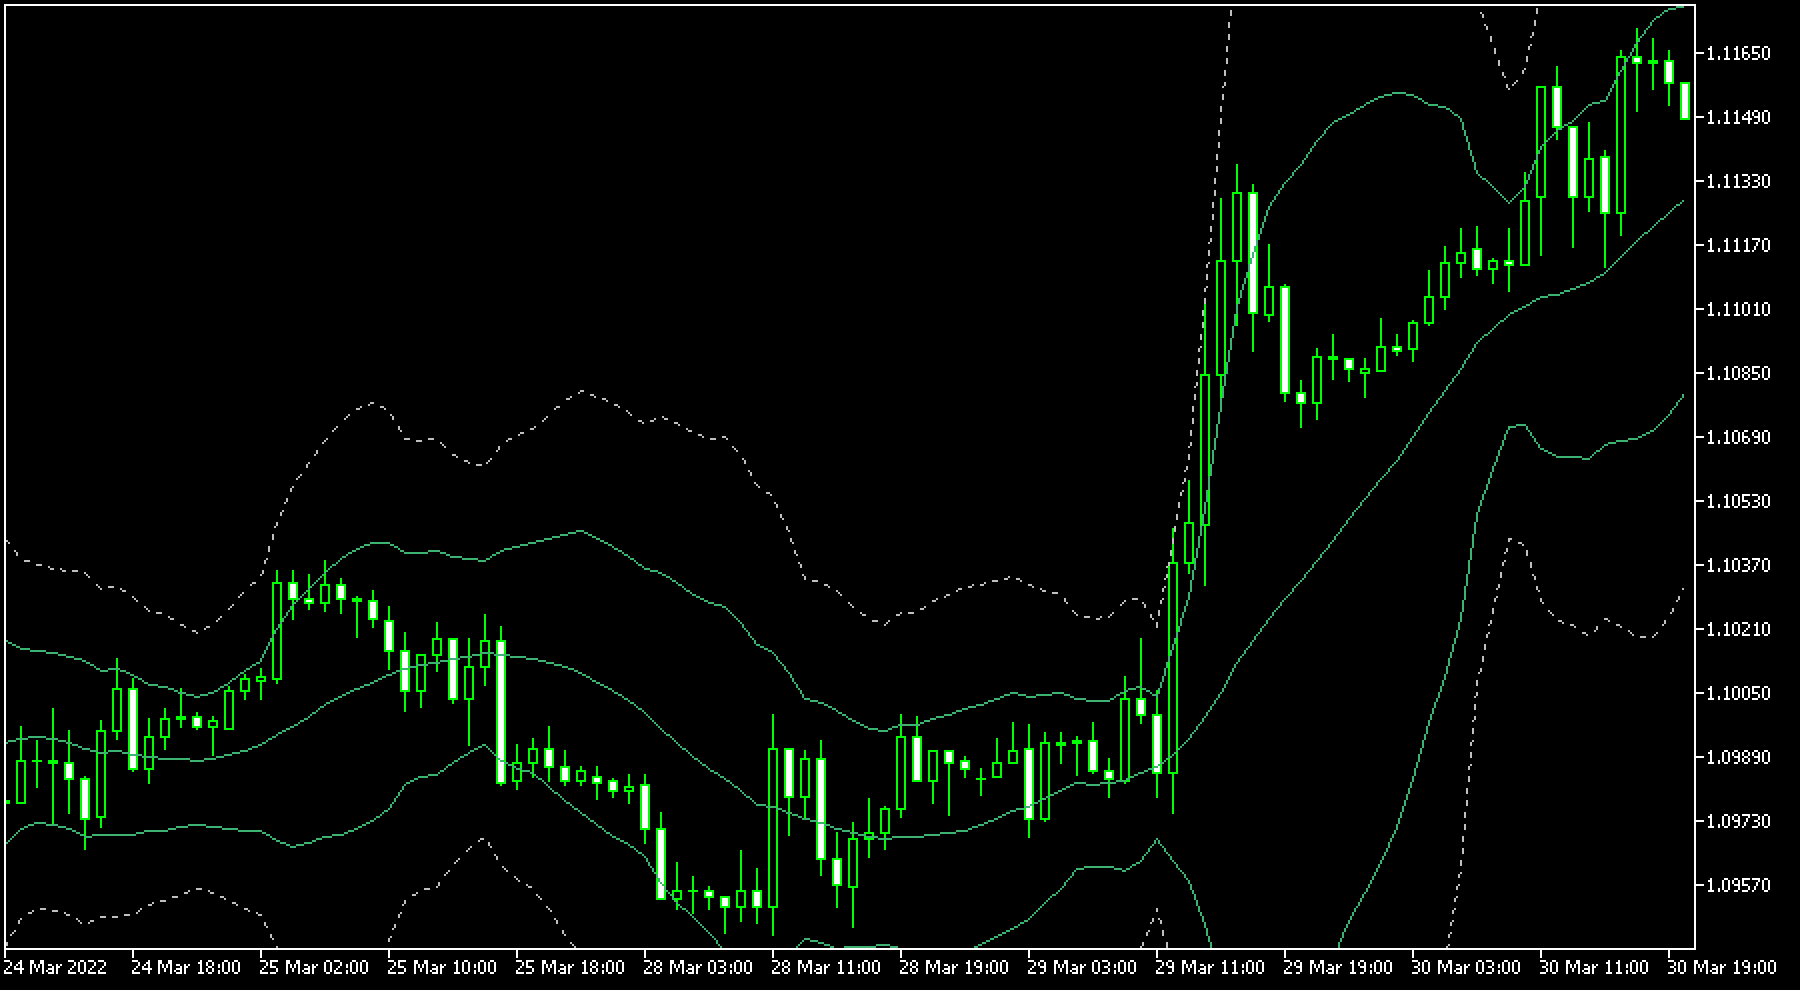
To display multiple Bollinger Bands on the chart, You can add a standard deviation from the "Levels" tab, or follow the same steps above to add another Bollinger Bands. Alternatively, go to the "Parameters" tab and adjust the moving average and standard deviation settings to display multiple Bollinger Bands on the same chart.
Was this article helpful?
0 out of 0 people found this article helpful.
Thank you for your feedback.
FXON uses cookies to enhance the functionality of the website and your experience on it. This website may also use cookies from third parties (advertisers, log analyzers, etc.) for the purpose of tracking your activities. Cookie Policy
