- Features
-
Services/ProductsServices/ProductsServices/Products

Learn more about the retail trading conditions, platforms, and products available for trading that FXON offers as a currency broker.
You can't start without it.
Trading Platforms Trading Platforms Trading Platforms
Features and functionality comparison of MetaTrader 4/5, and correspondence table of each function by OS
Two account types to choose
Trading Account Types Trading Account Types Trading Account Types
Introducing FXON's Standard and Elite accounts.
close close

-
SupportSupportSupport

Support information for customers, including how to open an account, how to use the trading tools, and a collection of QAs from the help desk.
Recommended for beginner!
Account Opening Account Opening Account Opening
Detailed explanation of everything from how to open a real account to the deposit process.
MetaTrader4/5 User Guide MetaTrader4/5 User Guide MetaTrader4/5 User Guide
The most detailed explanation of how to install and operate MetaTrader anywhere.
FAQ FAQ FAQ
Do you have a question? All the answers are here.
Coming Soon
Glossary Glossary GlossaryGlossary of terms related to trading and investing in general, including FX, virtual currencies and CFDs.
News News News
Company and License Company and License Company and License
Sitemap Sitemap Sitemap
Contact Us Contact Us Contact Us
General, personal information and privacy inquiries.
close close

- Promotion
- Trader's Market
- Partner
-
close close
Learn more about the retail trading conditions, platforms, and products available for trading that FXON offers as a currency broker.
You can't start without it.
Features and functionality comparison of MetaTrader 4/5, and correspondence table of each function by OS
Two account types to choose
Introducing FXON's Standard and Elite accounts.
Support information for customers, including how to open an account, how to use the trading tools, and a collection of QAs from the help desk.
Recommended for beginner!
Detailed explanation of everything from how to open a real account to the deposit process.
The most detailed explanation of how to install and operate MetaTrader anywhere.
Do you have a question? All the answers are here.
Coming Soon
Glossary of terms related to trading and investing in general, including FX, virtual currencies and CFDs.
General, personal information and privacy inquiries.
Useful information for trading and market information is posted here. You can also view trader-to-trader trading performance portfolios.
Find a trading buddy!
Share trading results among traders. Share operational results and trading methods.
- Legal Documents TOP
- Client Agreement
- Risk Disclosure and Warning Notice
- Order and Execution Policy
- Complaints Procedure Policy
- AML/CFT and KYC Policy
- Privacy Policy
- eKYC Usage Policy
- Cookies Policy
- Website Access and Usage Policy
- Introducer Agreement
- Business Partner Agreement
- VPS Service Terms and Condition


This article was :
published
updated
On MetaTrader4 (MT4) / MetaTrader5 (MT5), you can enter symbol, timeframe, date, and time in the fast navigation bar to quickly customize your chart.
Here we will look at how to use the fast navigation bar on MT4/MT5.
Switch between MT4/MT5 tabs to check the steps for each.
Step 1
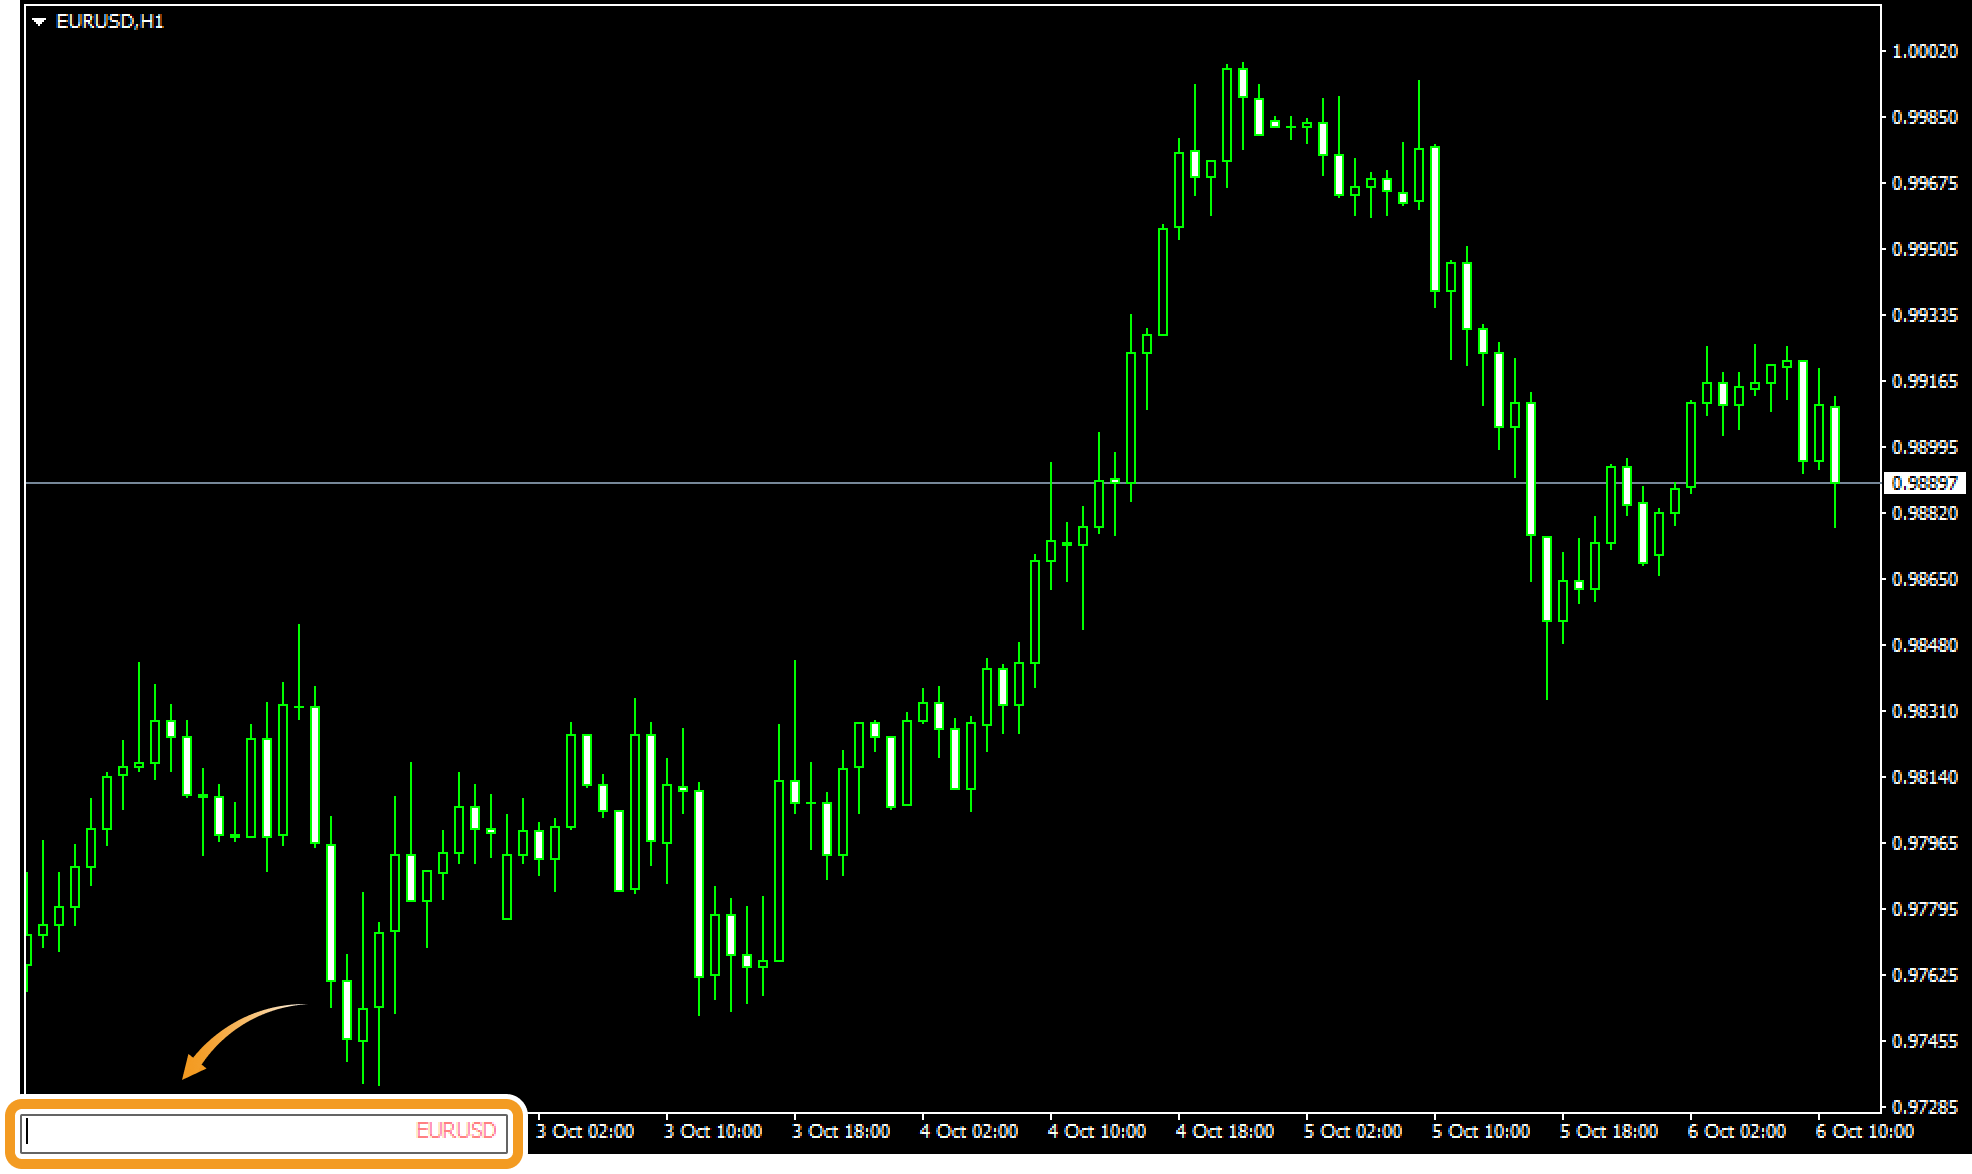
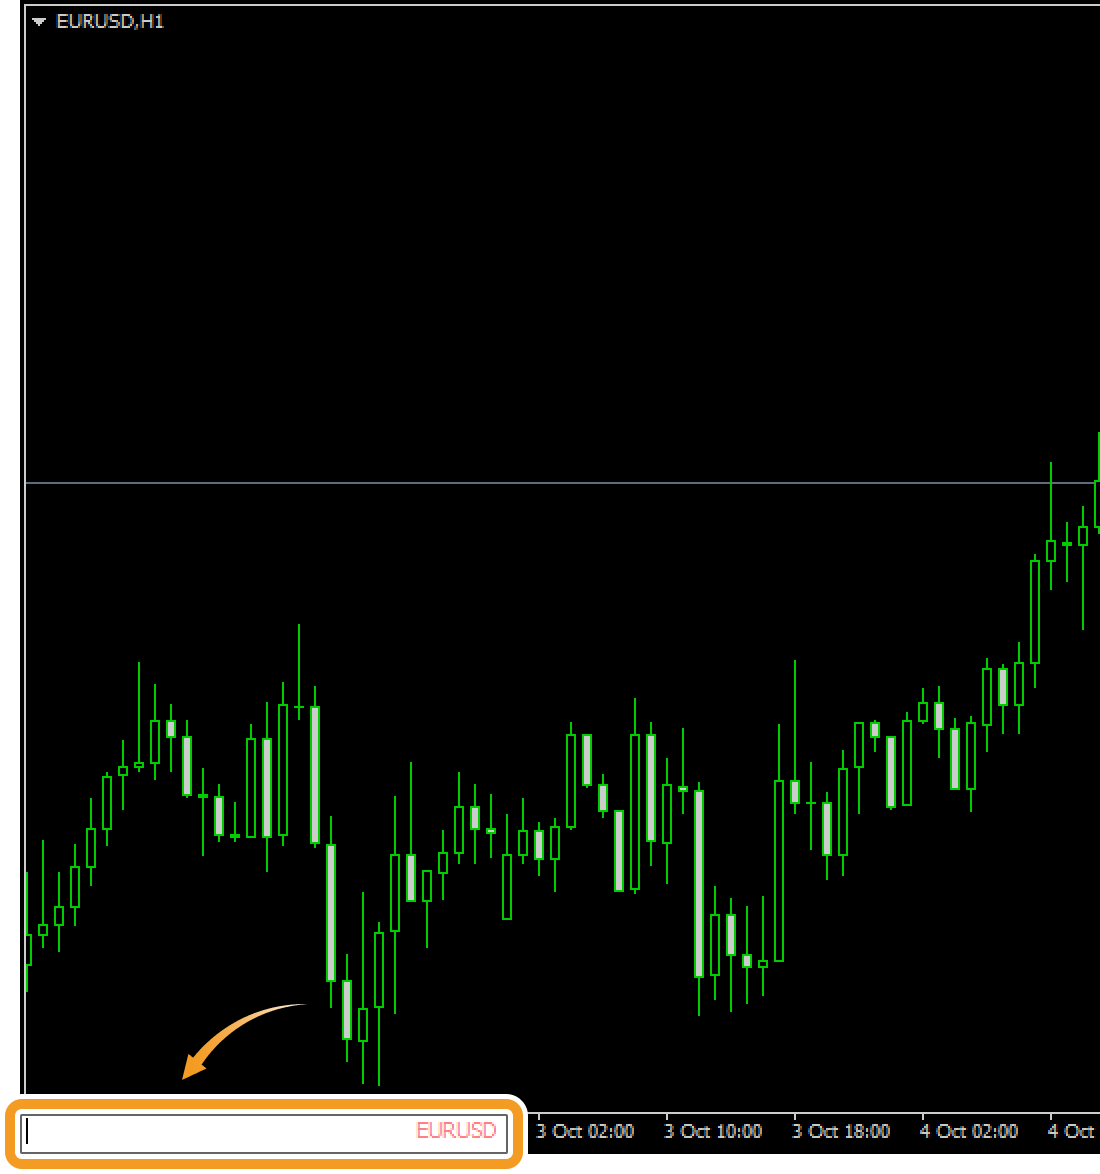
Click the chart for which you use the fast navigation bar and press "Enter" on your keyboard to show the fast navigation bar in the bottom left corner of the chart. You can also show it by double-clicking the bottom left corner of the chart.


Step 2
Type a symbol, timeframe, date and time in the following format to switch between charts.
| Item | Descriptions |
|---|---|
| Symbol | Enter the symbol name, e.g., to display a USDJPY chart, type "USDJPY". You need to add a symbol to the Market Watch, if it's not there.(*1)
Related article:Manage symbols in Market Watch |
| Timeframe | Enter "m1" for 1-minute timeframe, "h1" for 1-hour timeframe, "w" for 1-week timeframe, and "mn" for monthly timeframe. E.g., to display a 30-minute chart, type "m30". |
| Date | Enter the date based on the MT4 server time. E.g., to display a chart for February 1st, 2021, type "2021.2.1" or "2021.02.01". (*2) |
| Time | Enter the time based on the MT4 server time. E.g., to display a chart for 7:05 AM, type "7:5" or "07:05". (*2) |
(*1)Some brokers include a suffix in the symbol name. Ensure you provide the full symbol name, including the suffix. For example, "USDJPYs".
(*2)The chart might not update if the historical data for the specified date has not been downloaded.
Even if you specify the date in the fast navigation bar to show the chart of a particular period, the chart will be updated to the current time unless "Scroll the chart to the end on tick incoming" is turned off. You can click the "Scroll the chart to the end on tick incoming" icon on the menu to turn it on and off.


On the fast navigation bar, you can specify date and time to display a chart. Moreover, in MT5, you can specify symbol and timeframe as well. For instance, if you want to display the minute chart for EURJPY, enter "EURJPY m1" with a space between the symbol and the timeframe.
Step 1
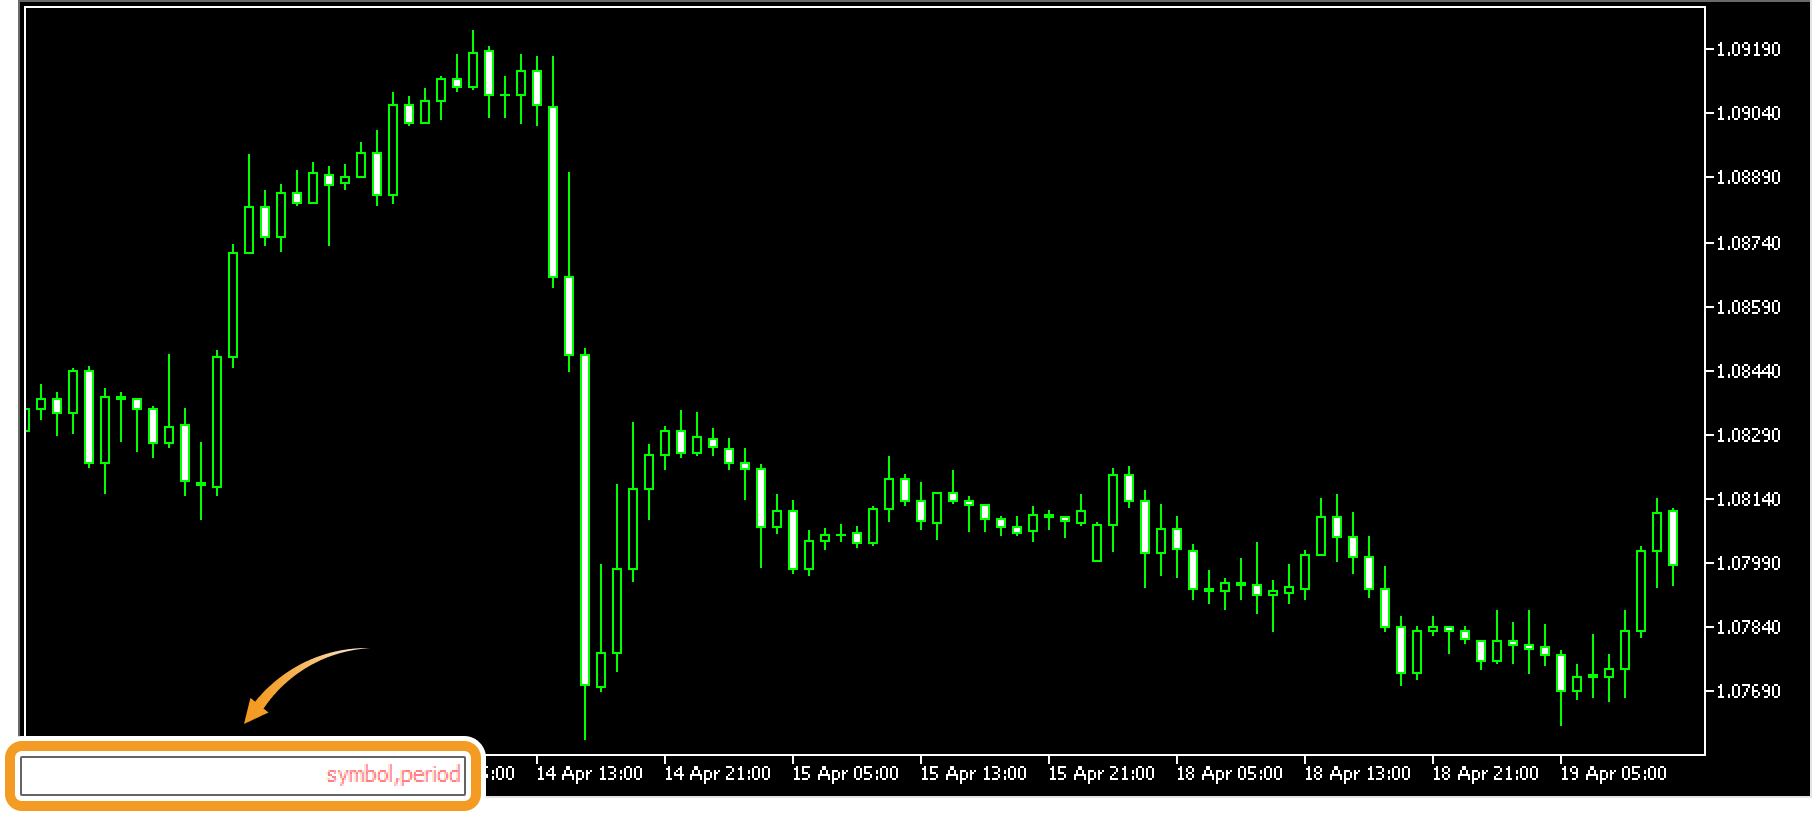
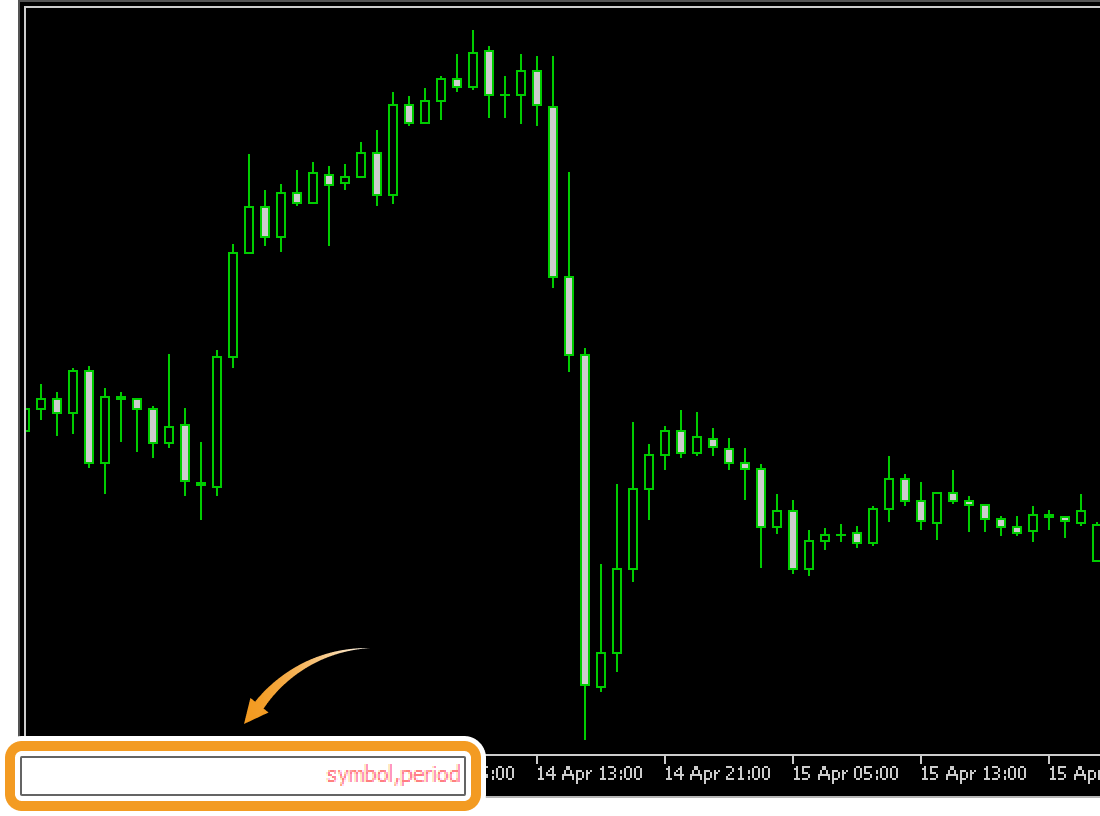
Click the chart for which you use the fast navigation bar and press "Enter" on your keyboard to show the fast navigation bar in the bottom left corner of the chart. You can also show it by double-clicking the bottom left corner of the chart.


Step 2
Type a symbol, timeframe, date and time in the following format to switch between charts.
| Item | Descriptions |
|---|---|
| Symbol | Enter the symbol name, e.g., to display a USDJPY chart, type "USDJPY". You need to add a symbol to the Market Watch, if it's not there. (*1)
Related article:Manage symbols in Market Watch |
| Timeframe | Enter "m1" for 1-minute timeframe, "h1" for 1-hour timeframe, "w1" for 1-week timeframe, and "mn" for monthly timeframe. E.g., to display a 30-minute chart, type "m30". |
| Date | Enter the date based on the MT5 server time. E.g., to display a chart for February 1st, 2021, type "2021.2.1" or "2021.02.01". (*2) |
| Time | Enter the time based on the MT5 server time. E.g., to display a chart for 7:05 AM of the current day, type "7:5" or "07:05". (*2) |
(*1)Some brokers include a suffix in the symbol name. Ensure you provide the full symbol name, including the suffix. For example, "USDJPYs".
(*2)The chart might not update if the historical data for the specified date has not been downloaded.
Even if you specify the date in the fast navigation bar to show the chart of a particular period, the chart will be updated to the current time unless "Scroll the chart to the end on tick incoming" is turned off. You can click the "Scroll the chart to the end on tick incoming" icon on the menu to turn it on and off.


On the fast navigation bar, you can combine various parameters such as date and time, or symbol and timeframe. When specifying several parameters, enter a half-width space between them. For instance, if you want to display the minute chart for USDJPY, enter "USDJPY m1".
Was this article helpful?
0 out of 0 people found this article helpful.
Thank you for your feedback.
FXON uses cookies to enhance the functionality of the website and your experience on it. This website may also use cookies from third parties (advertisers, log analyzers, etc.) for the purpose of tracking your activities. Cookie Policy
