MT4/MT5: Draw regression channel
EA, indicators & objects (Mobile & tablet)
EA, indicators & objects (Mobile & tablet)

This article was :
published
updated
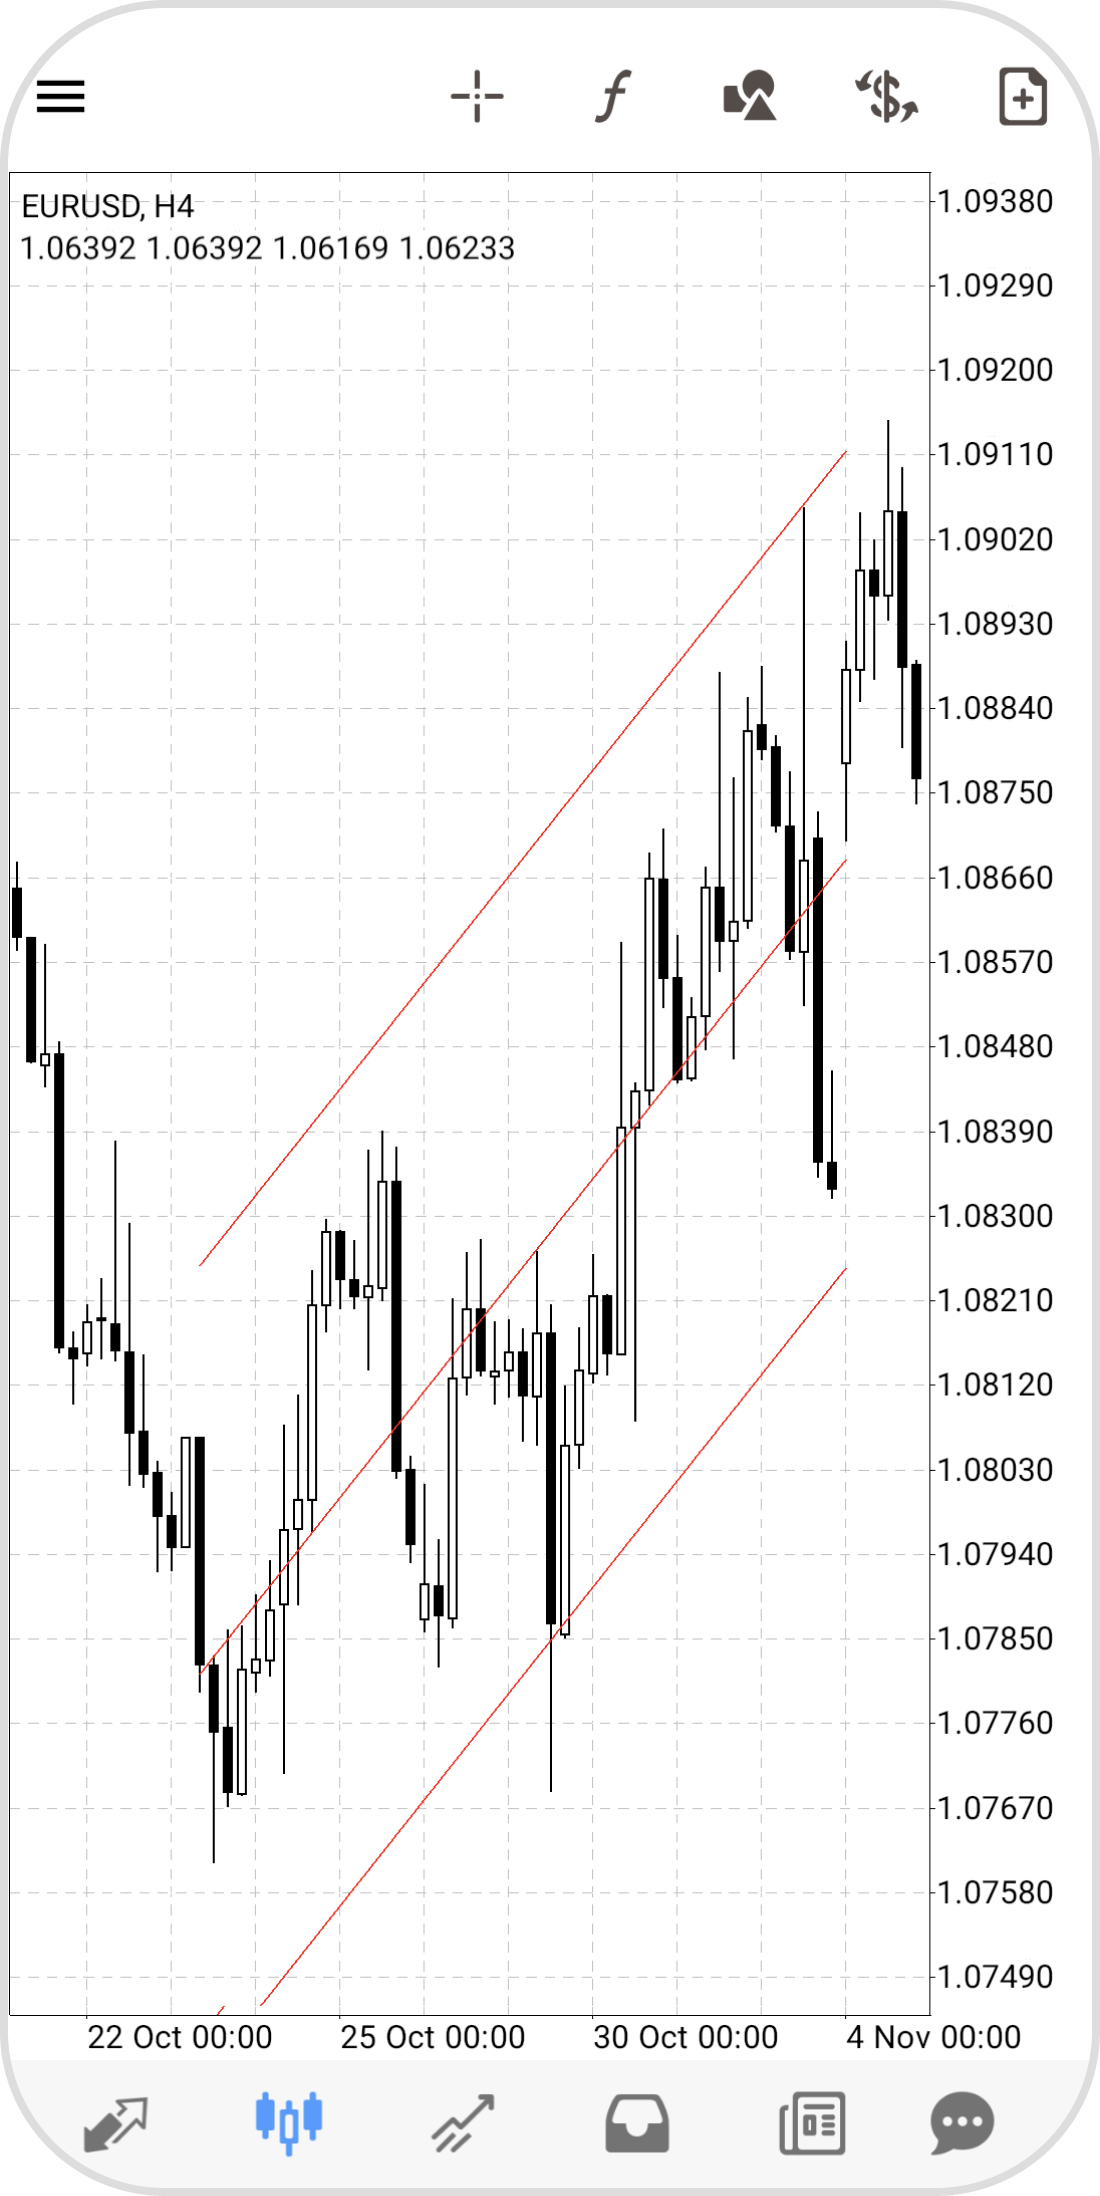
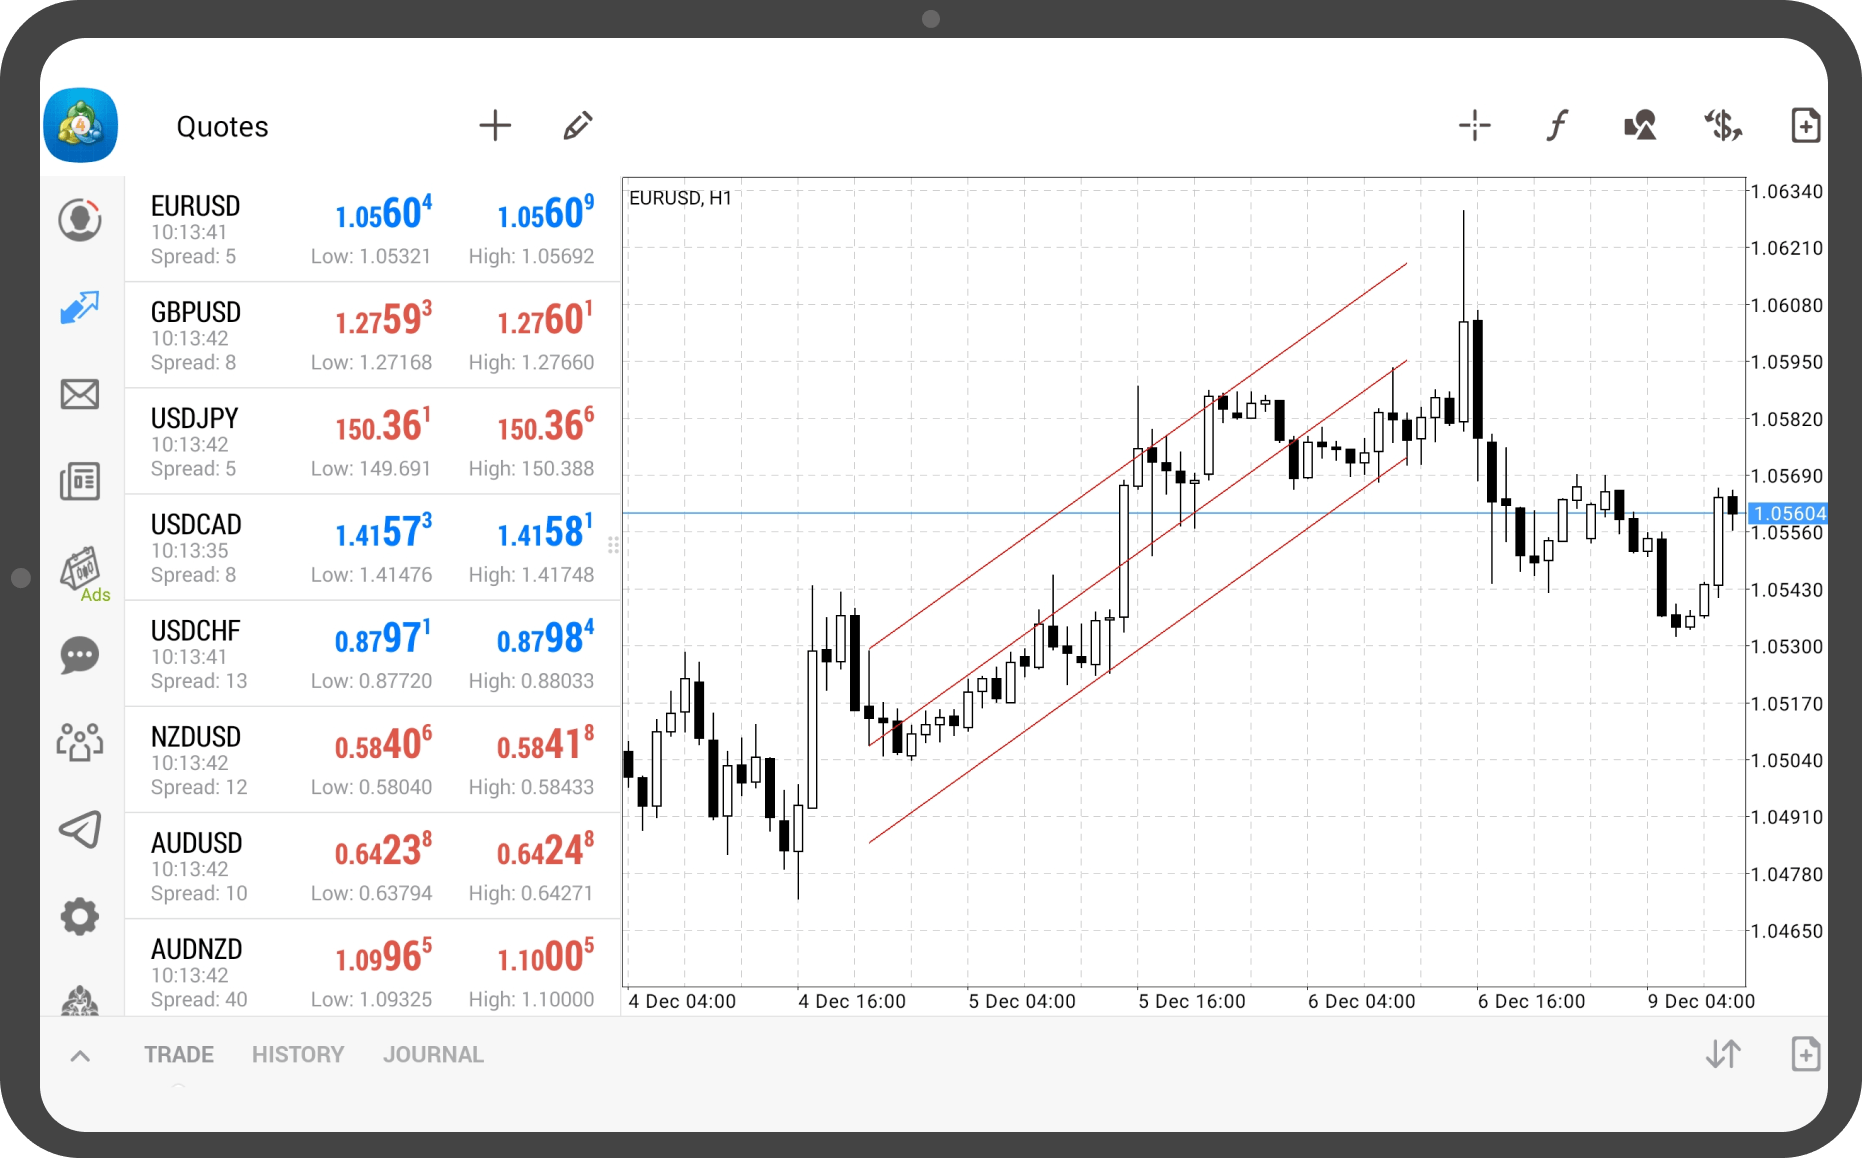
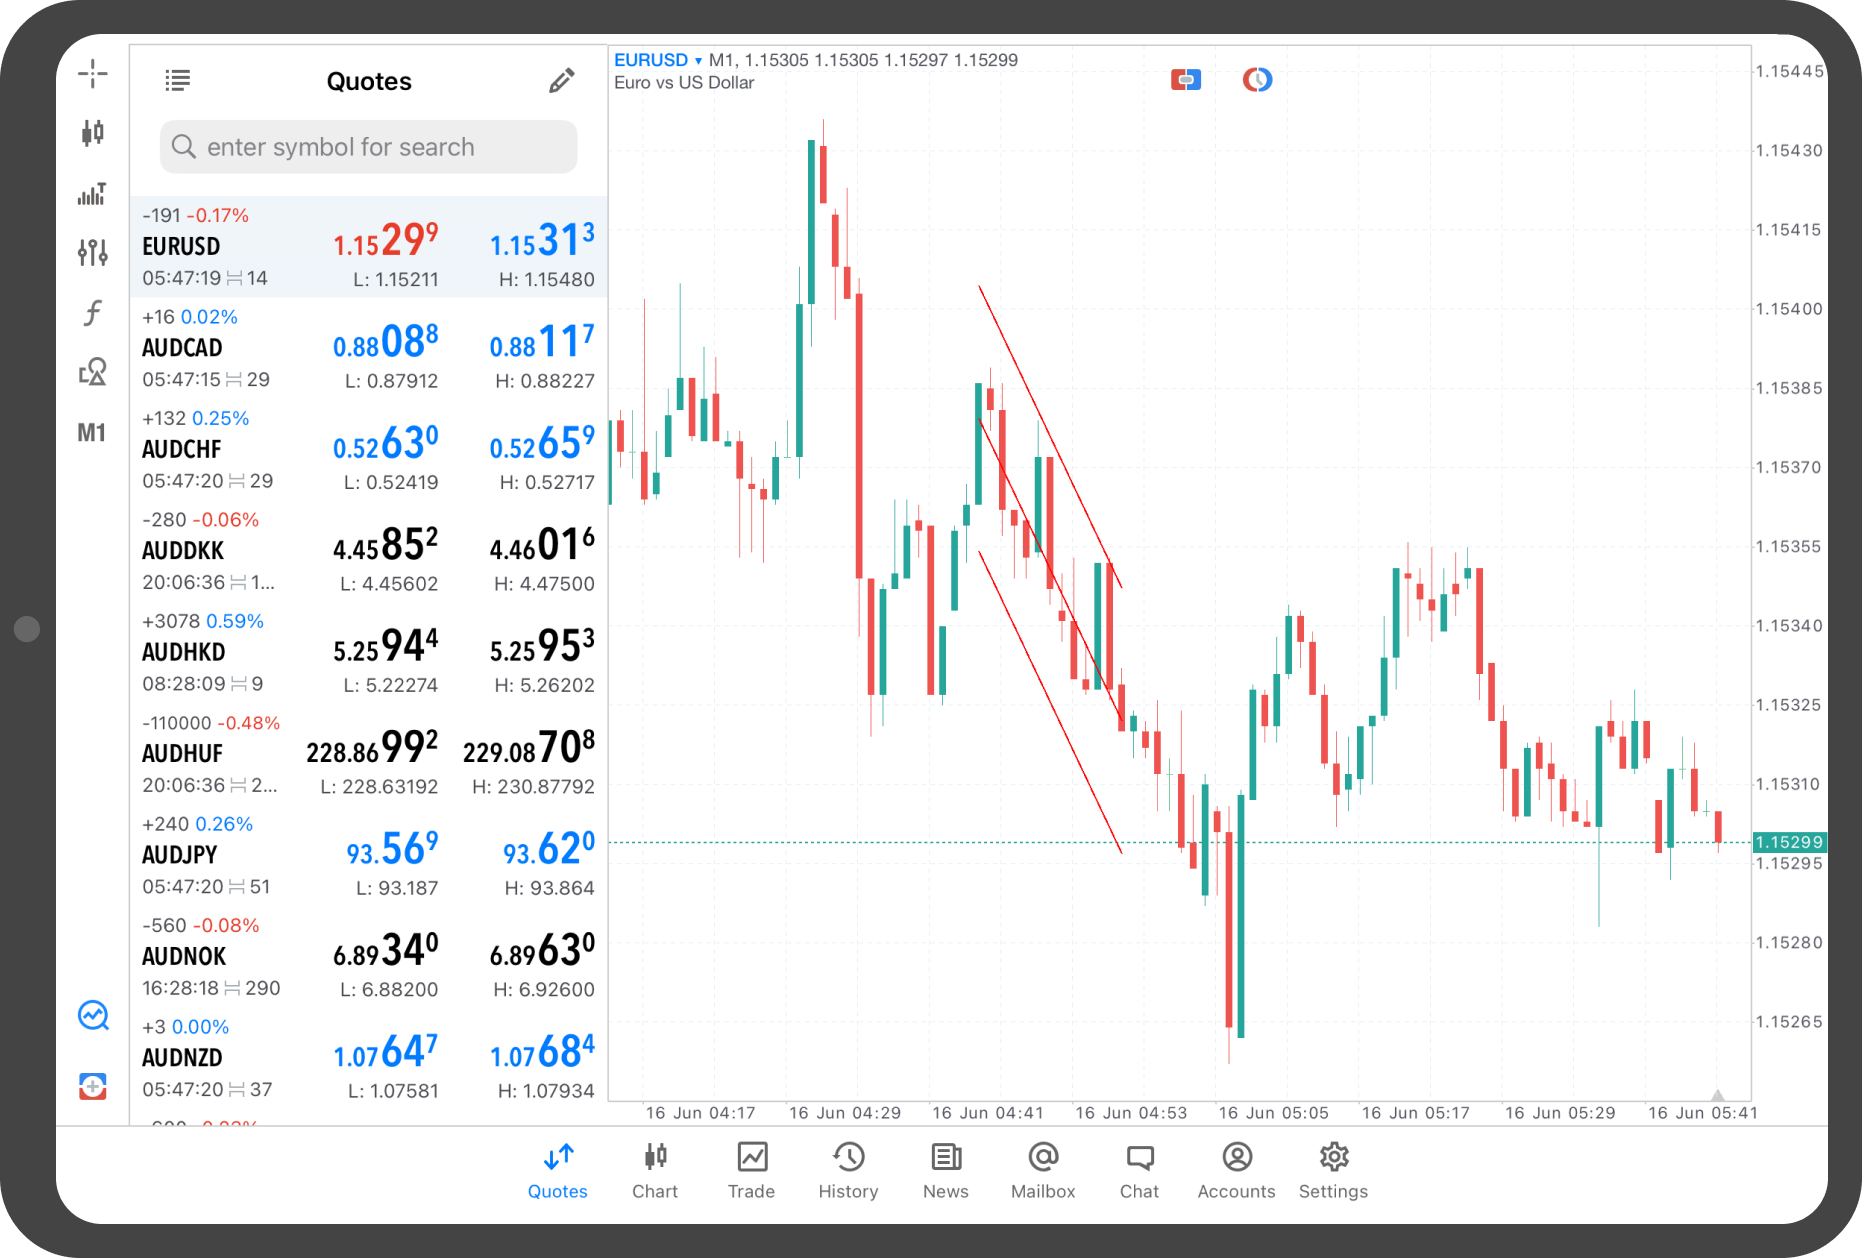
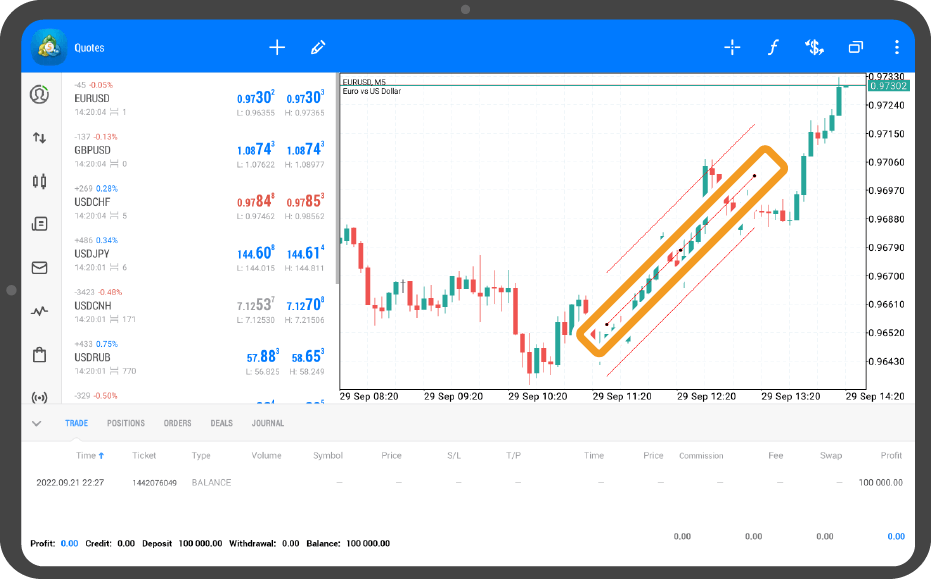
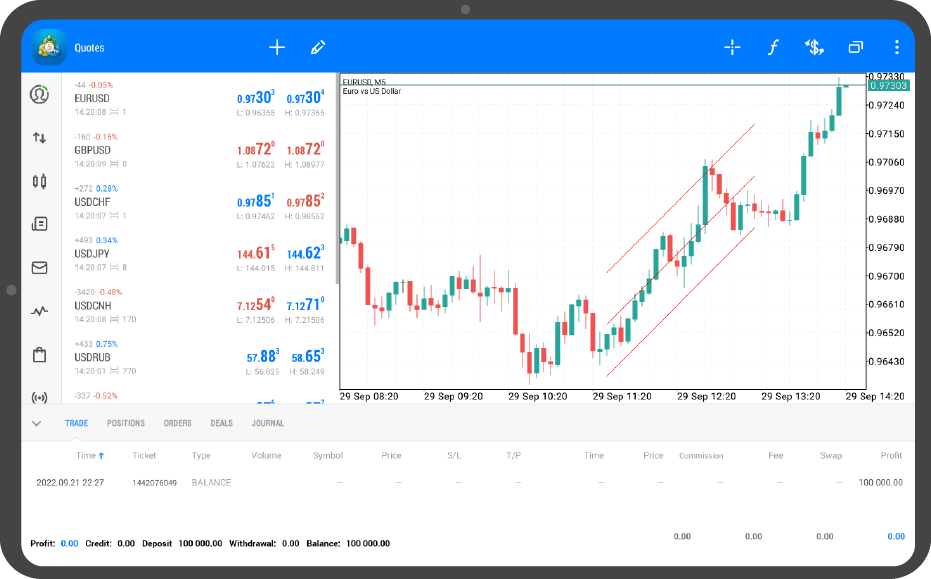
Here we'll look over the steps on how to display the regression channel on the chart in MetaTrader4 (MT4) / MetaTrader5 (MT5) app for Android and iOS mobile devices. The regression channel, also known as a linear regression trend, differs from the trendline in that it is drawn between prices. The line above represents the resistance line and the bottom line represents the support line. You can use these to predict the trend direction and breakpoints.
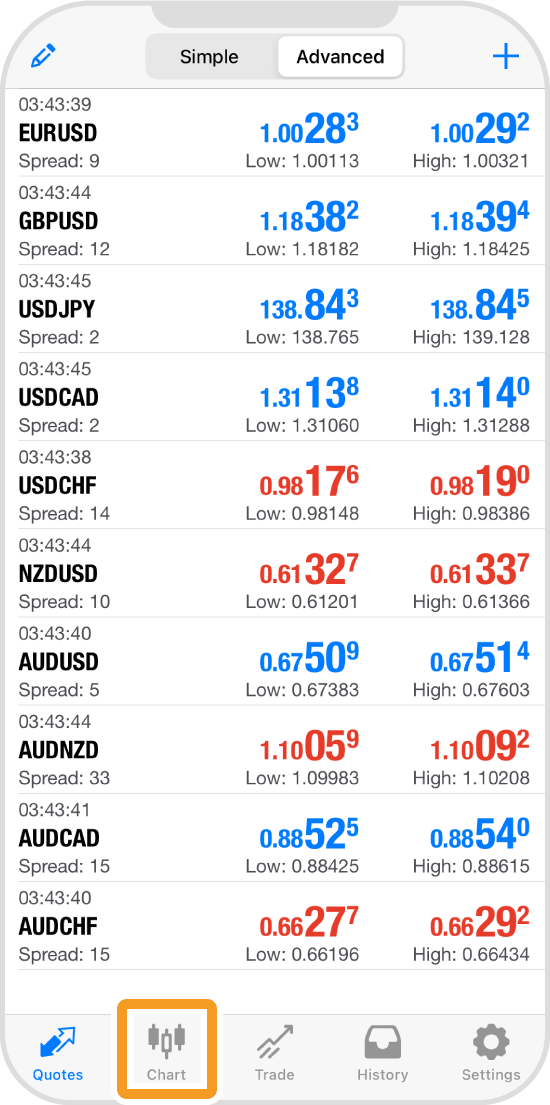
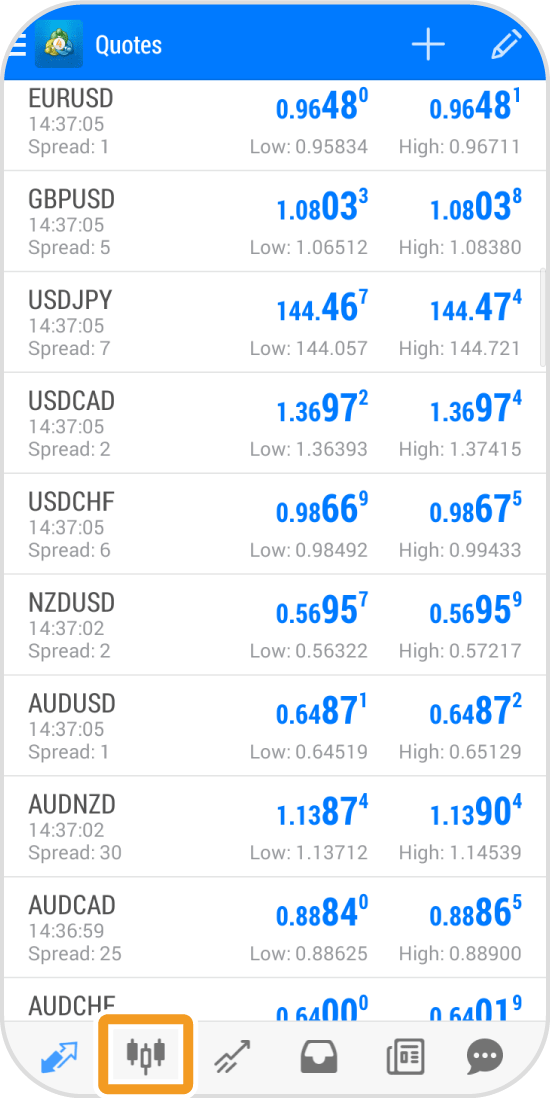
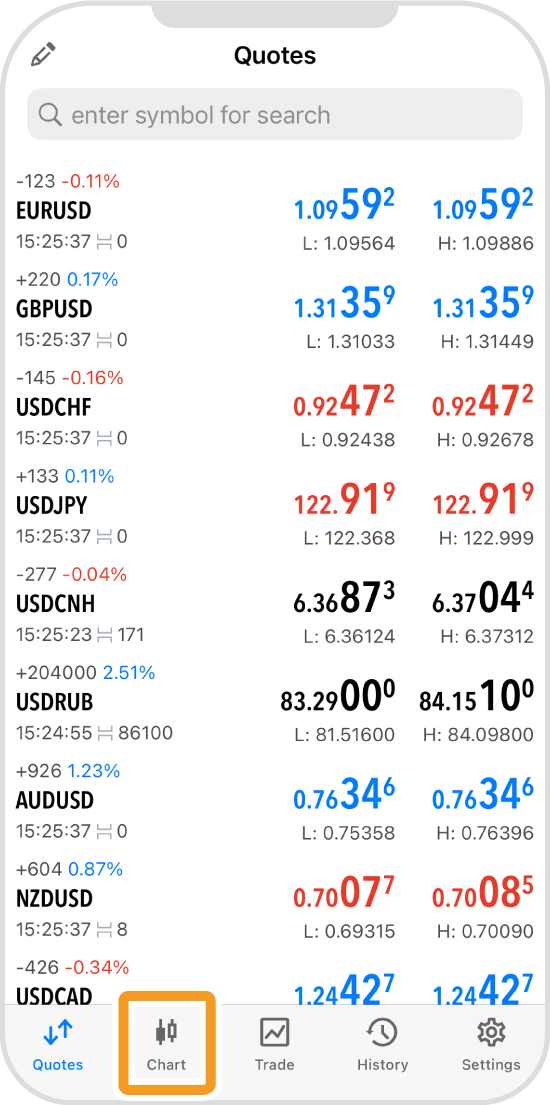
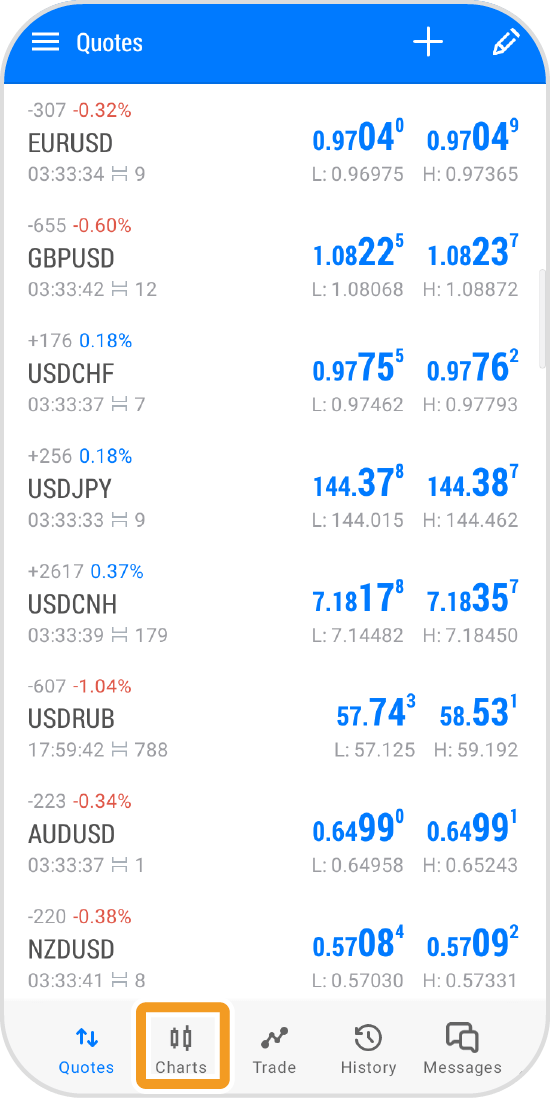
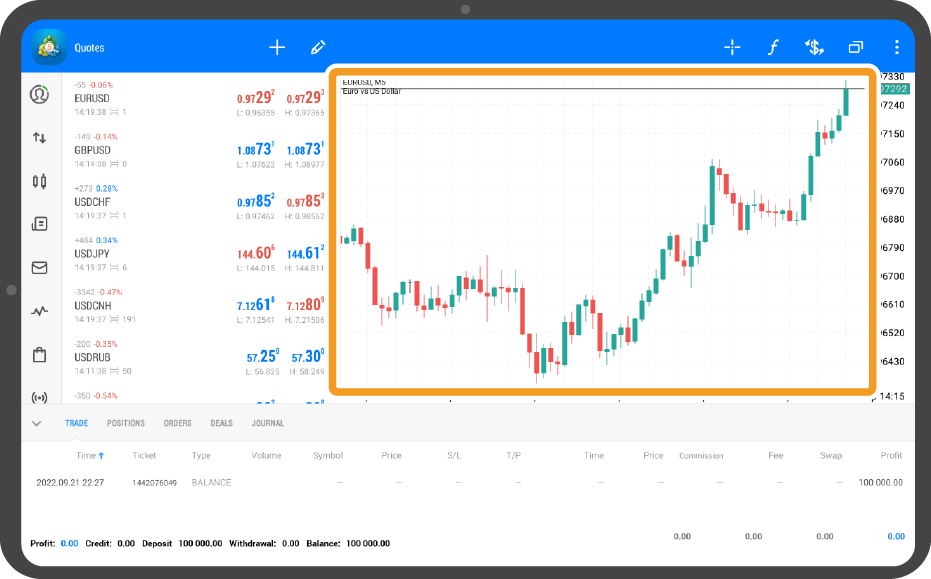
Tap "Chart" on the bottom navigation bar.
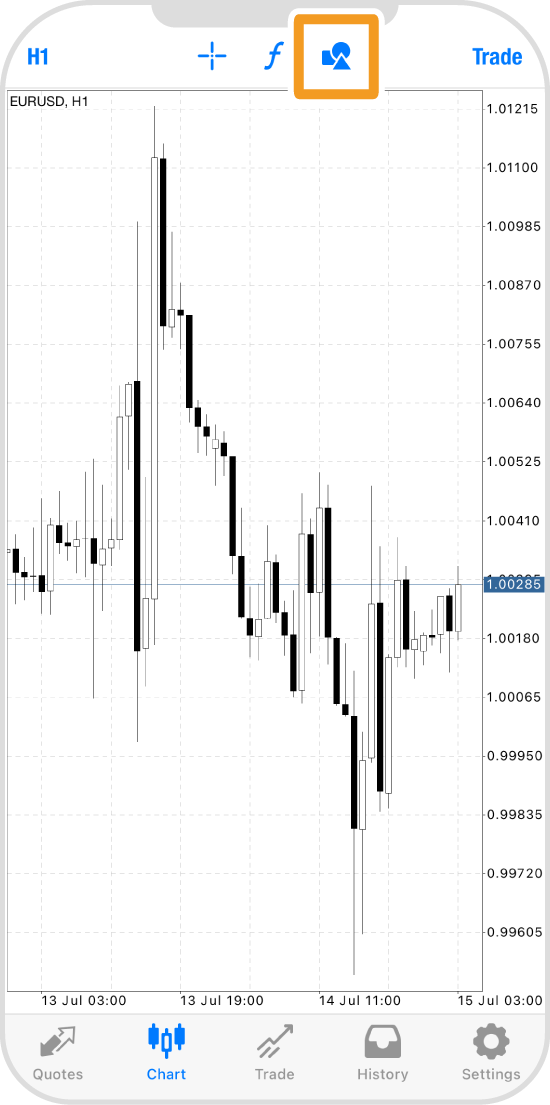
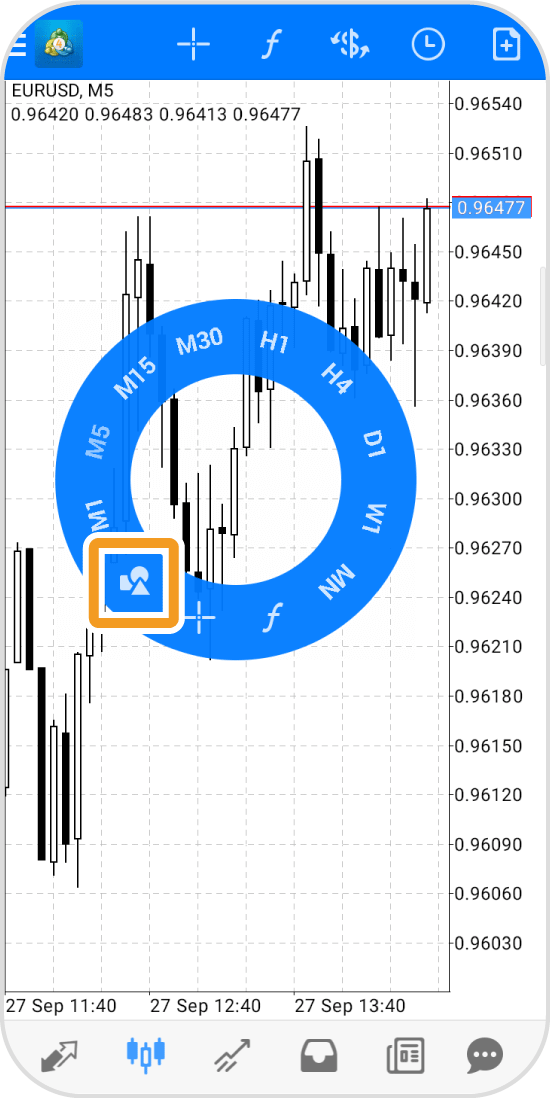
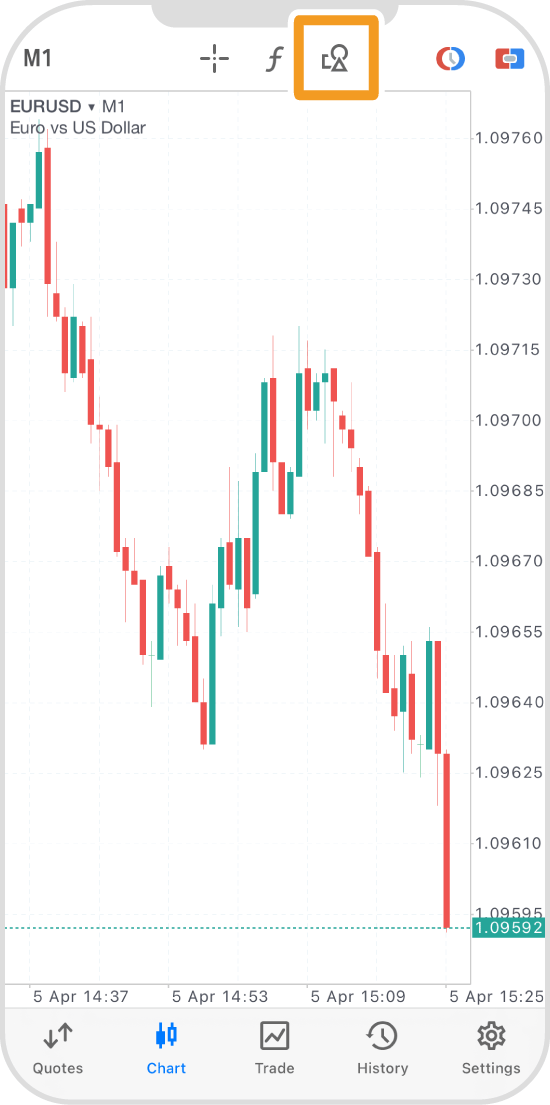
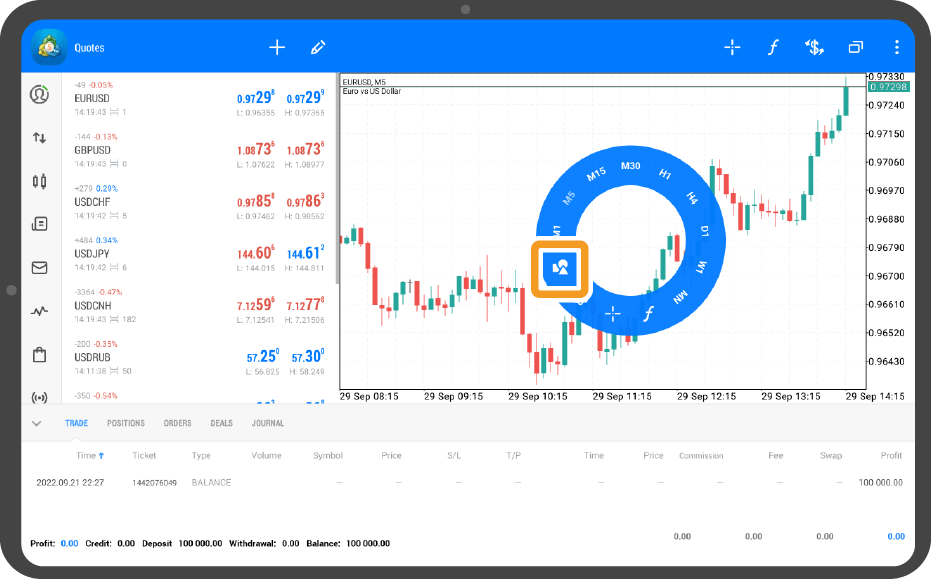
Tap the "Objects" icon at the top.
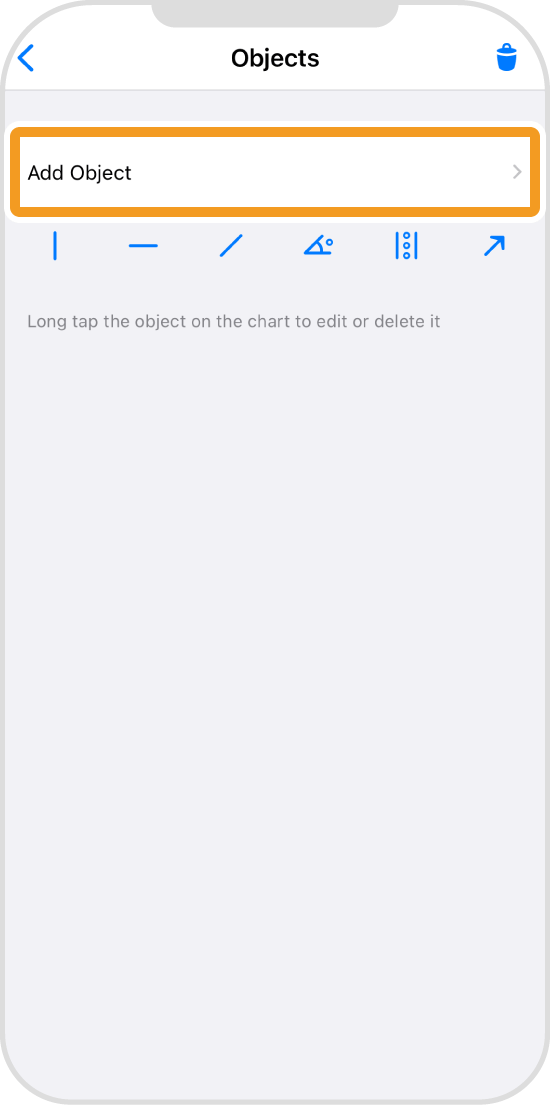
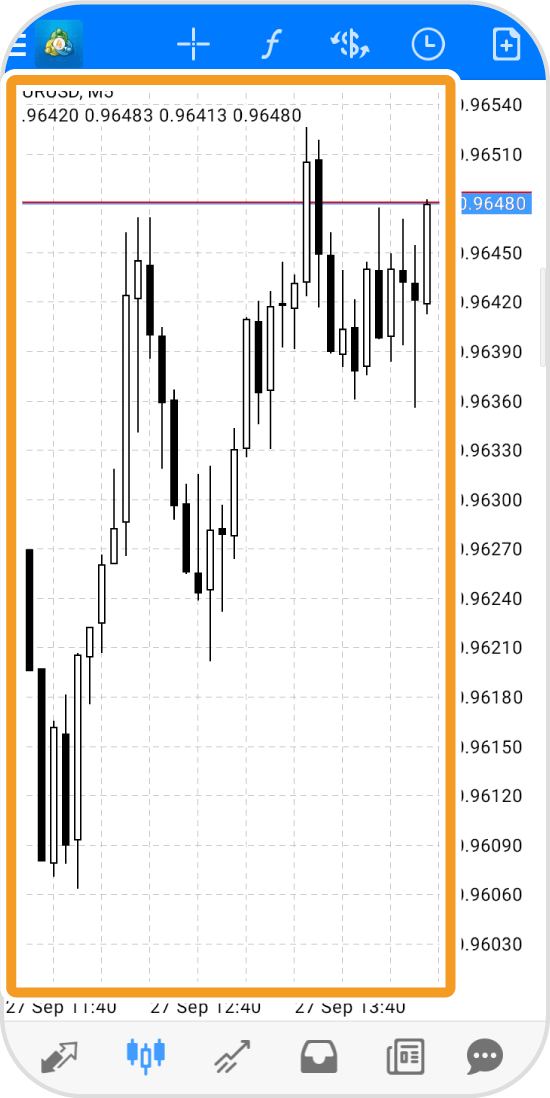
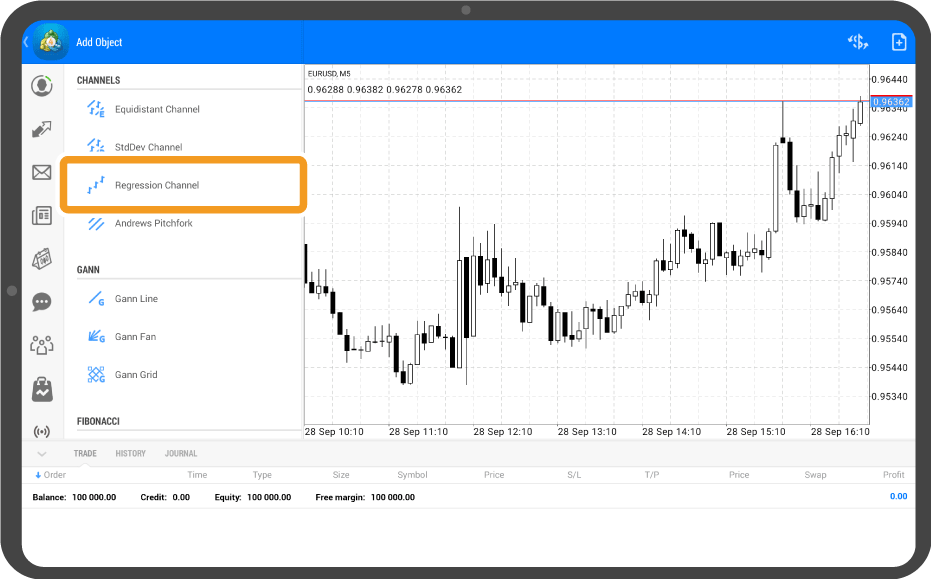
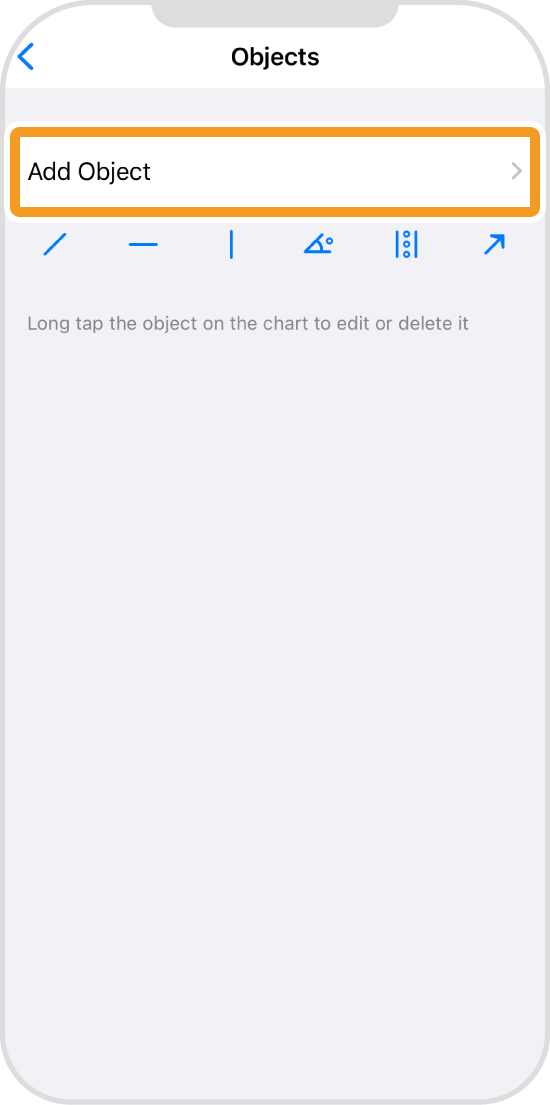
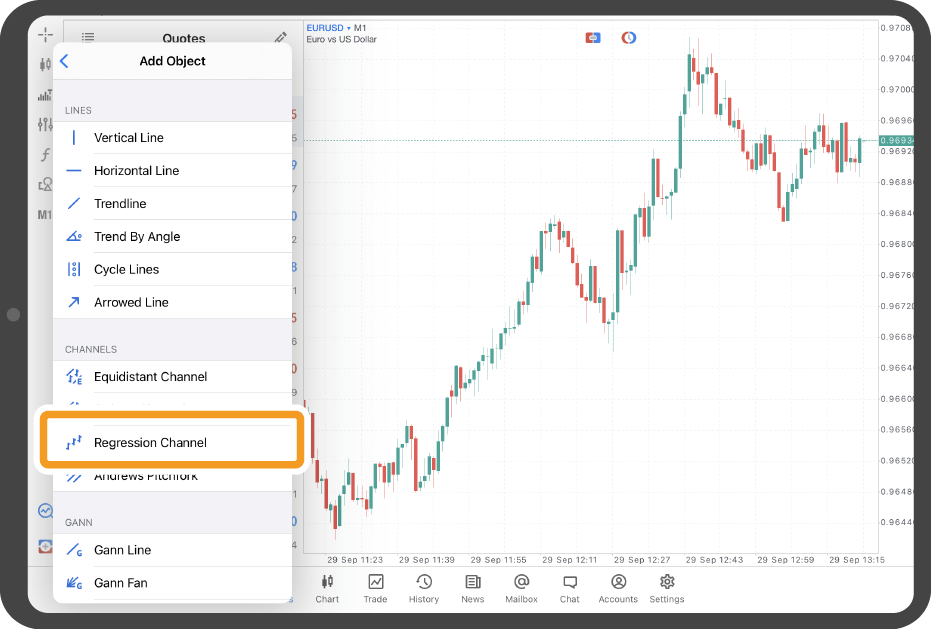
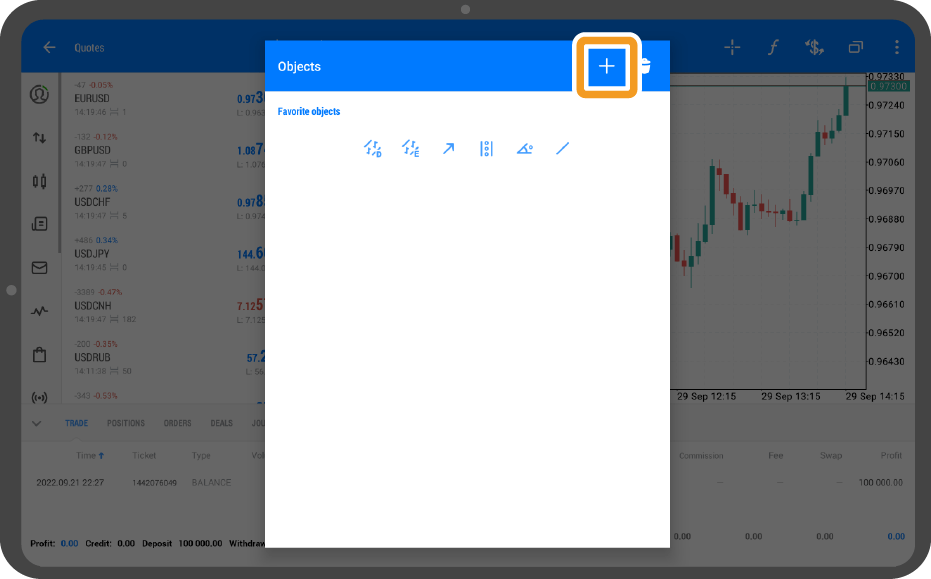
Tap "Add Object".
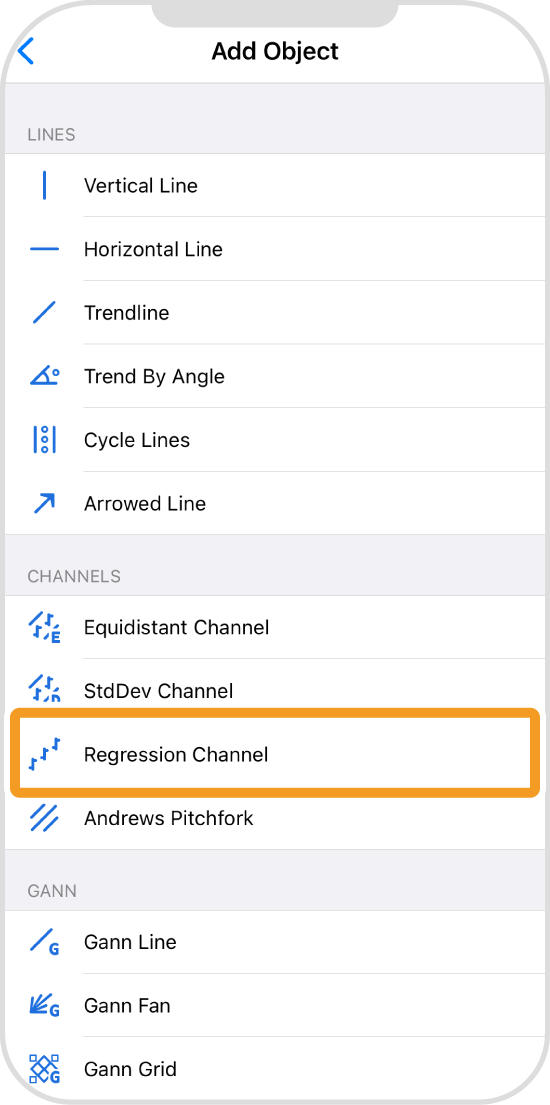
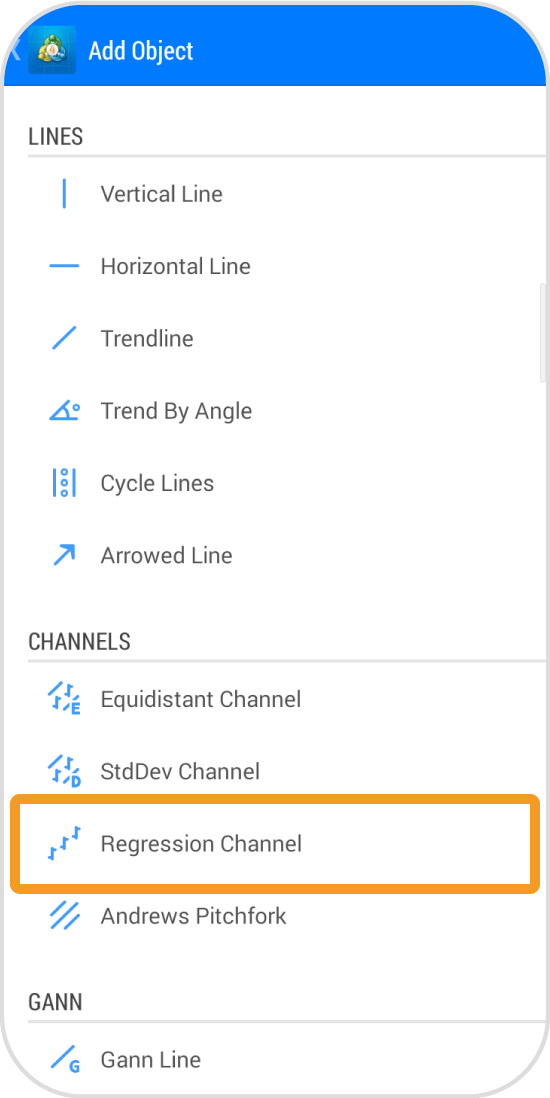
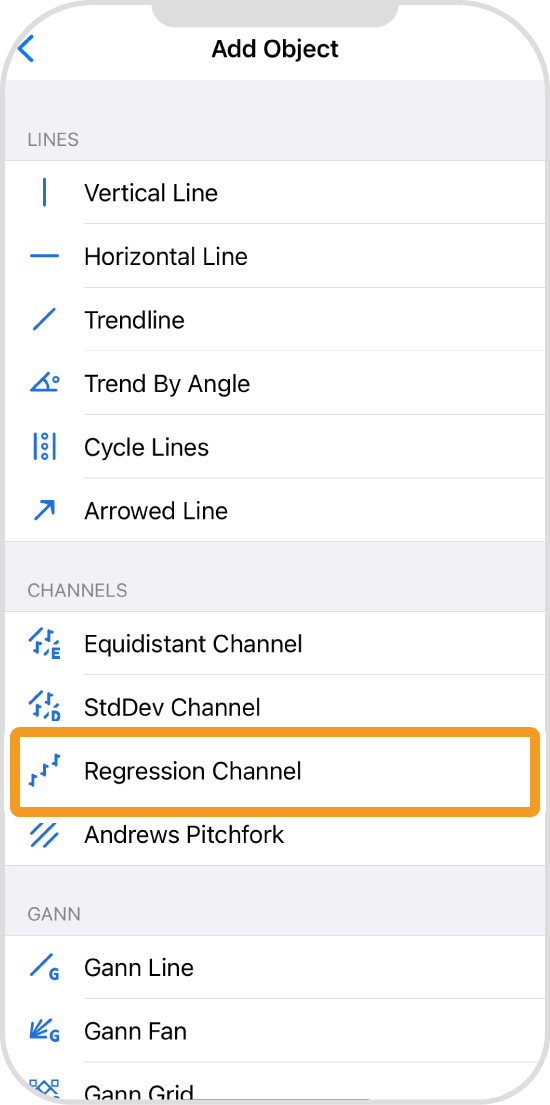
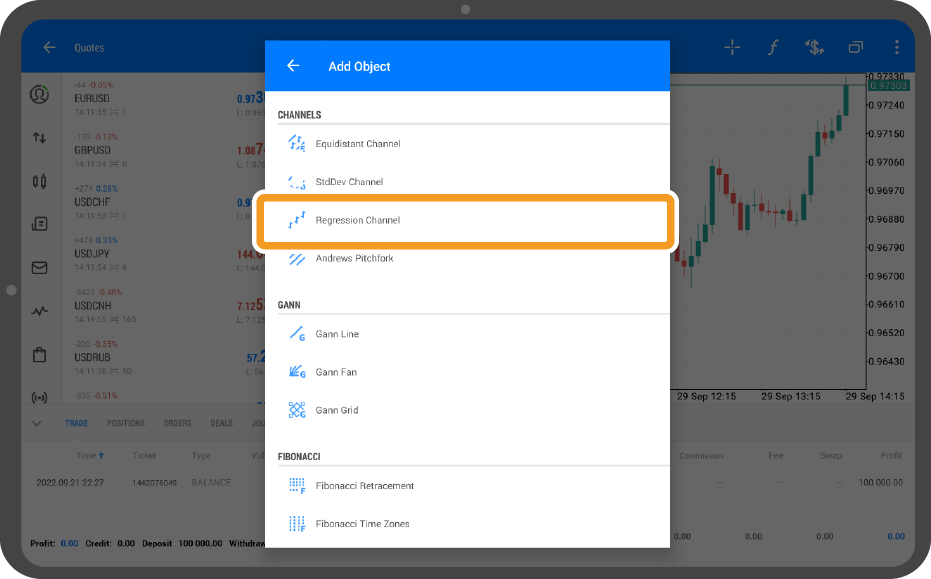
Tap "Regression Channel".
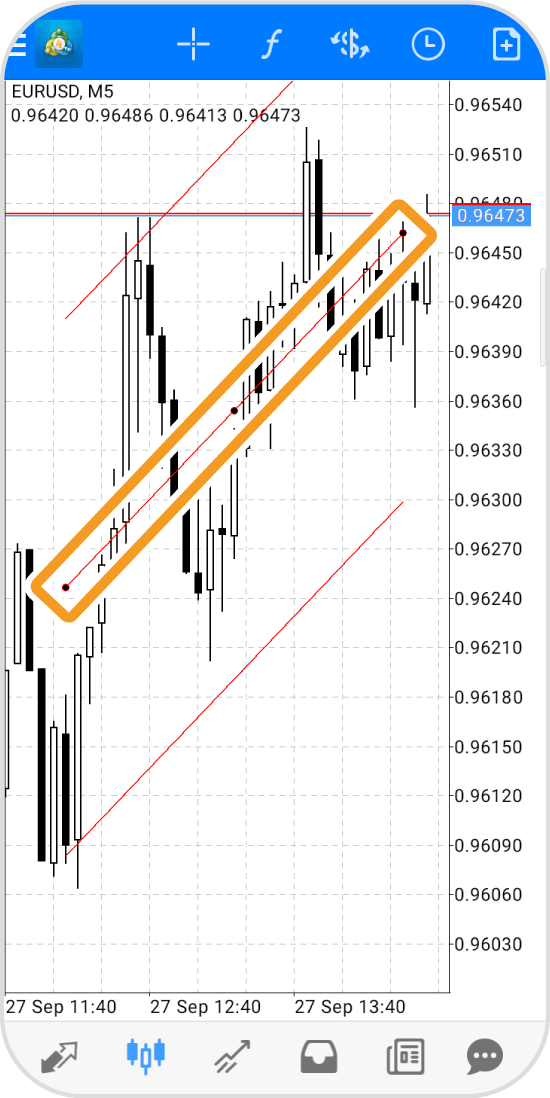
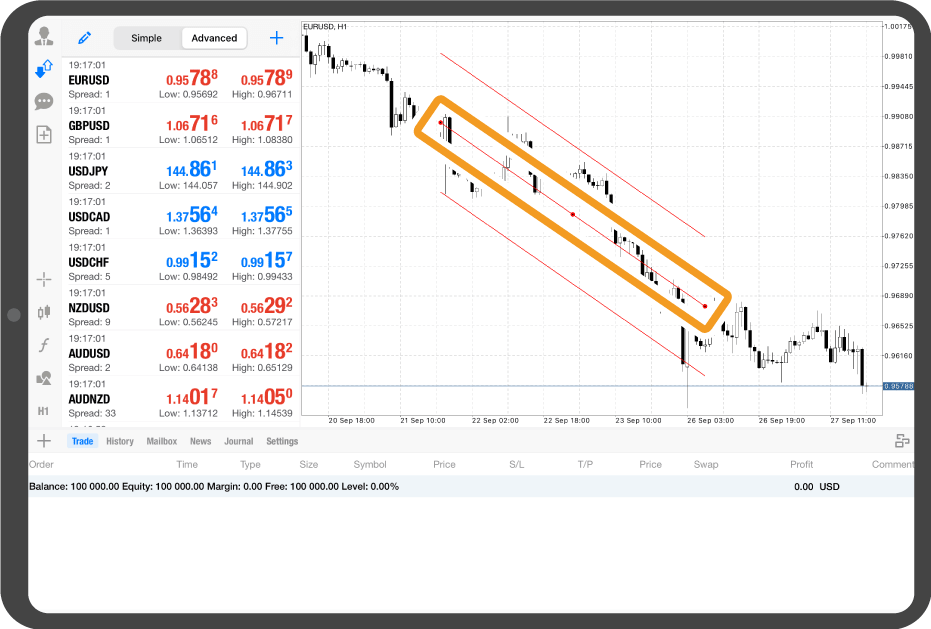
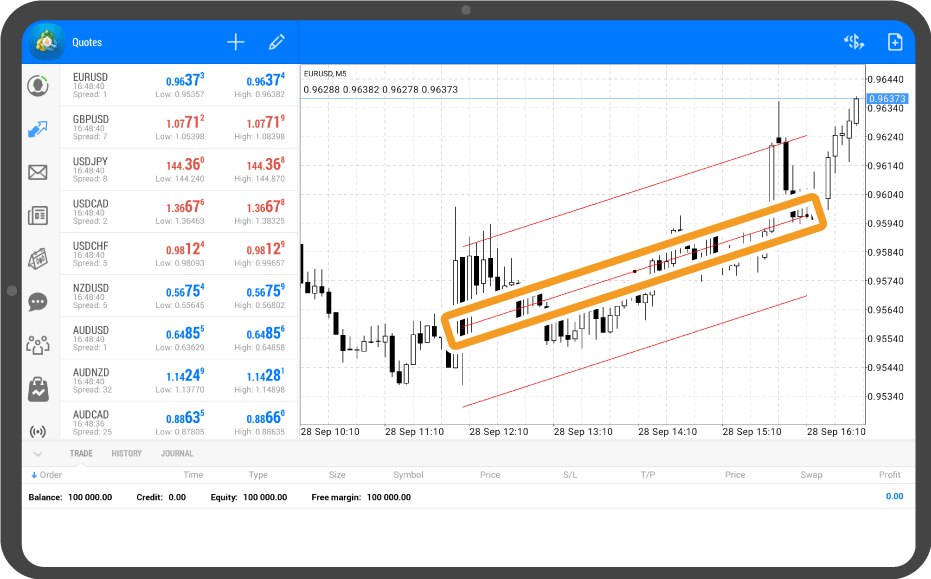
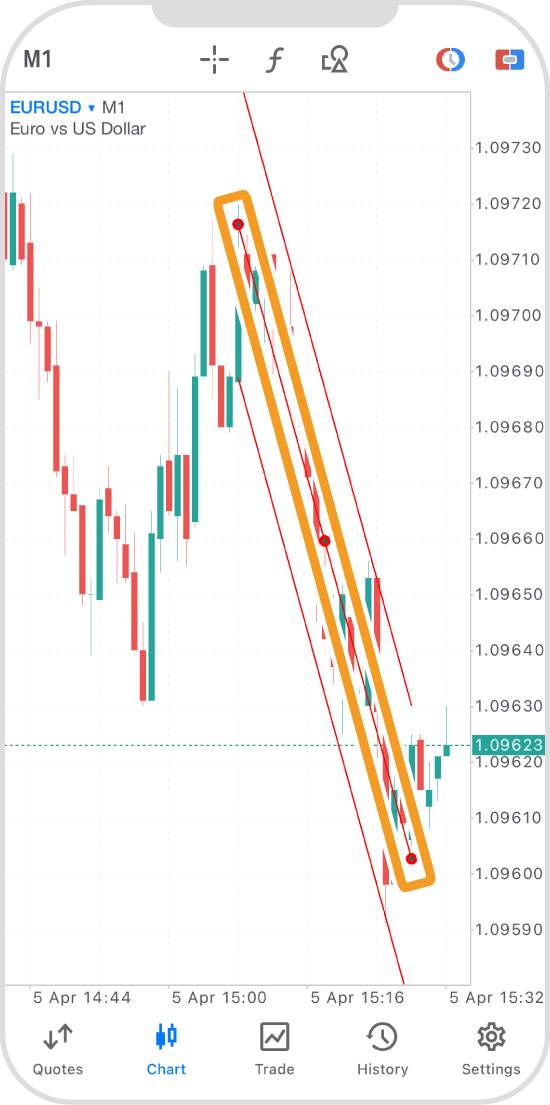
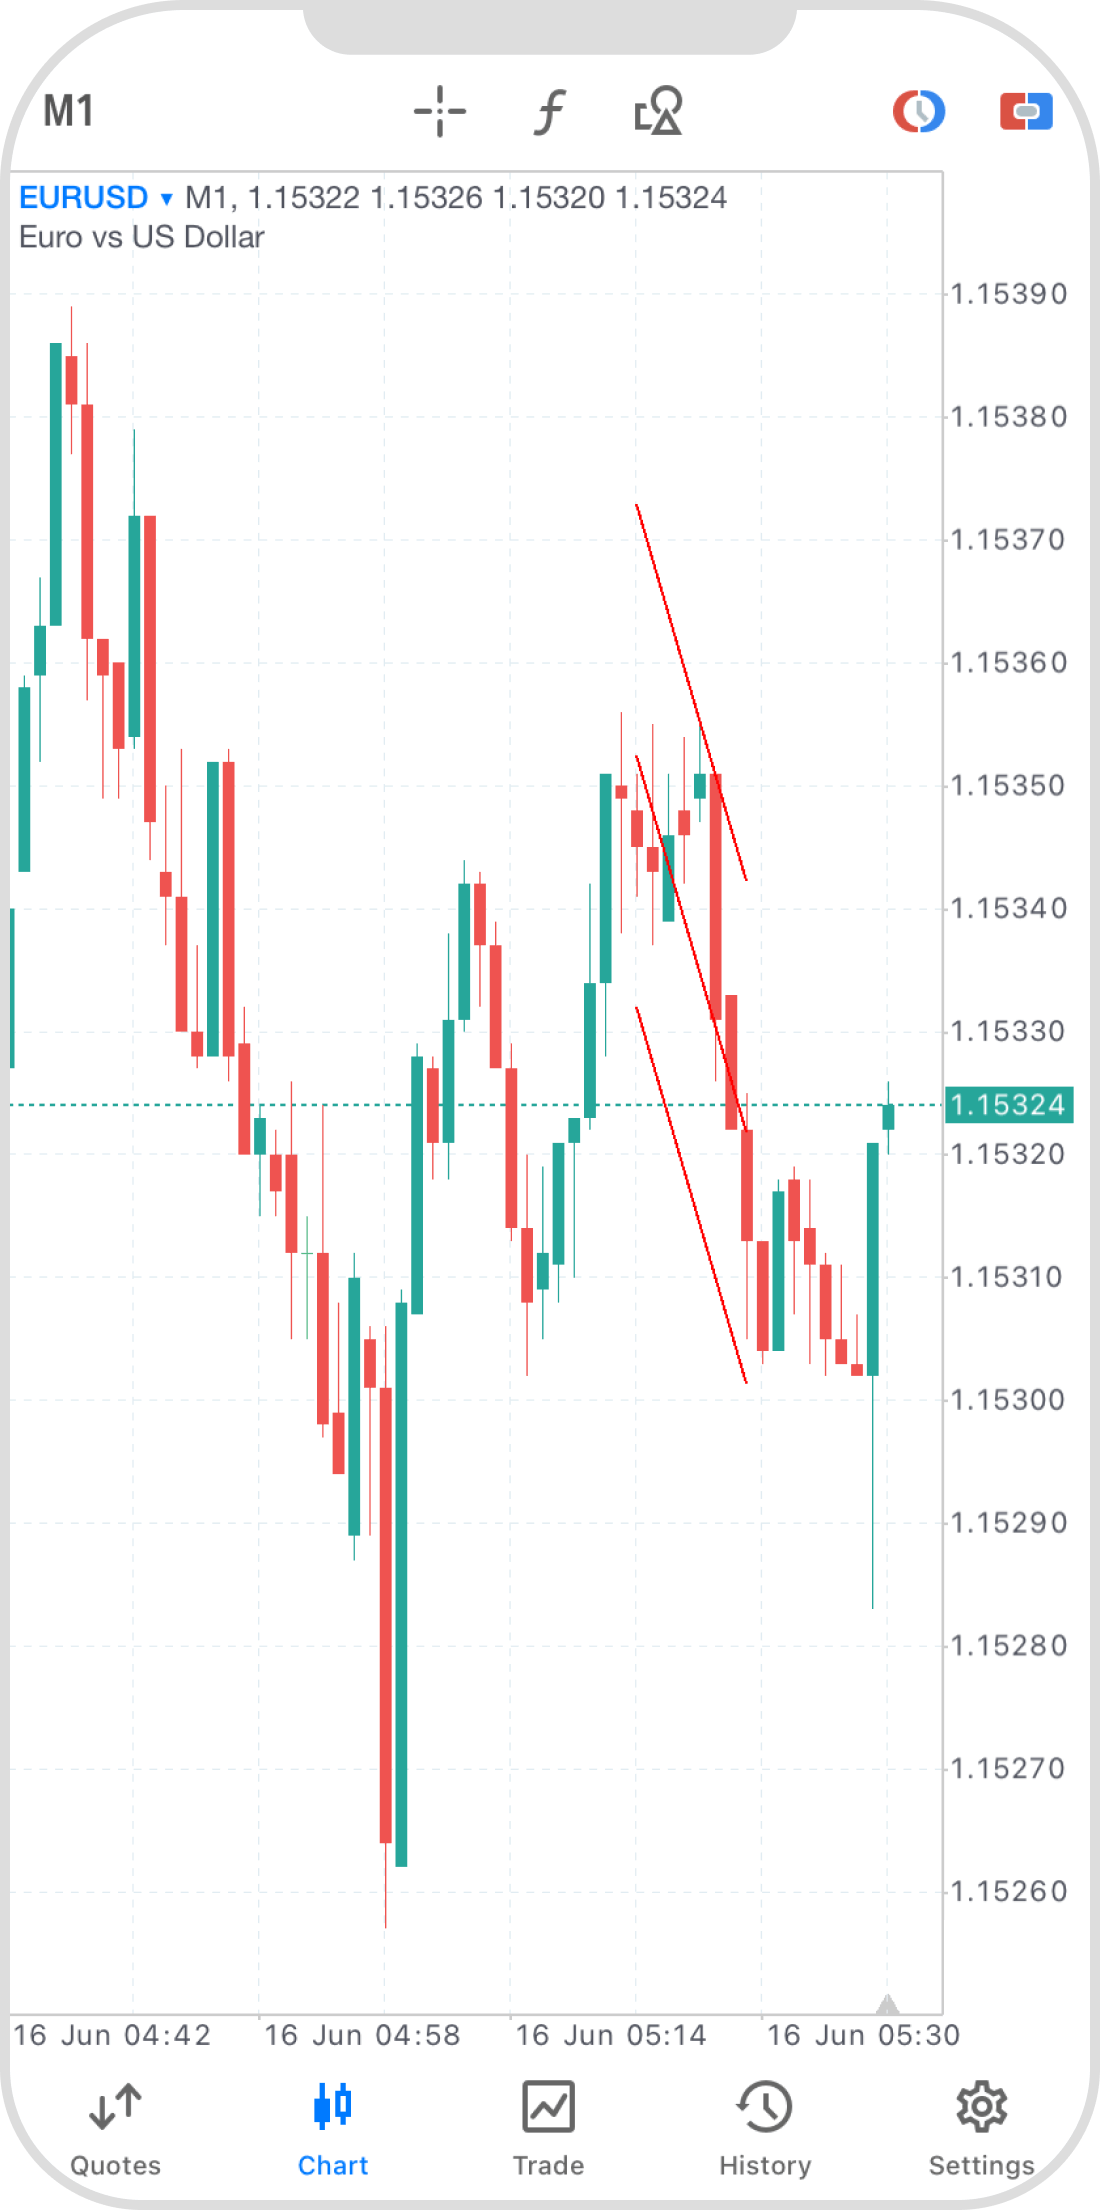
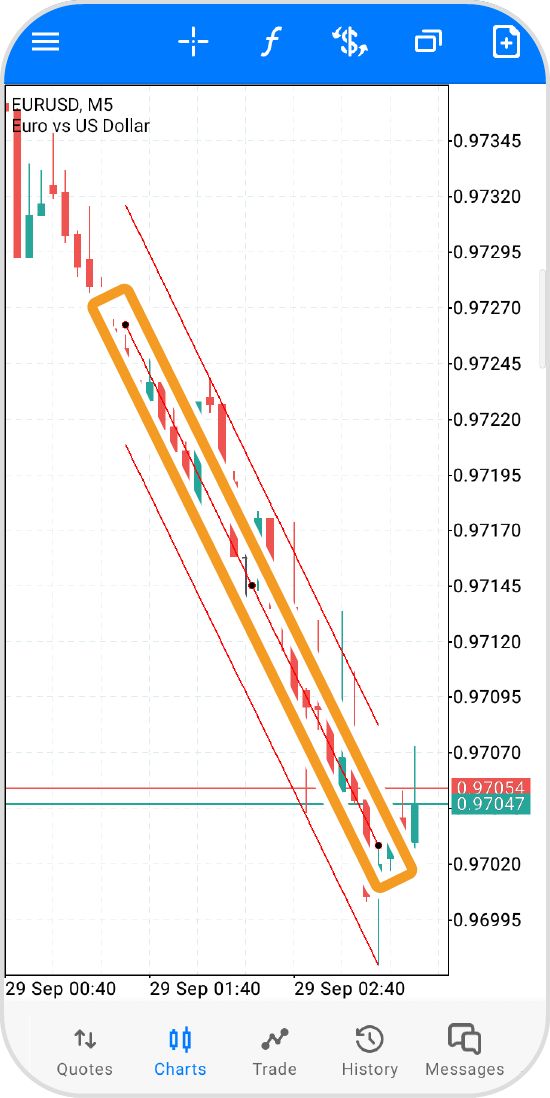
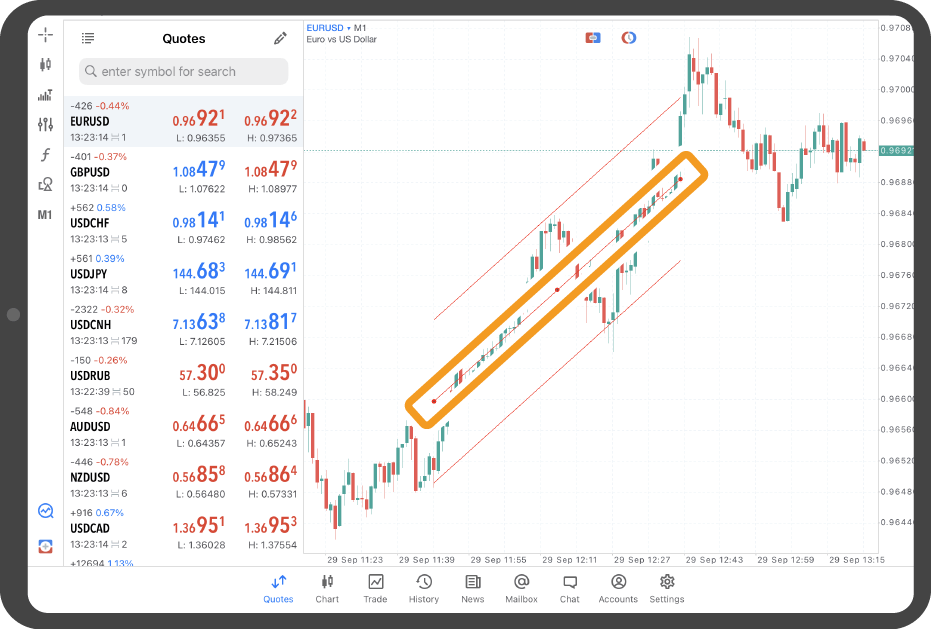
Tap at the starting point and drag to the end point.
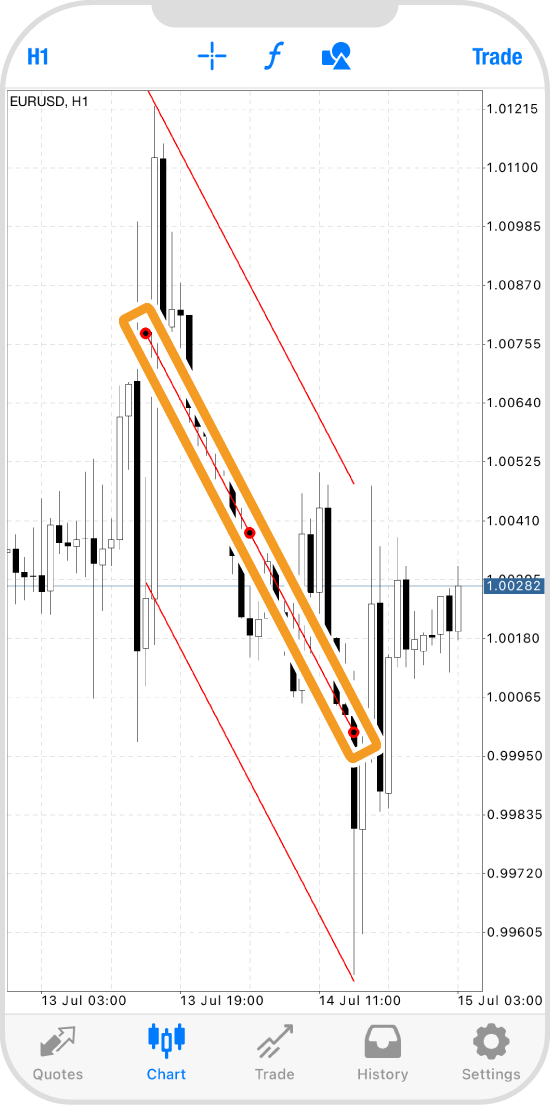
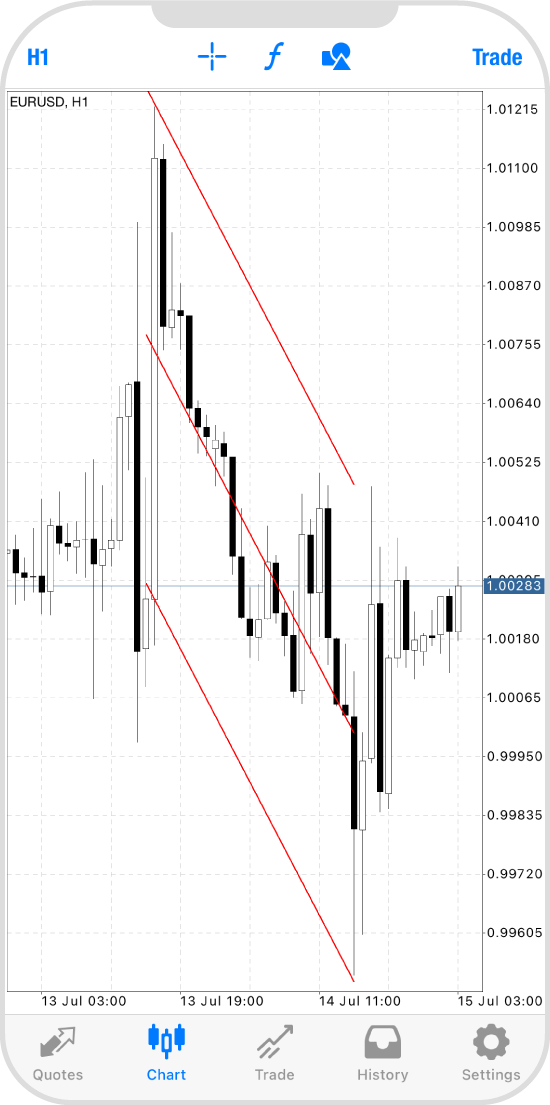
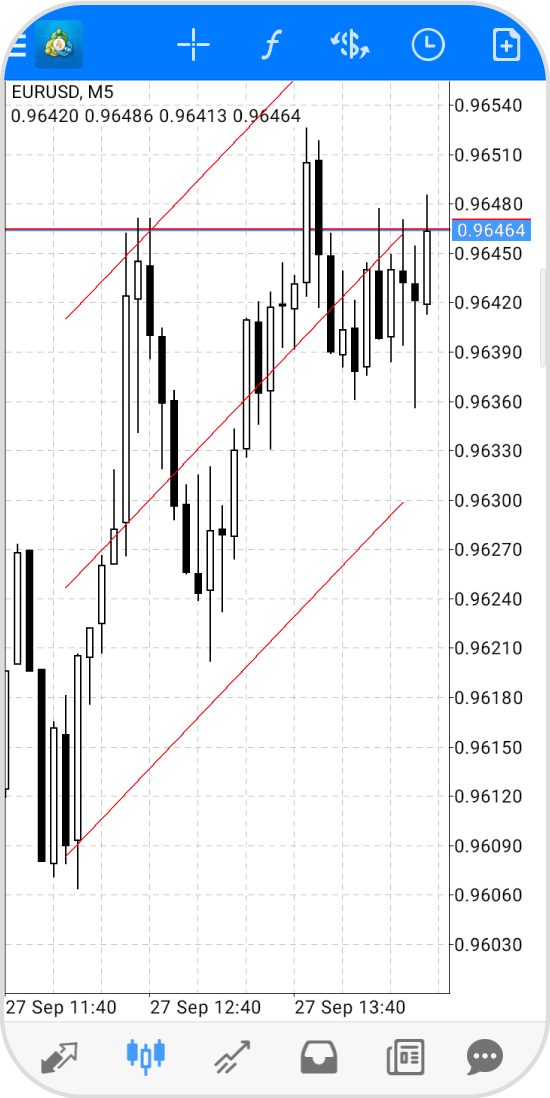
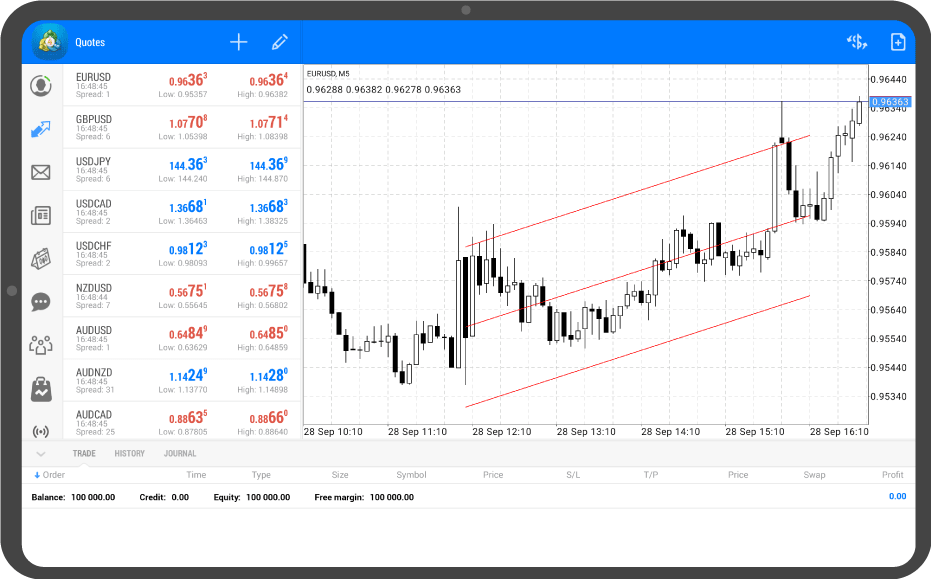
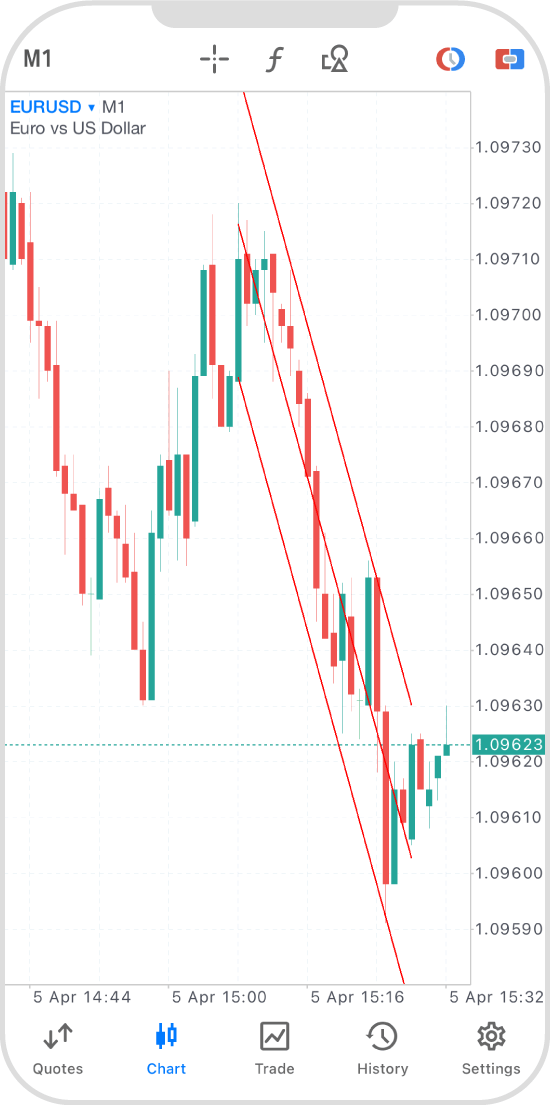
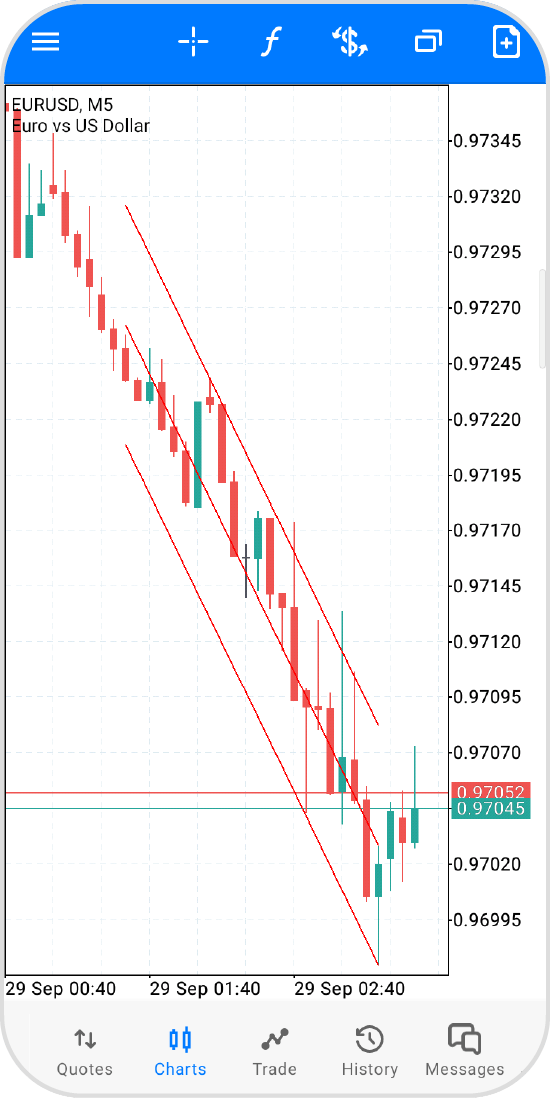
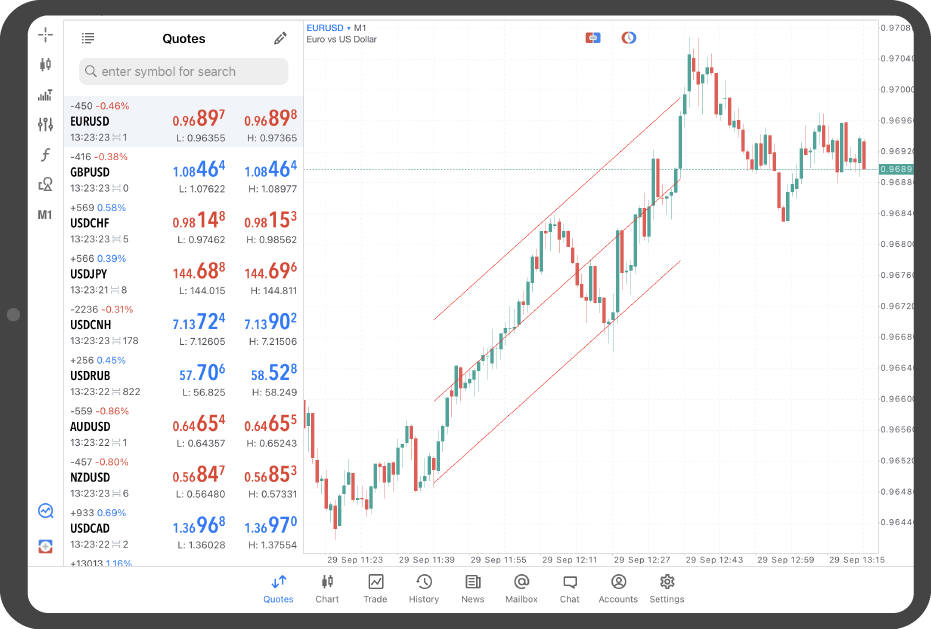
To fix the regression channel, tap on the line to hide the dots.
Tap "Chart" on the bottom navigation bar.
Tap on the chart.
Tap the "Objects" icon.
Tap "+" in the top right corner.
Tap "Regression Channel".
Tap the starting point of the regression channel and drag to the endpoint.
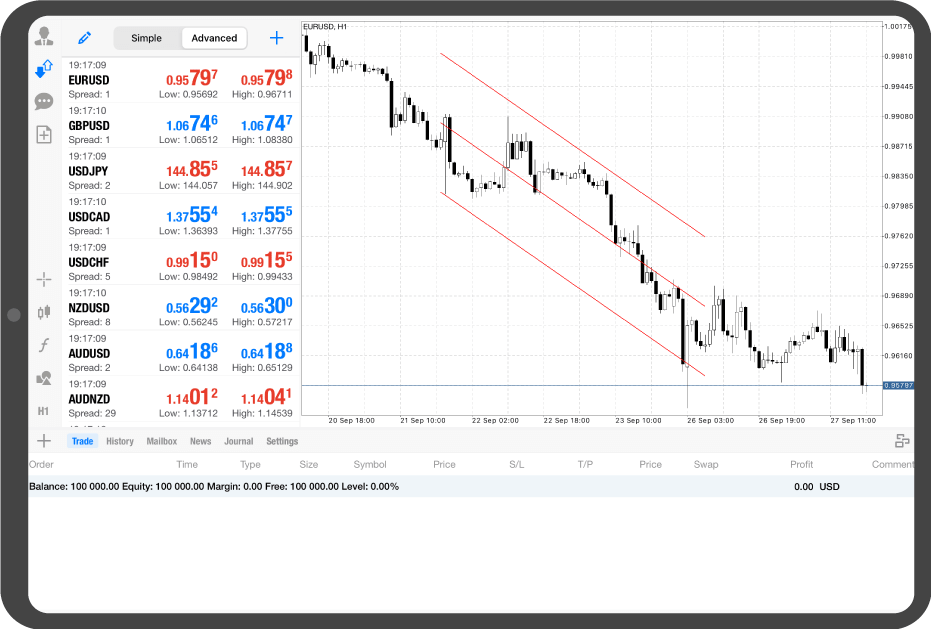
To fix the regression channel, tap around the line with three black dots to hide them.
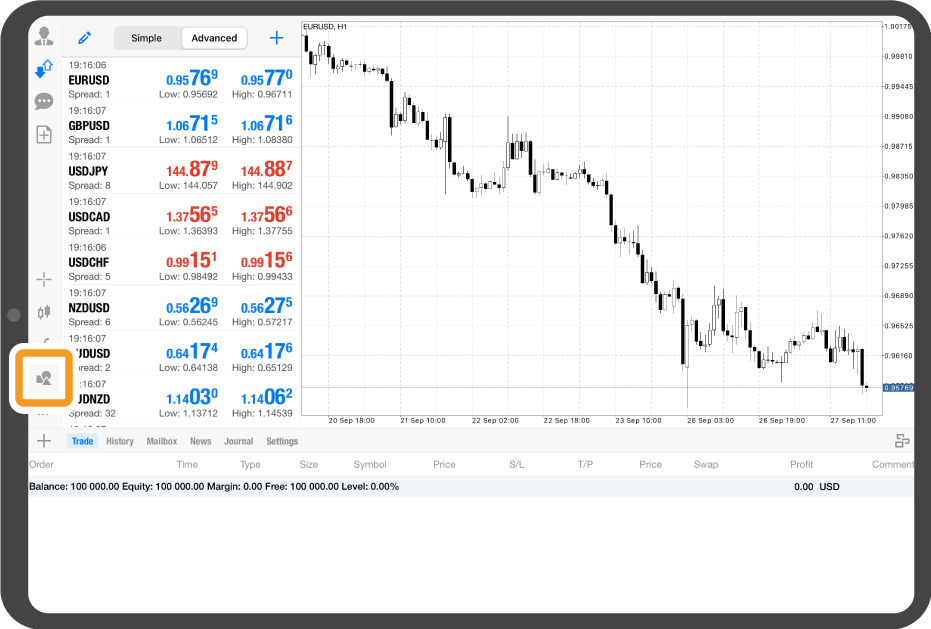
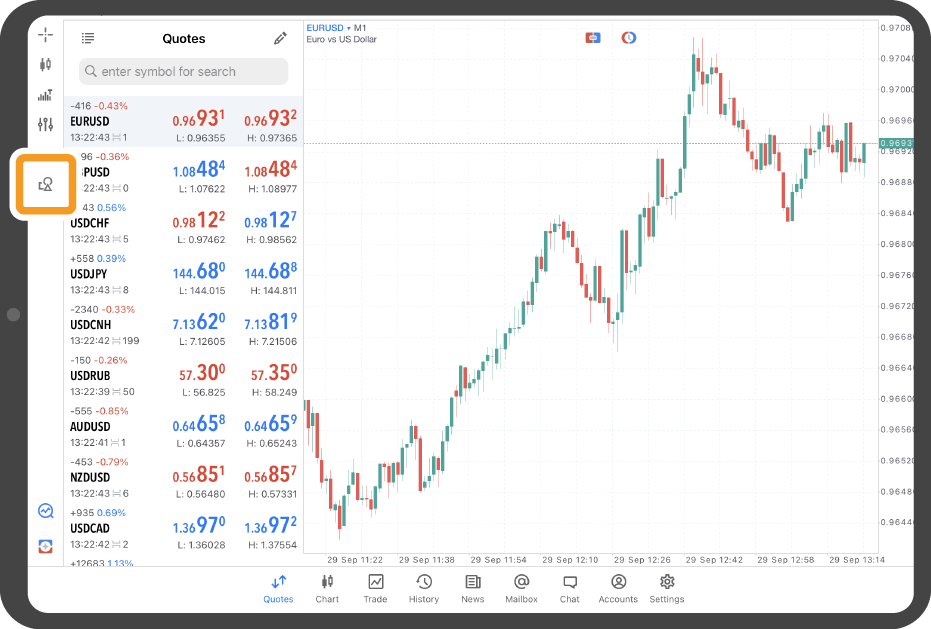
Tap the "Objects" icon on the left.
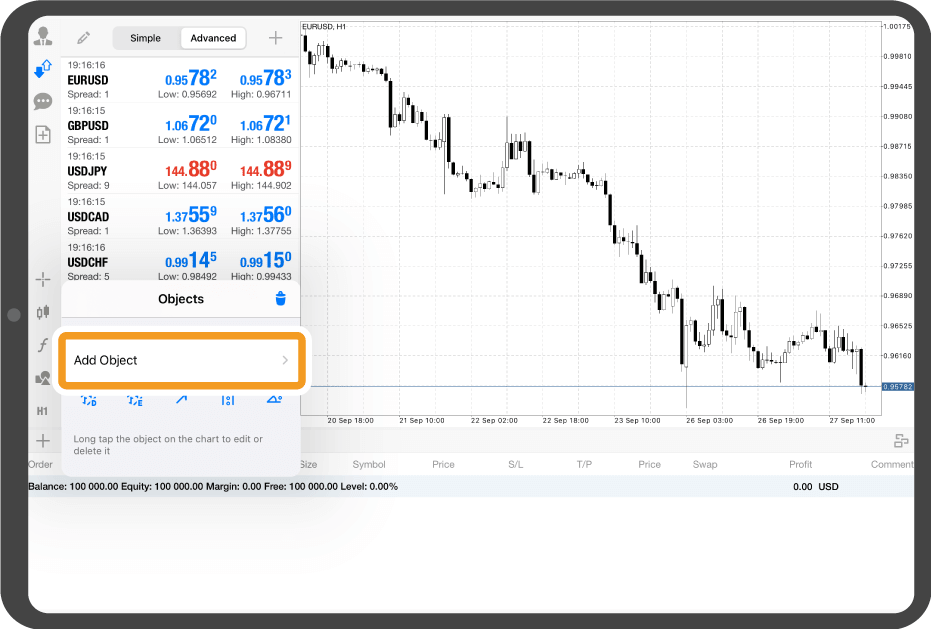
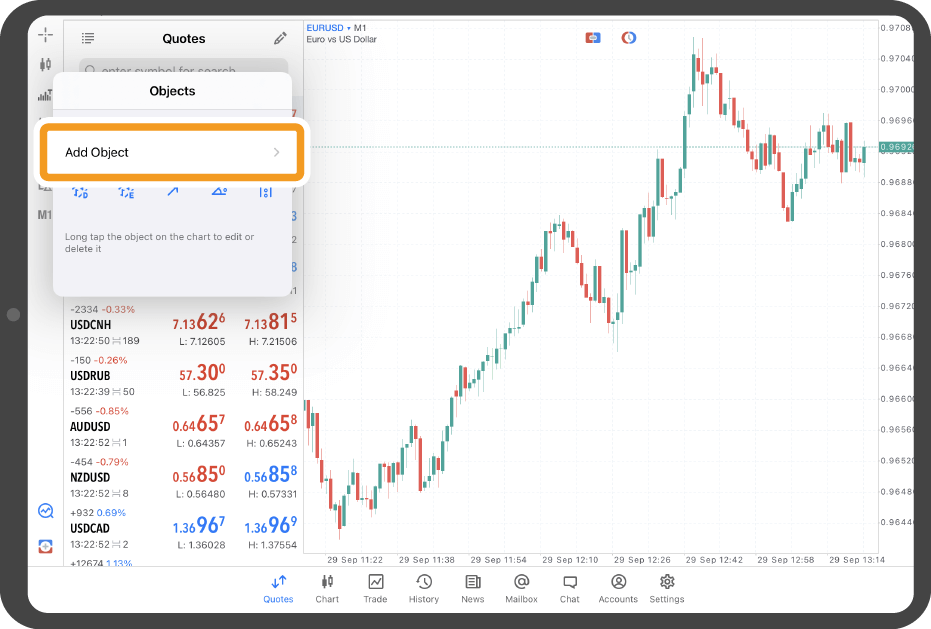
Tap "Add Object".
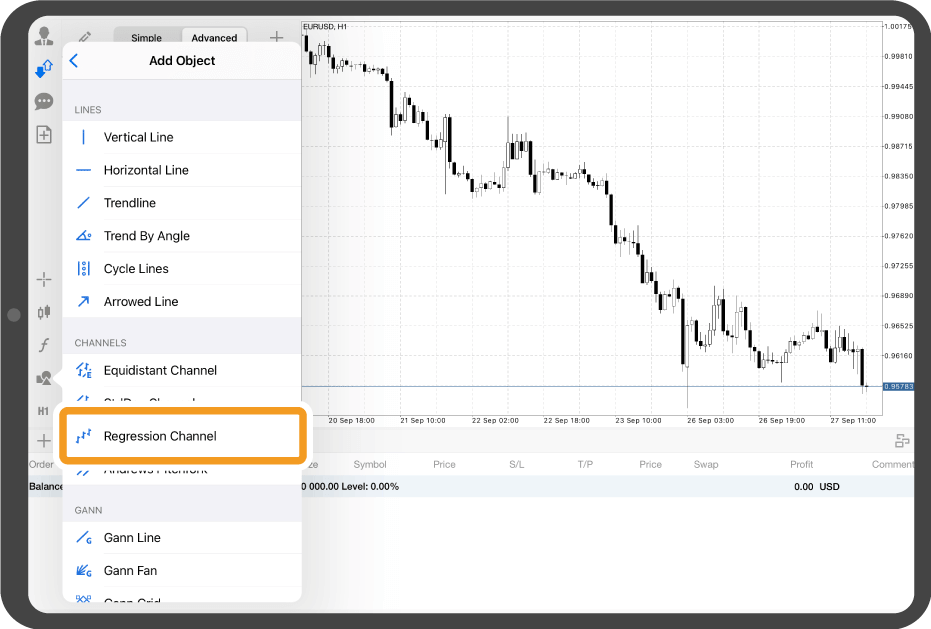
Tap "Regression Channel".
Tap the starting point of the regression channel and drag to the endpoint.
To fix the regression channel, tap around the line with red black dots to hide them.
Tap on the chart.
Tap the "Objects" icon.
The list of objects on the chart will be displayed. Tap "+" in the top right corner.
Tap "Regression Channel".
Tap the starting point of the regression channel and drag to the endpoint.
To fix the regression channel, tap around the line with three black dots to hide them.
Tap "Chart" on the bottom navigation bar.
Tap the "Objects" icon at the top.
Tap "Add Object".
Tap "Regression Channel".
Tap at the starting point and drag to the end point.
In the menu that appears after swiping, you can also change the line's color, thickness, and style.
To fix the regression channel, tap on the line to hide the dots.
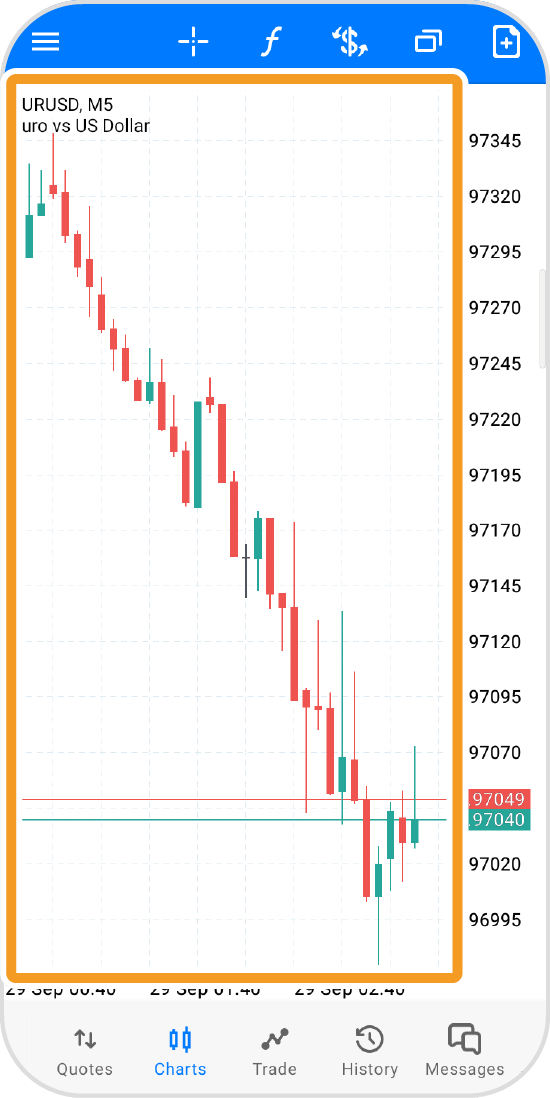
Tap "Charts" on the bottom navigation bar.
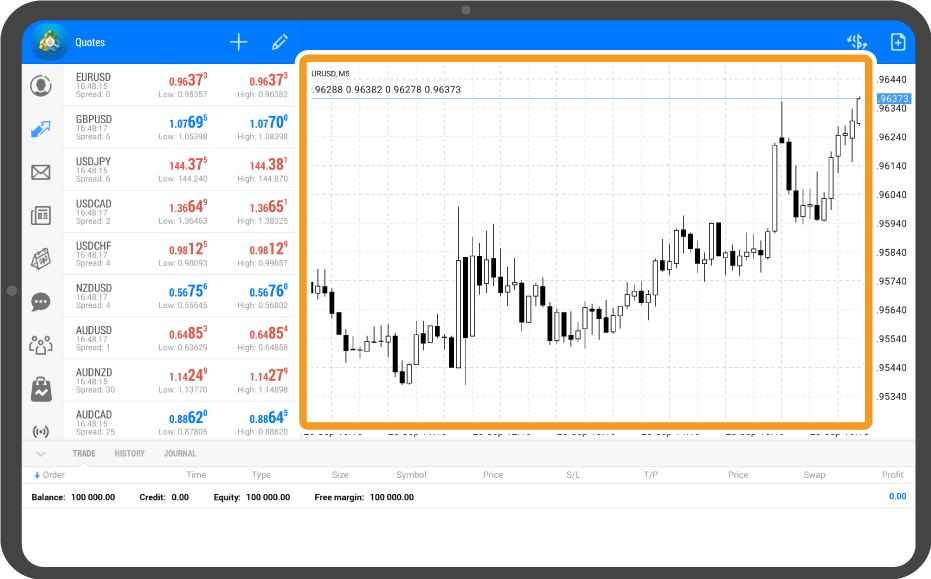
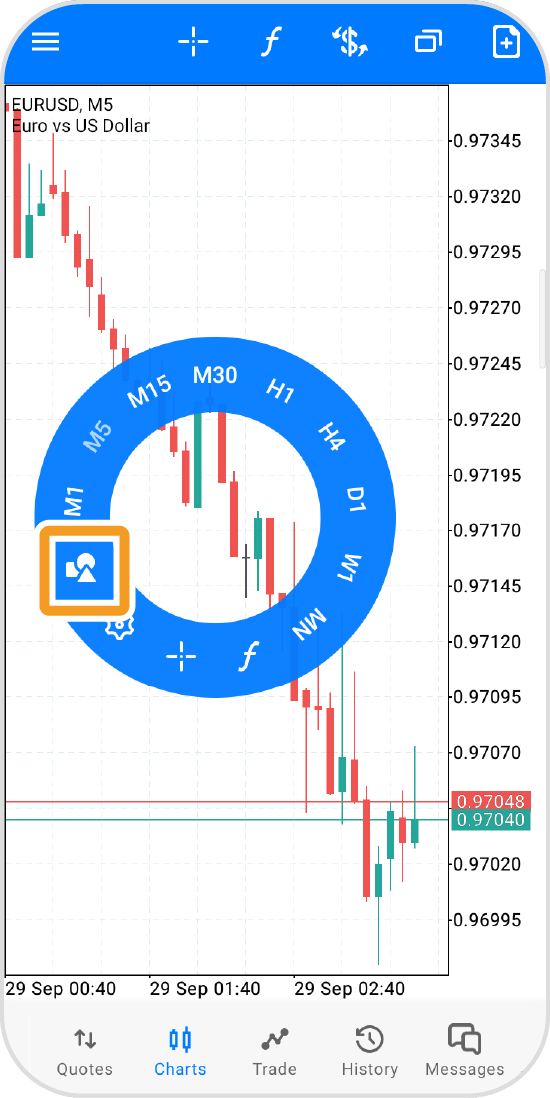
Tap on the chart.
Tap the "Objects" icon.
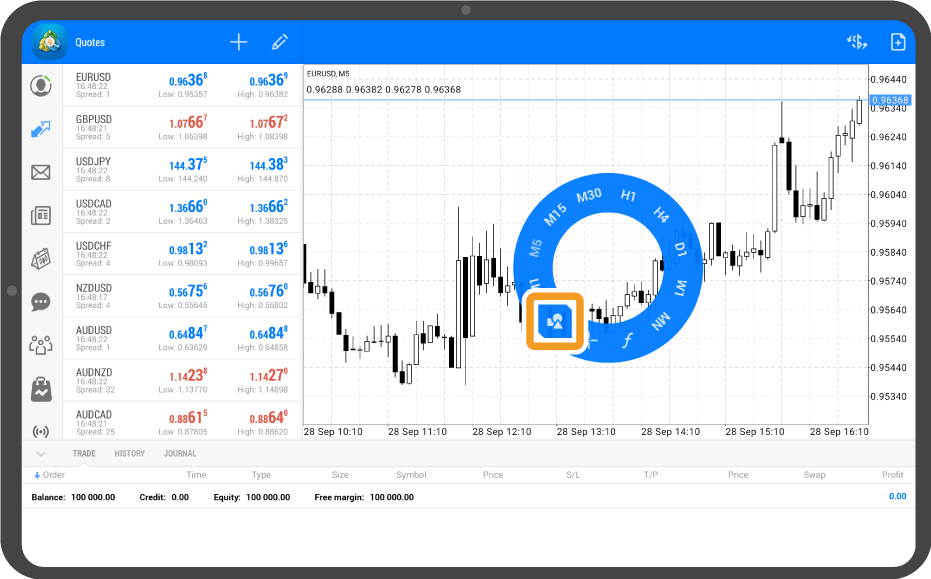
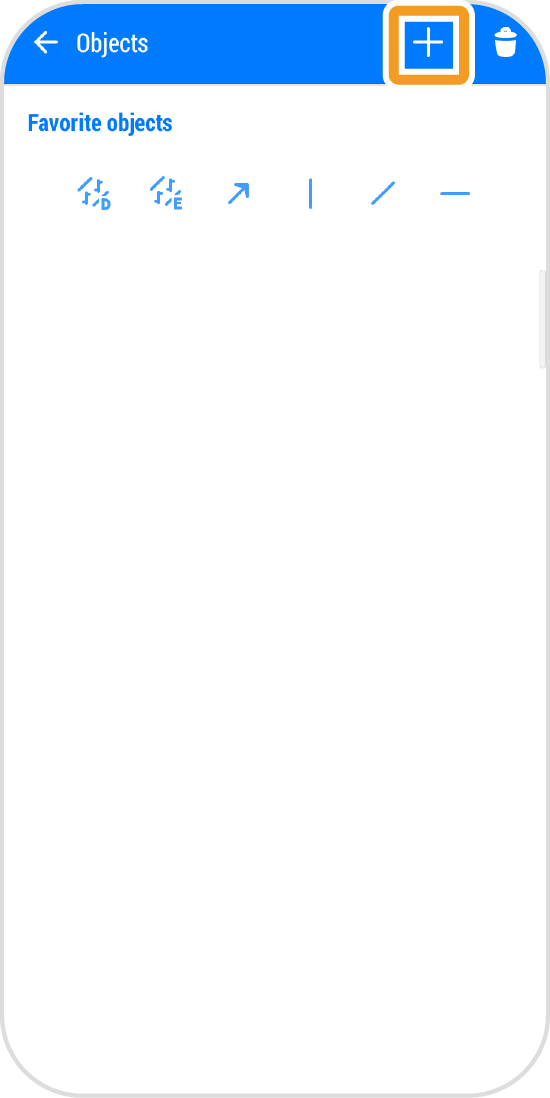
Tap the "+" icon at the top.
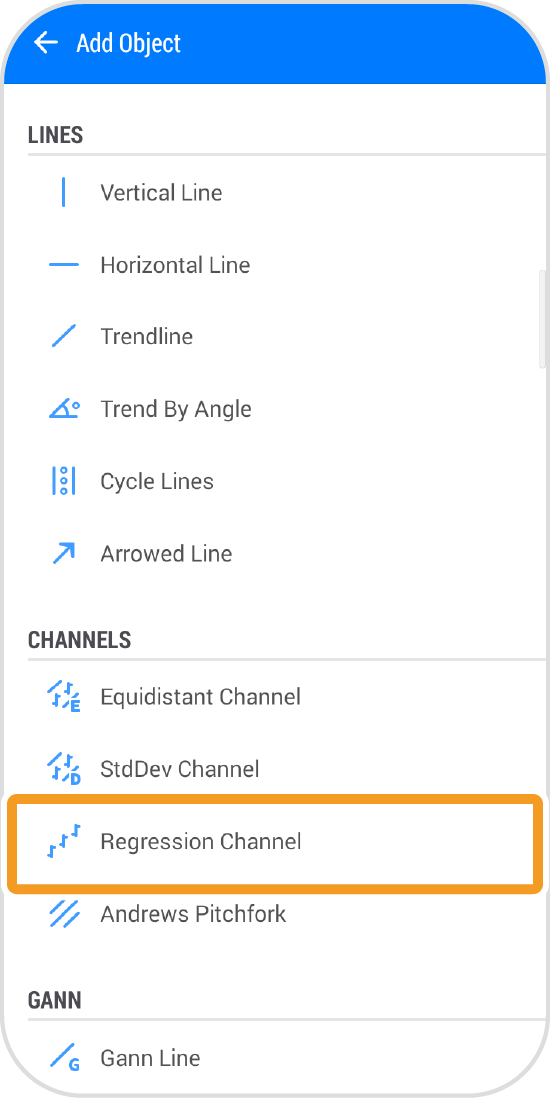
Tap "Regression Channel".
Tap at the starting point and drag to the end point.
To fix the regression channel, tap on the line to hide the dots.
Tap the "Objects" icon on the left.
Tap "Add Object".
Tap "Regression Channel".
Tap the starting point of the regression channel and drag to the endpoint.
In the menu that appears after swiping, you can also change the line's color, thickness, and style.
To fix the regression channel, tap around the line with three red dots to hide them.
Tap on the chart.
Tap the "Objects" icon.
Tap the "+" icon at the top.
Tap "Regression Channel".
Tap at the starting point and drag to the end point.
To fix the regression channel, tap on the line to hide the dots.
Was this article helpful?
0 out of 0 people found this article helpful.
Thank you for your feedback.