


MT4/MT5: Add moving average to chart
EA, indicators & objects (PC)
EA, indicators & objects (PC)

This article was :
published
updated
In MetaTrader 4 (MT4) and MetaTrader 5 (MT5), you can display the Moving Average (MA), one of the most commonly used technical indicators. There are several types of MAs, including the Simple Moving Average (SMA), as wel as the Exponential Moving Average (EMA), which places more emphasis on recent prices.
Here we will look at how to add MA to charts on MT4/MT5.
Switch between MT4/MT5 tabs to check the steps for each.
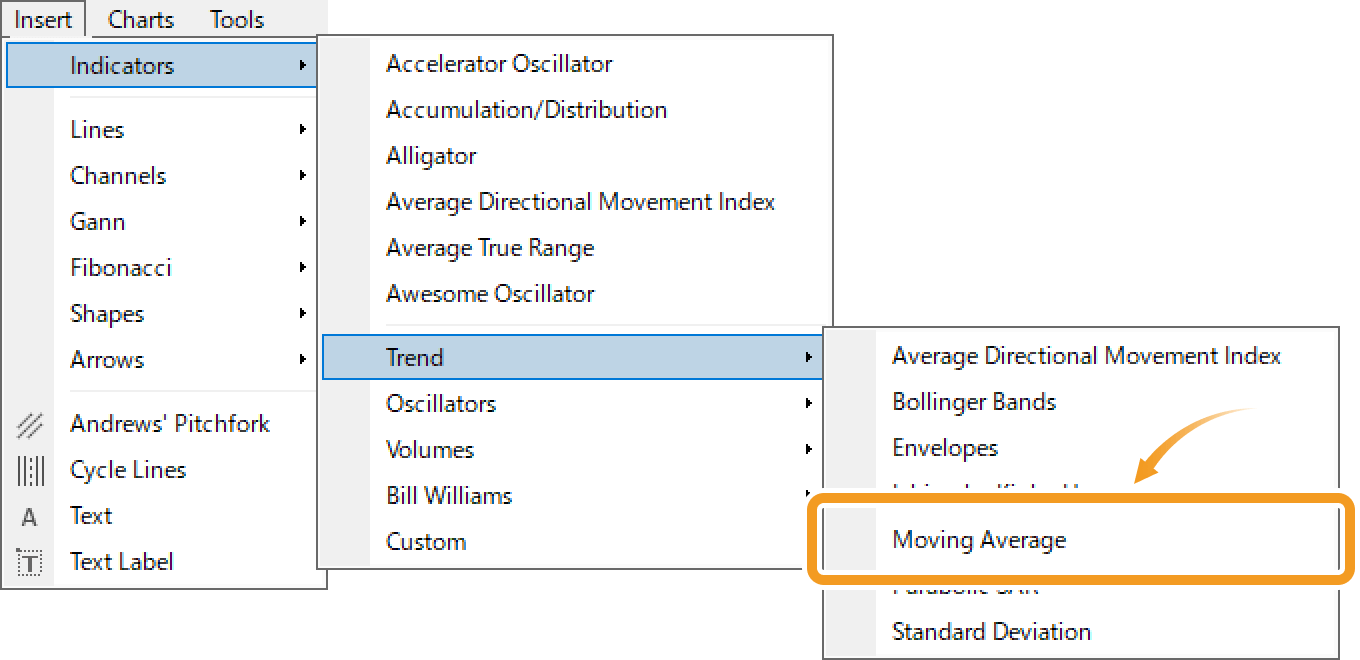
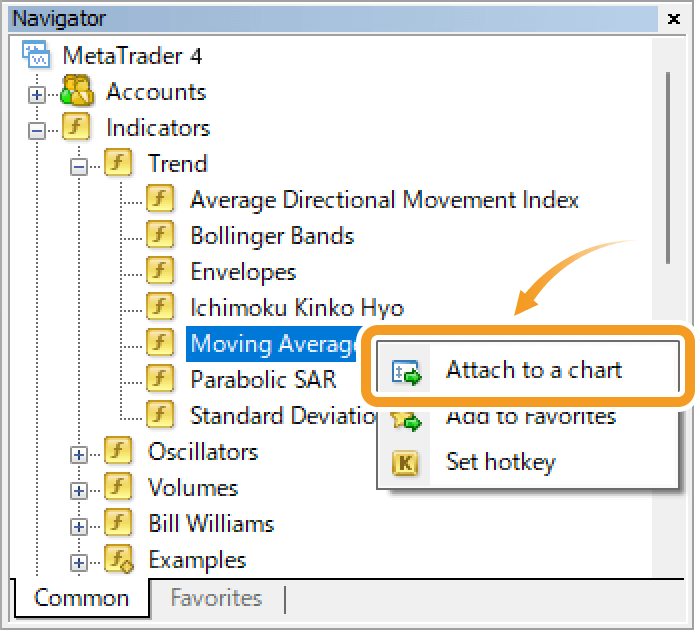
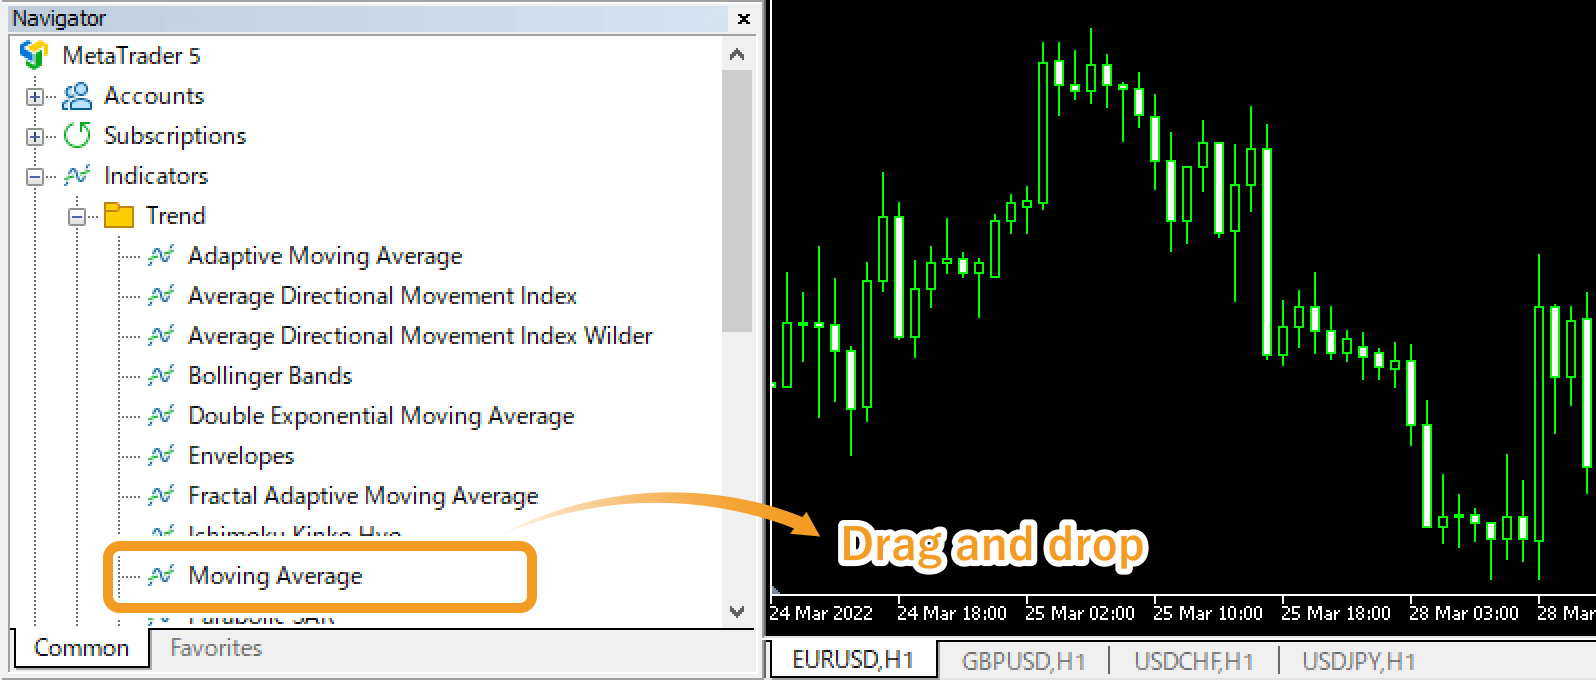
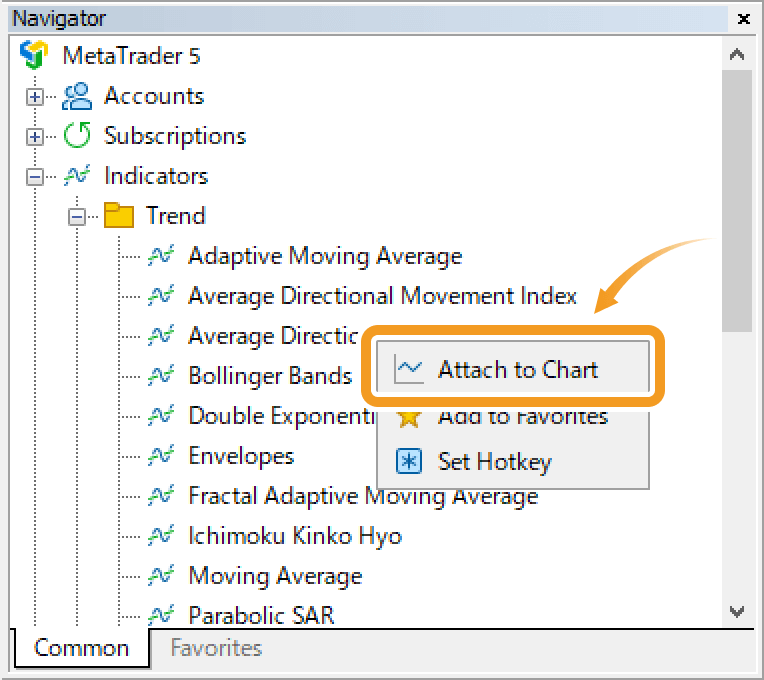
You can add MA from the menu and the Navigator.
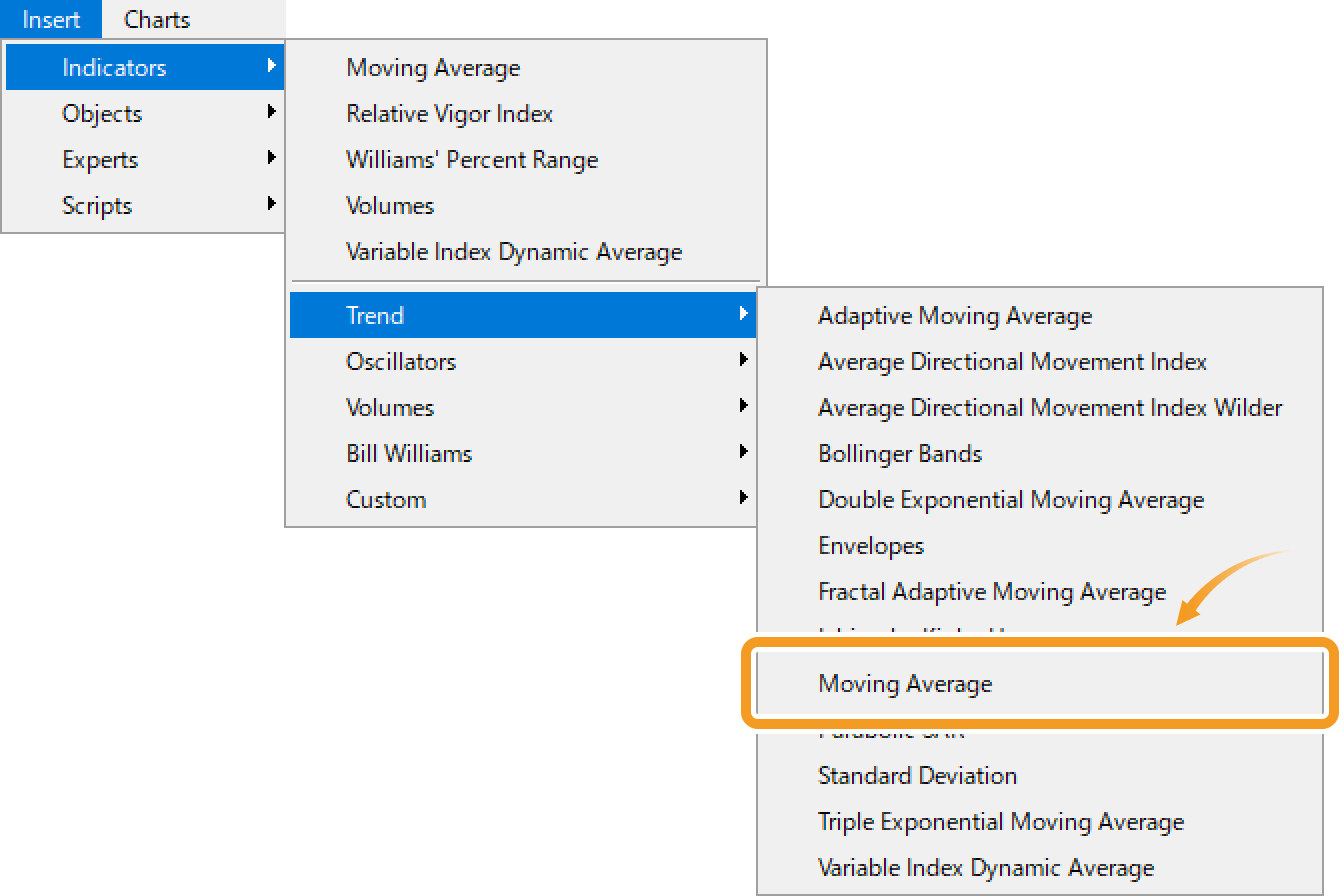
Click "Insert" in the menu. Hover the pointer over "Indicators" > "Trend" and select "Moving Average".
On the Navigator, click on the "+" sign next to "Indicators" and then "Trend". Select "Moving Average" and drag it onto the chart you wish to apply it to.
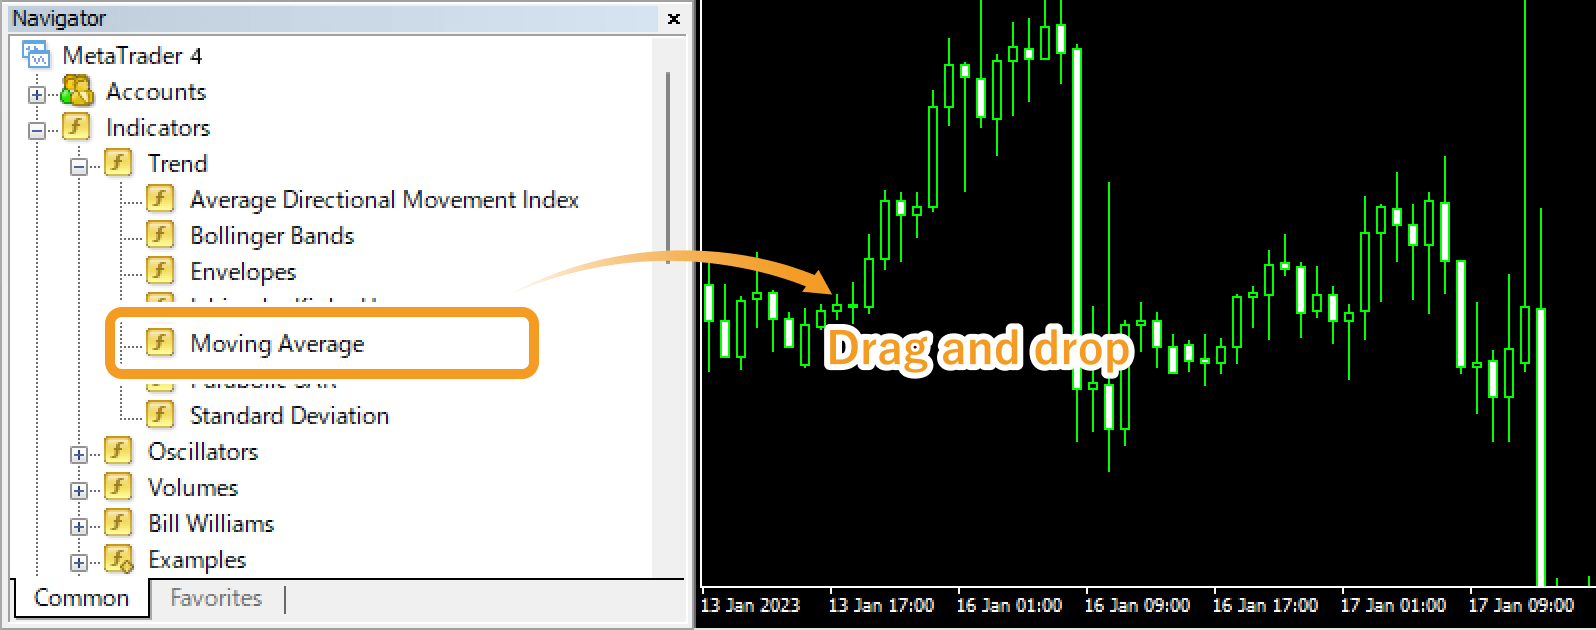
Or, right-click on "Moving Average" and select "Attach to a chart".
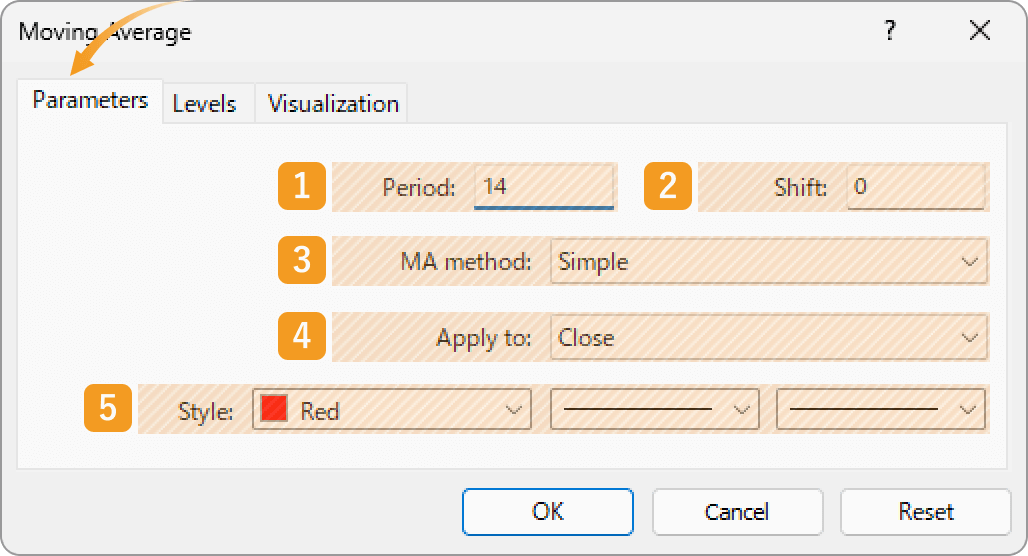
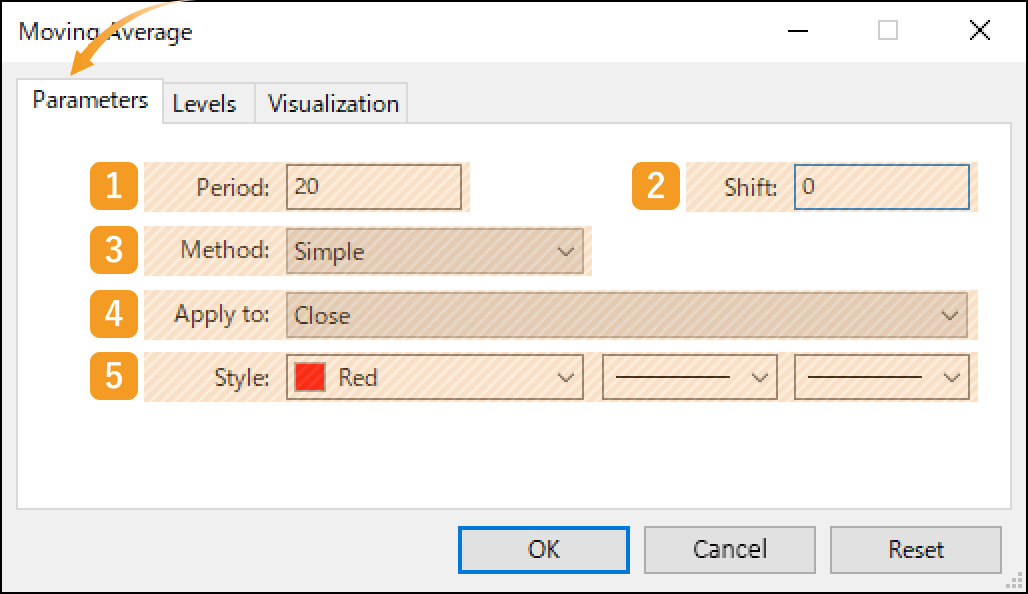
The setting window for MA will appear. Set the parameters in the "Parameters", "Levels", and "Visualization" tab and click "OK".
|
Number |
Item name |
Descriptions |
|---|---|---|
|
1 |
Period |
Set the period for the MA. The unit here is the number of candlesticks. If you select the daily chart and set it to "20", the MA for the past 20 days will be generated. |
|
2 |
Shift |
You can shift the placement of the MA to the left or right. The unit is the number of candles. Type a positive value to move it to the right, and a negative value to move it to the left. |
|
3 |
MA method |
Select the type of moving average to display. Simple: simple moving average (SMA) Exponential: exponential moving average (EMA) Smoothed: smoothed moving average (SMMA) Linear Weighted: linear weighted moving average (LWMA) |
|
4 |
Apply to |
Price to use for calculating MA. Close: close price Open: open price High: high price Low: low price Median Price (HL/2): (high price + low price) ÷2 Typical Price (HLC/3): (high price + low price + close price) ÷3 Weighted Close (HLCC/4): (high price + low price + close price×2) ÷4 Previous Indicator's Data: the value of the indicator displayed last First Indicator's Data: the value of the indicator displayed first |
|
5 |
Style |
Set the color, line type, and line thickness for MA. |
Granville, famous for "Granville's Law," categorized the correlations between price movements and the 200-day MA into 8 different patterns. This approach, which popularized the use of the 200-day MA on daily charts, laid the foundation for the widespread use of moving averages.
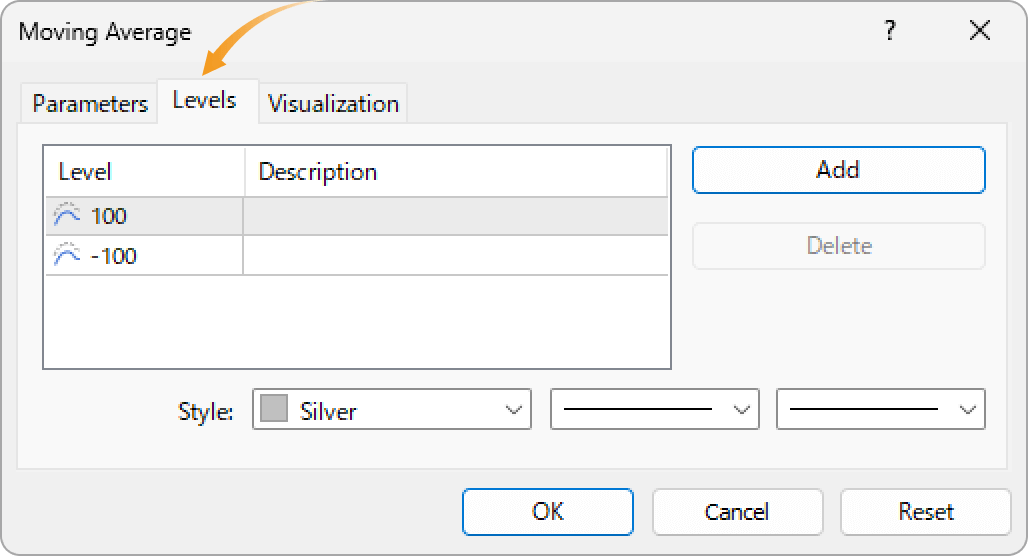
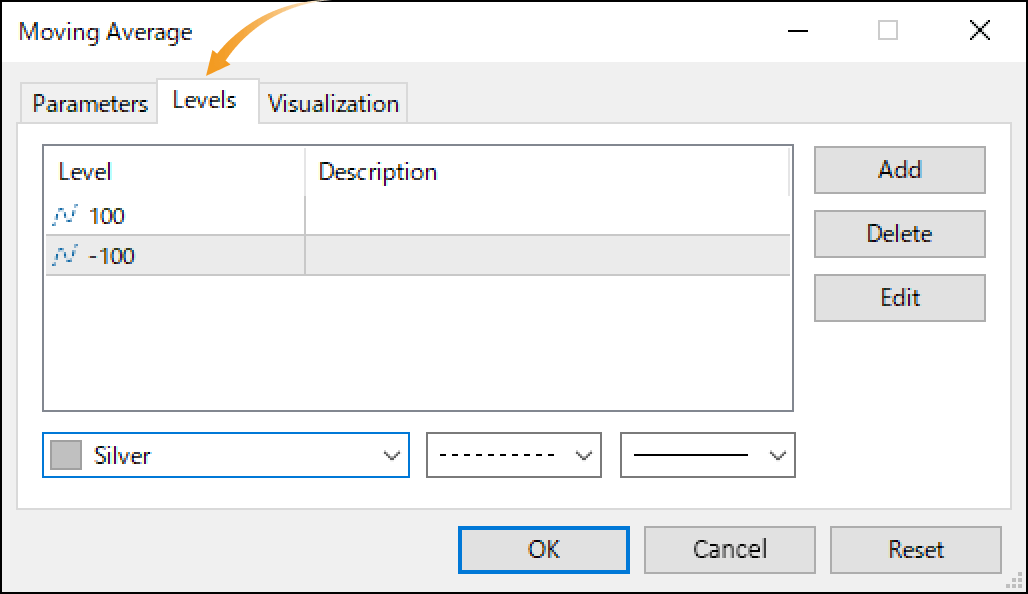
Go to the "Levels" tab and click "Add". Enter a positive number (unit: points) to show a new MA on top, and a negative number to show a new MA on the bottom of the current MA.
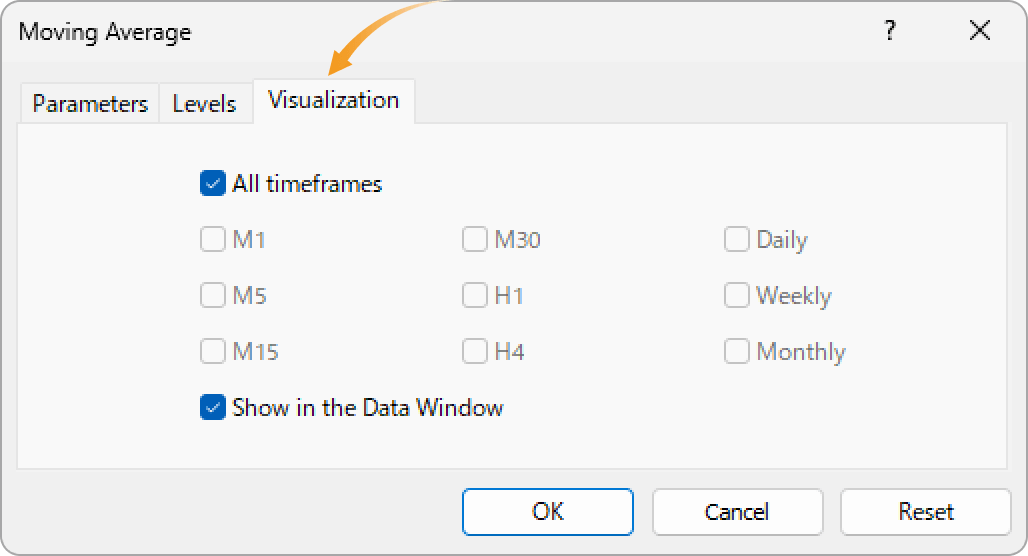
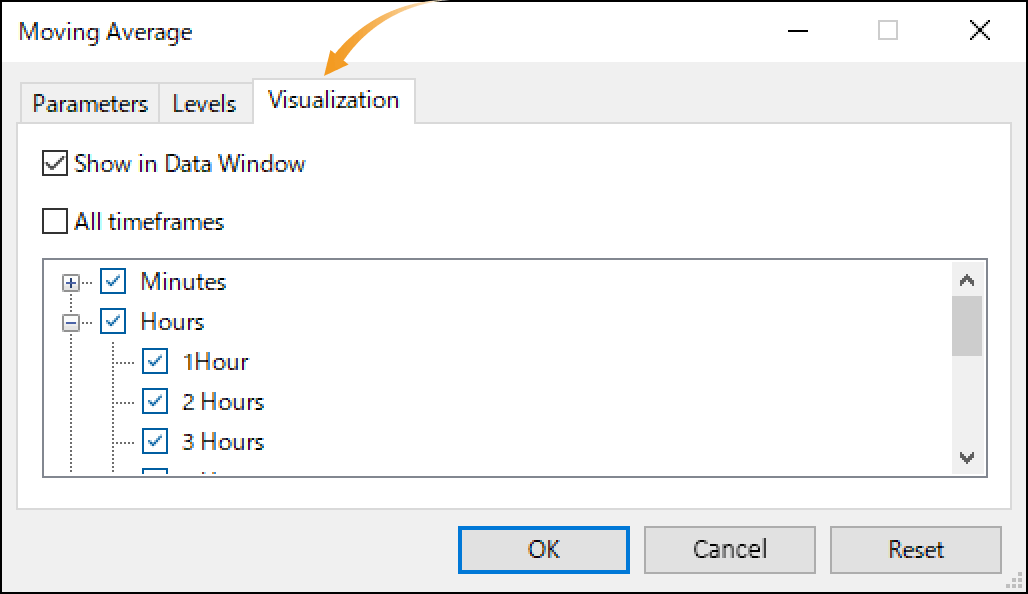
On the "Visualization" tab, you can show/hide MA in the Data Window and specify the timeframes to use MA with.
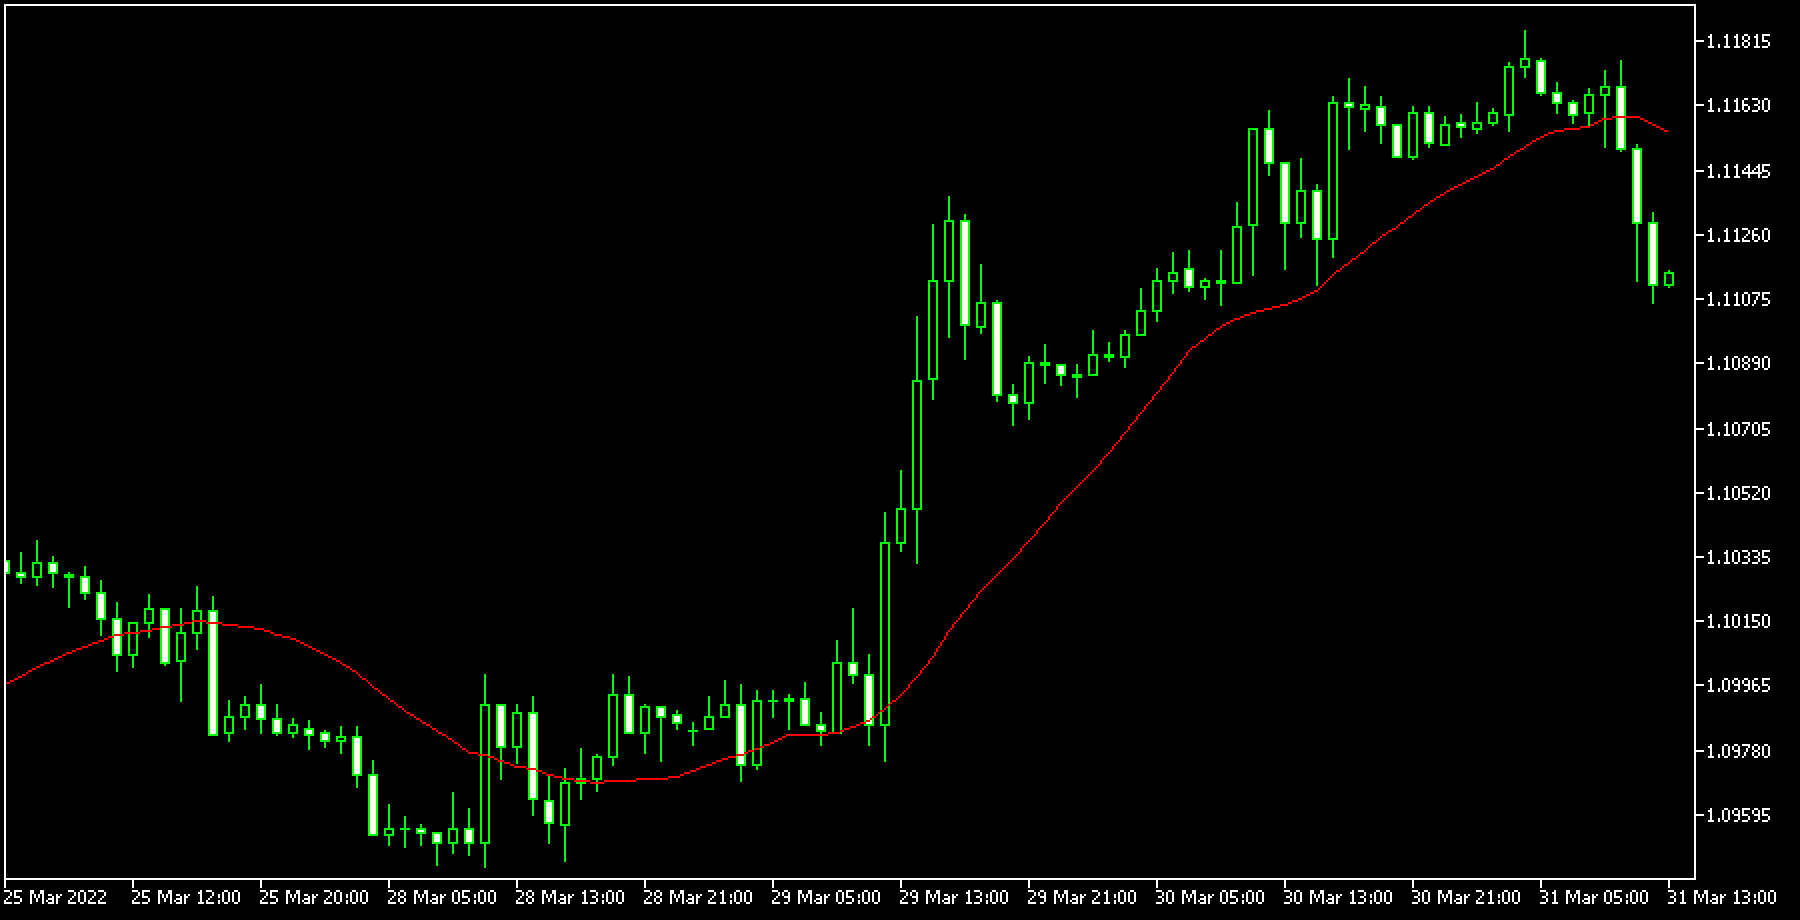
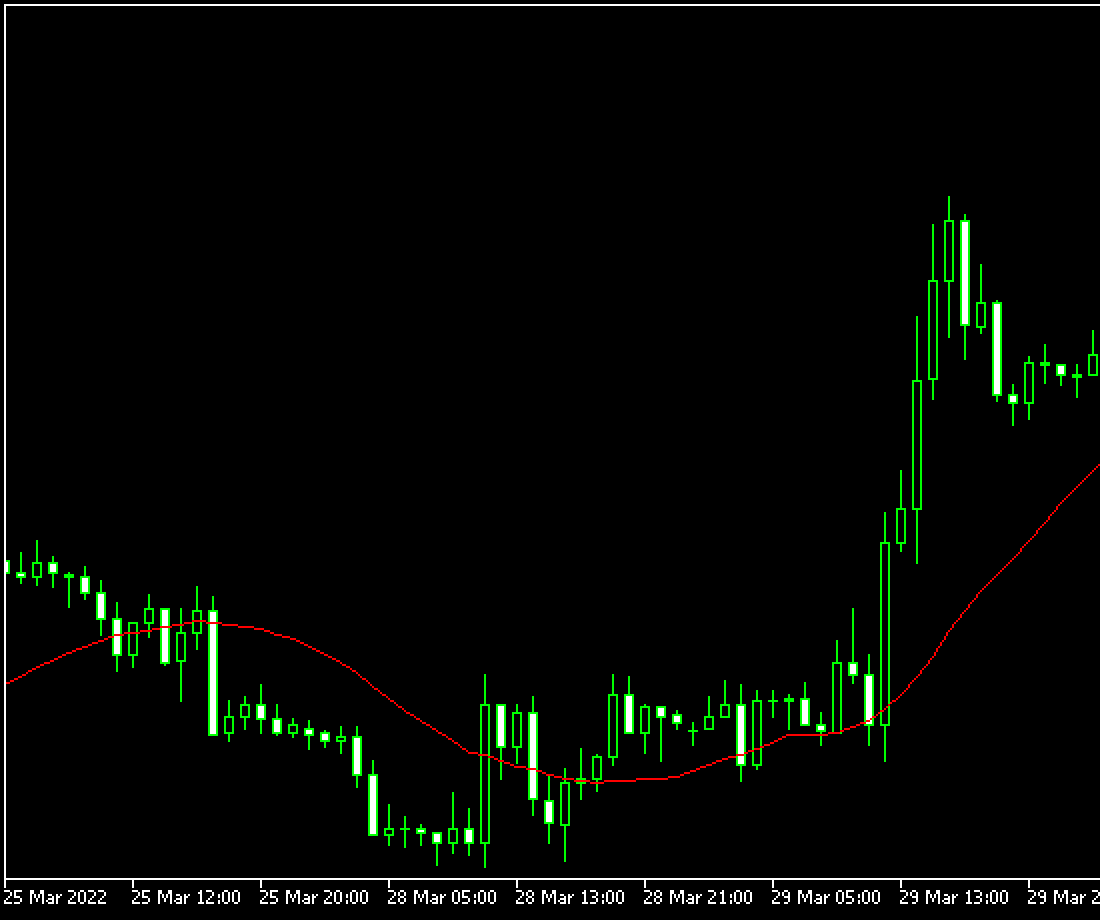
MA will be displayed on the chart.
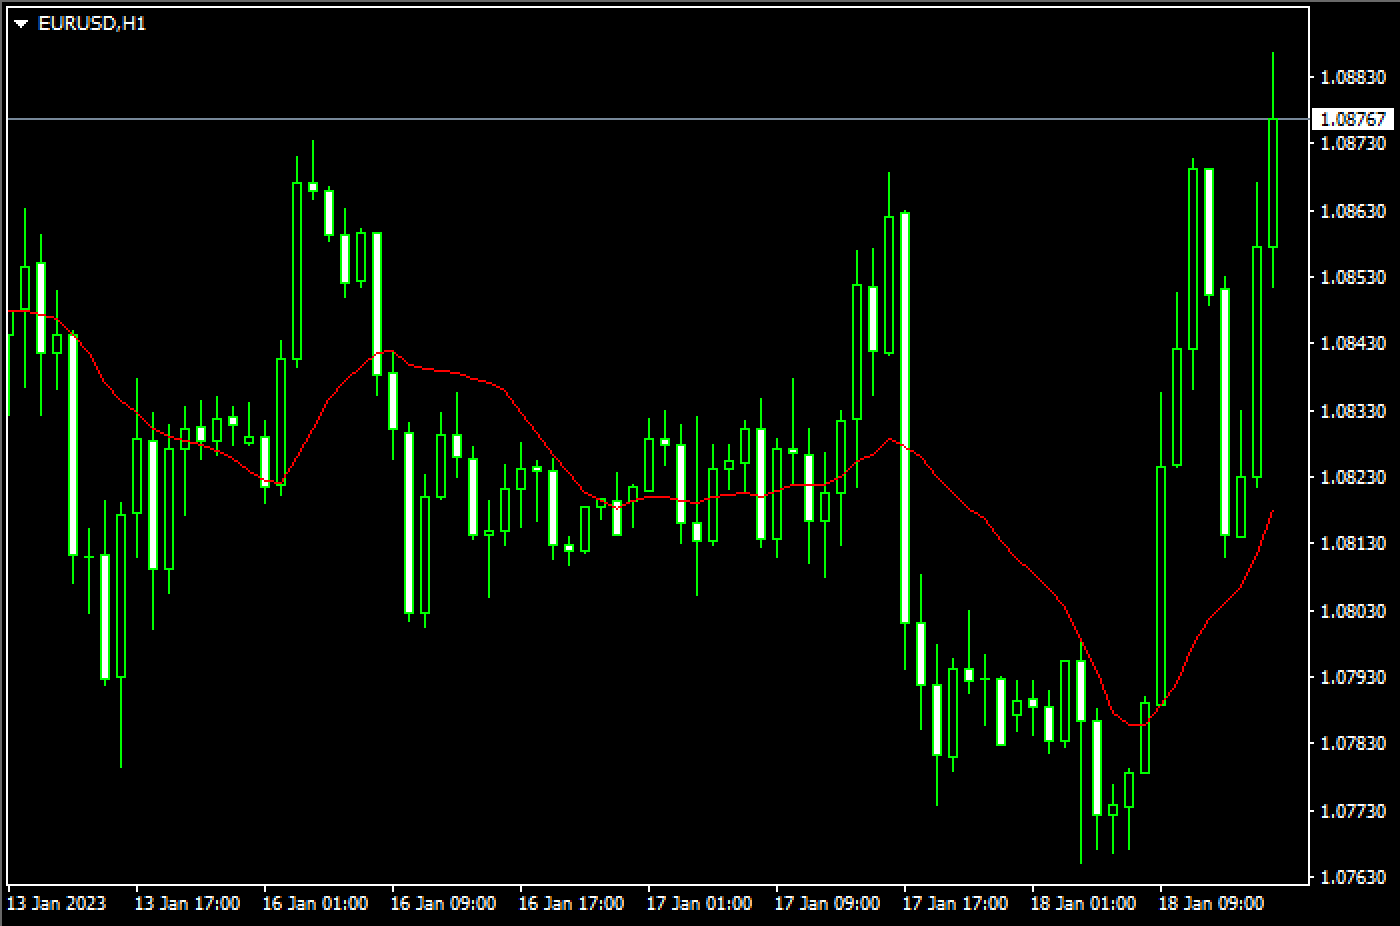
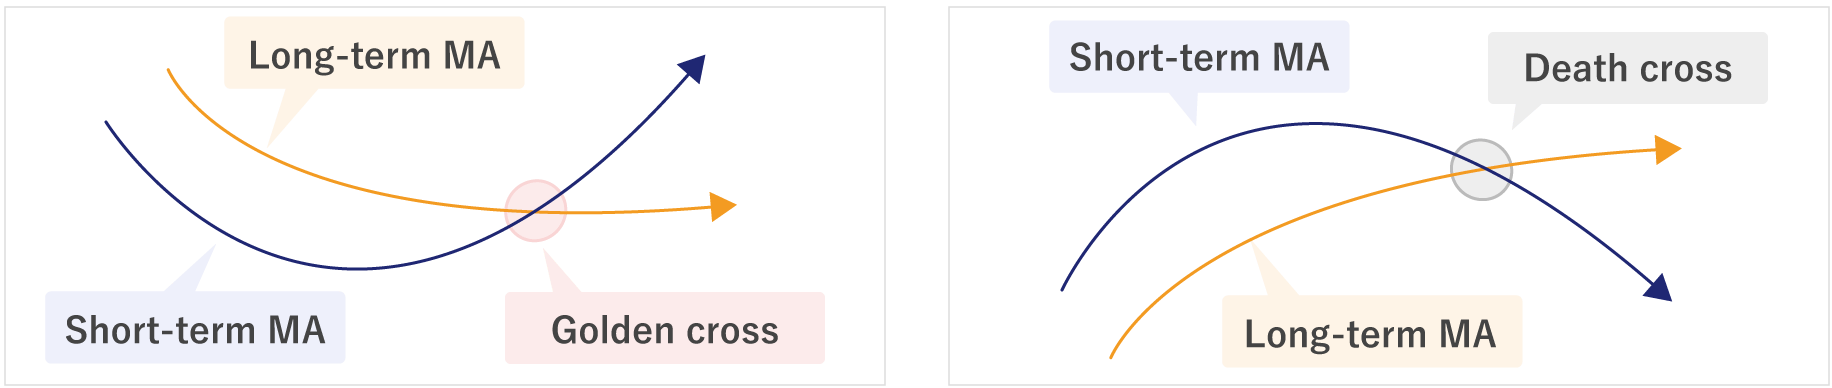
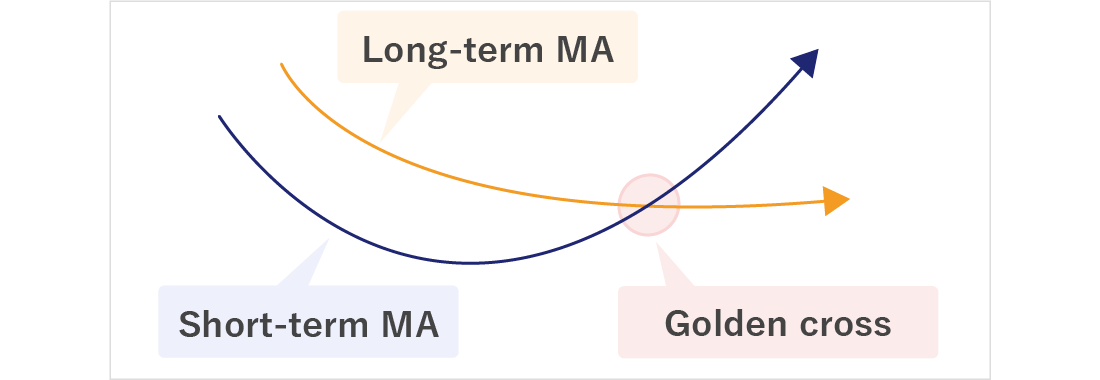
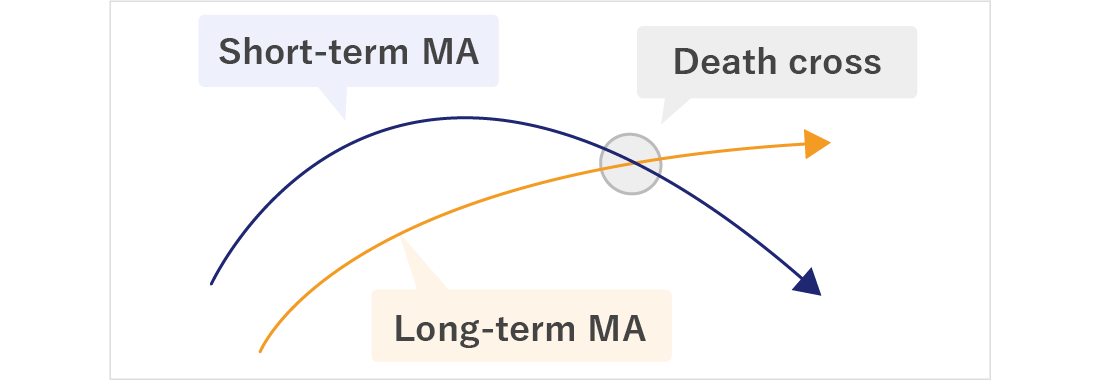
MA is classified into short/medium/long term and they're often used together. When the short-term MA crosses the long-term MA from the bottom up, it's called the "golden cross" which indicates a bull market. And when the short-term MA crosses the long-term MA from top to bottom, it's referred to as the "death cross", which indicates a bear market.


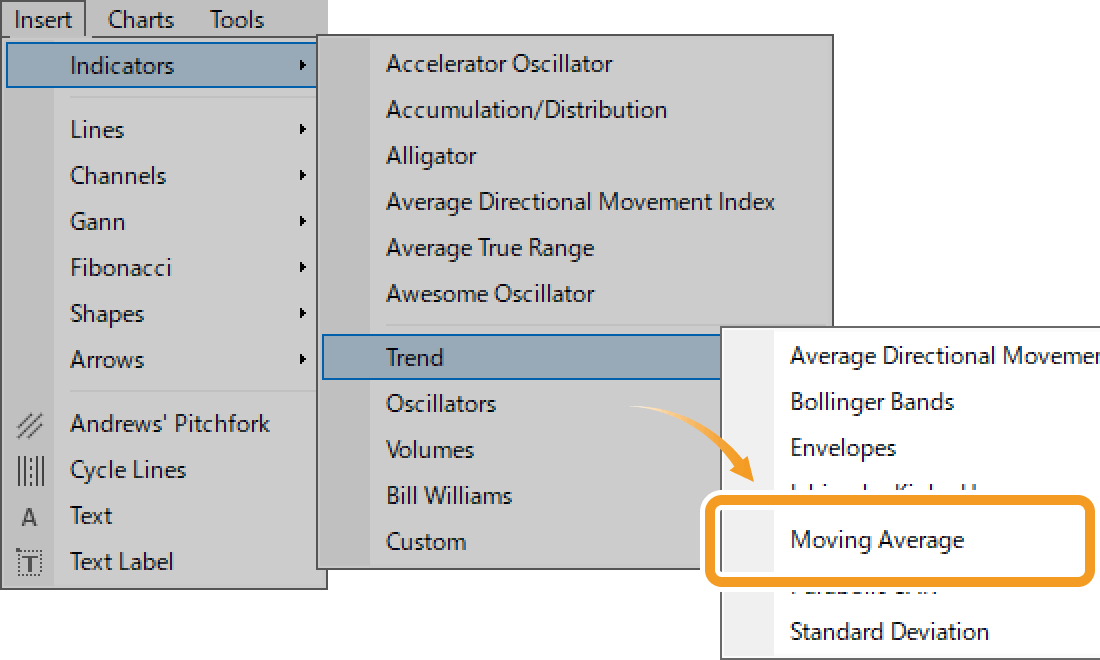
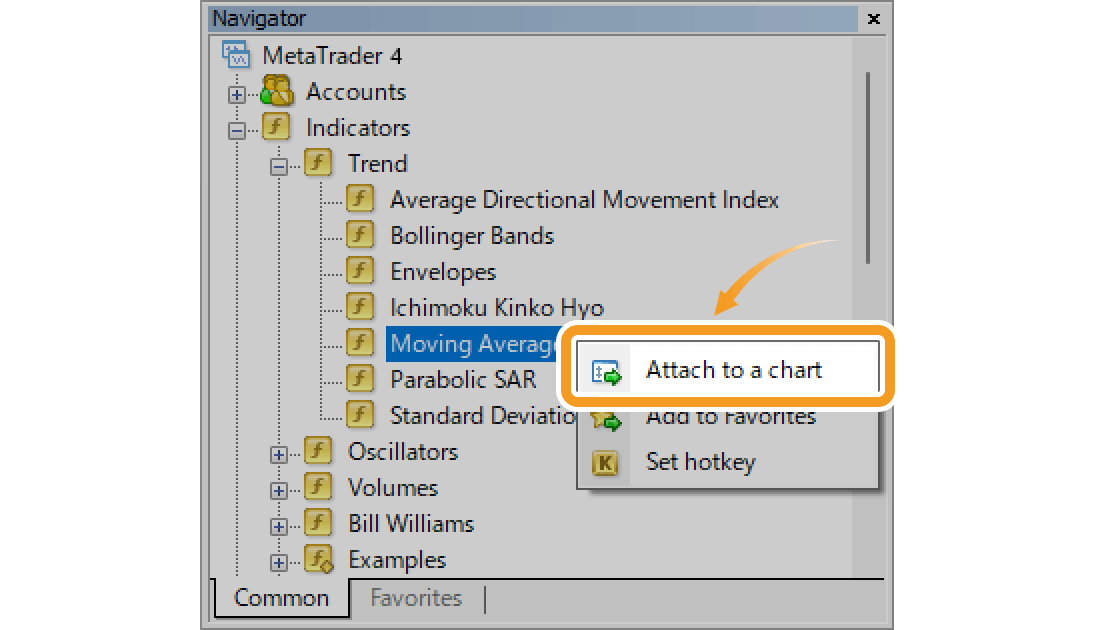
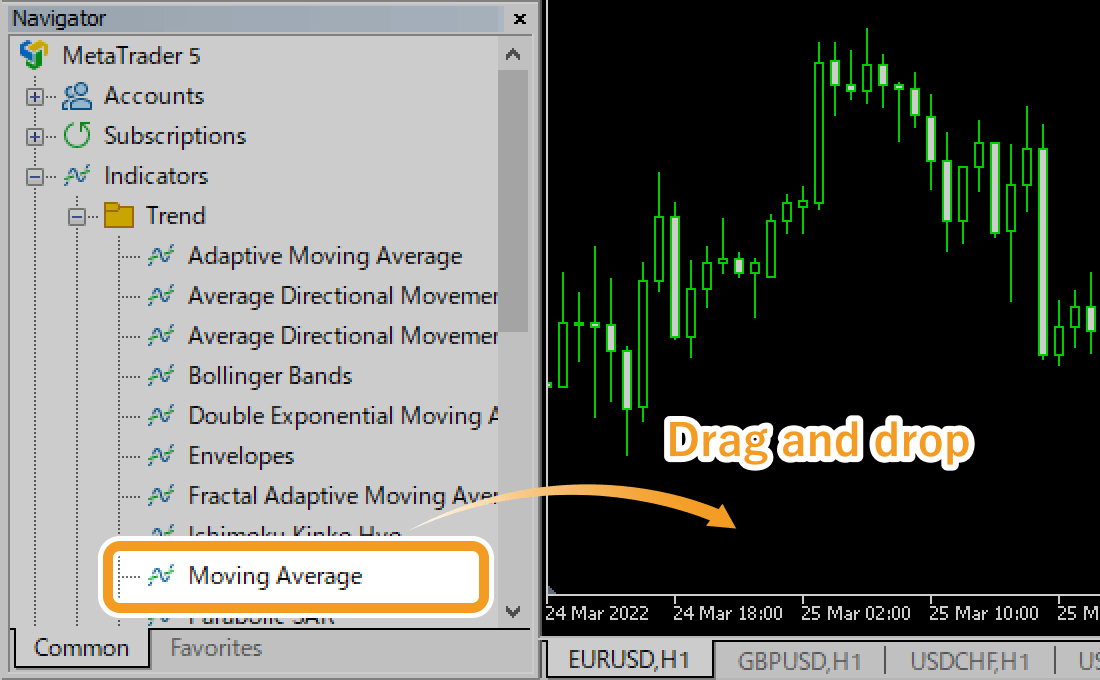
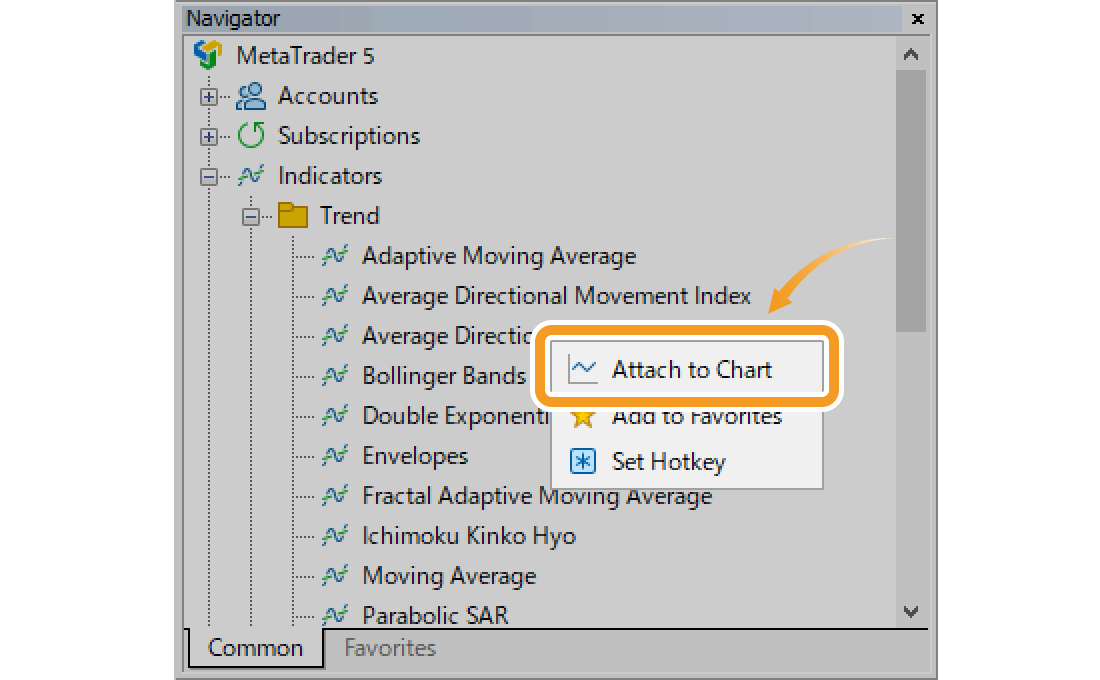
You can add MA from the menu and the Navigator.
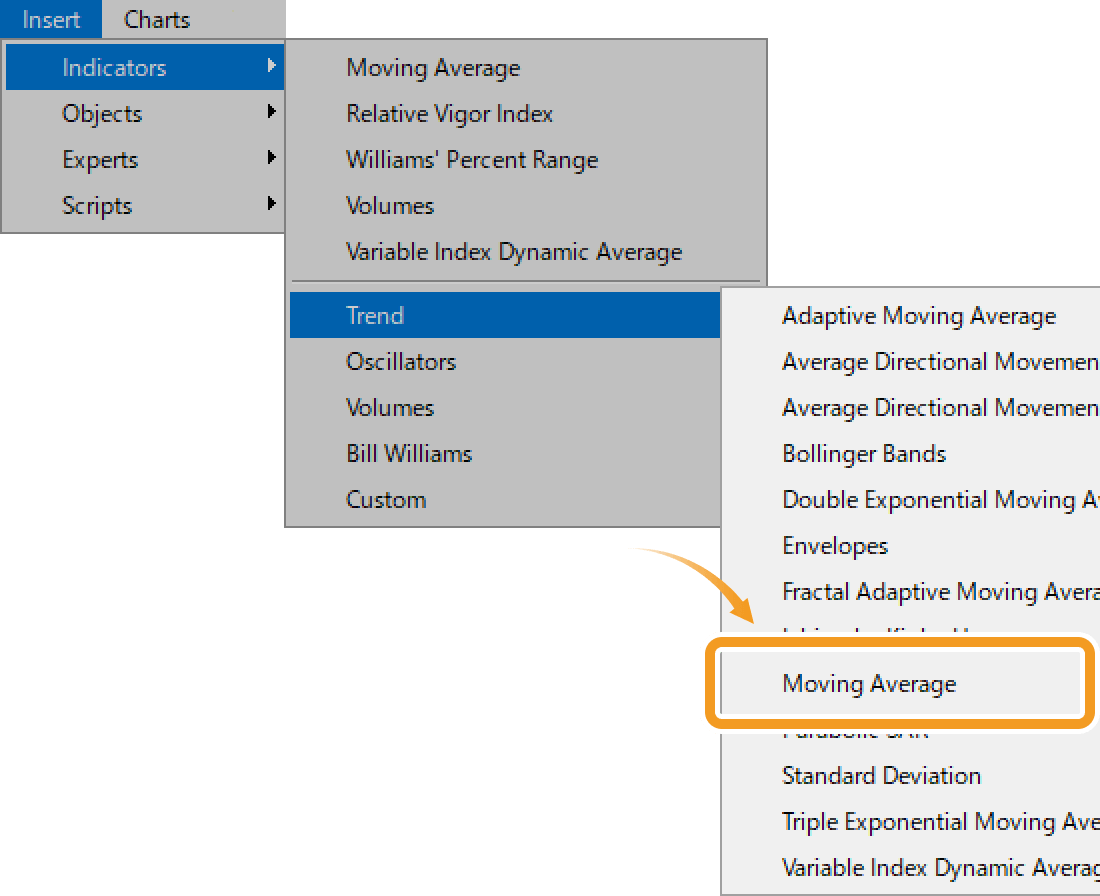
Click "Insert" in the menu. Hover the pointer over "Indicators" > "Trend" and select "Moving Average".
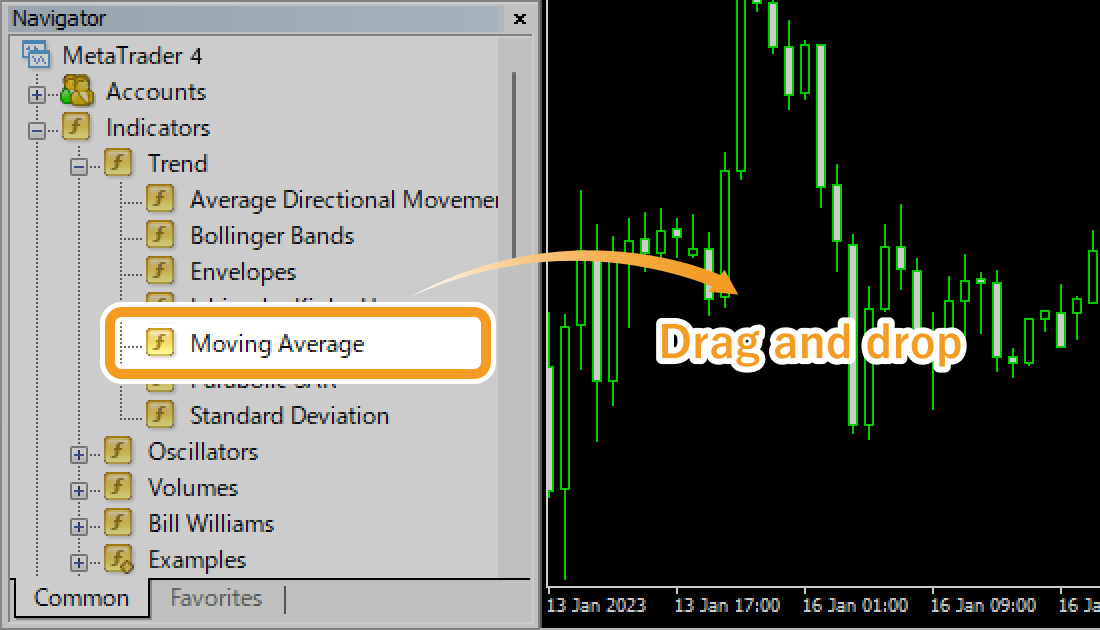
On the Navigator, go to "Indicators" and click on the "+" sign next to "Trend". Select "Moving Average" and drag it onto the chart you wish to apply it to.
Or, right-click on "Moving Average" and select "Attach to Chart".
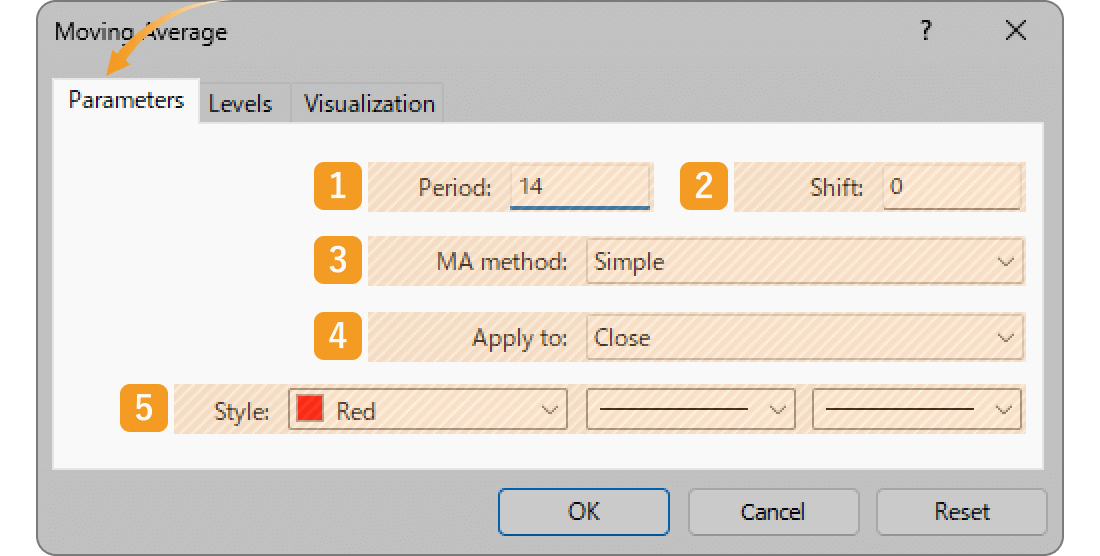
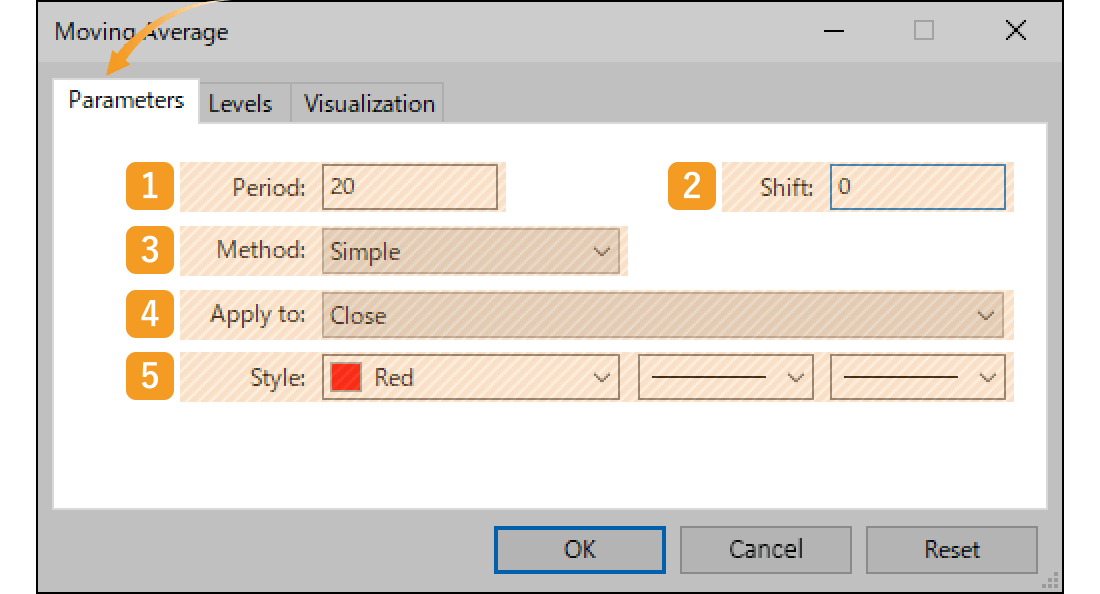
The setting window for MA will appear. Set the parameters in the "Parameters", "Levels", and "Visualization" tab and click "OK".
|
Number |
Item name |
Descriptions |
|---|---|---|
|
1 |
Period |
Set the period for the MA. The unit here is the number of candlesticks. If you select the daily chart and set it to "20", the MA for the past 20 days will be generated. |
|
2 |
Shift |
You can shift the placement of the MA to the left or right. The unit is the number of candles. Type a positive value to move it to the right, and a negative value to move it to the left. |
|
3 |
Method |
Select the type of moving average to display. Simple: simple moving average (SMA) Exponential: exponential moving average (EMA) Smoothed: smoothed moving average (SMMA) Linear Weighted: linear weighted moving average (LWMA) |
|
4 |
Apply to |
Price to use for calculating MA. Close: close price Open: open price High: high price Low: low price Median Price (HL/2): (high price + low price) ÷2 Typical Price (HLC/3): (high price + low price + close price) ÷3 Weighted Close (HLCC/4): (high price + low price + close price×2) ÷4 Previous Indicator's Data: the value of the indicator displayed last First Indicator's Data: the value of the indicator displayed first |
|
5 |
Style |
Set the color, line type, and line thickness for MA. |
Granville, famous for "Granville's Law," categorized the correlations between price movements and the 200-day MA into 8 different patterns. This approach, which popularized the use of the 200-day MA on daily charts, laid the foundation for the widespread use of moving averages.
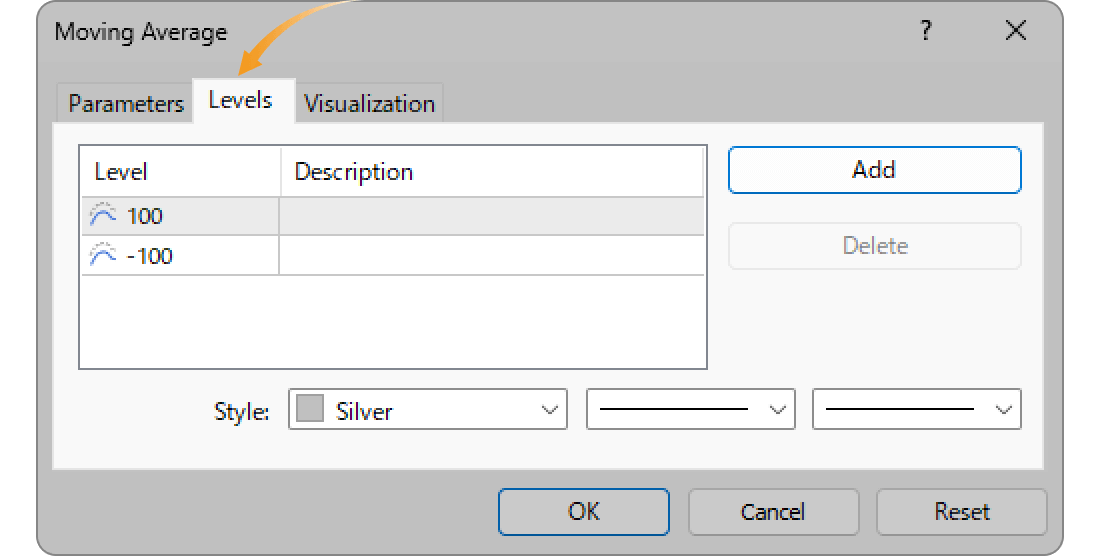
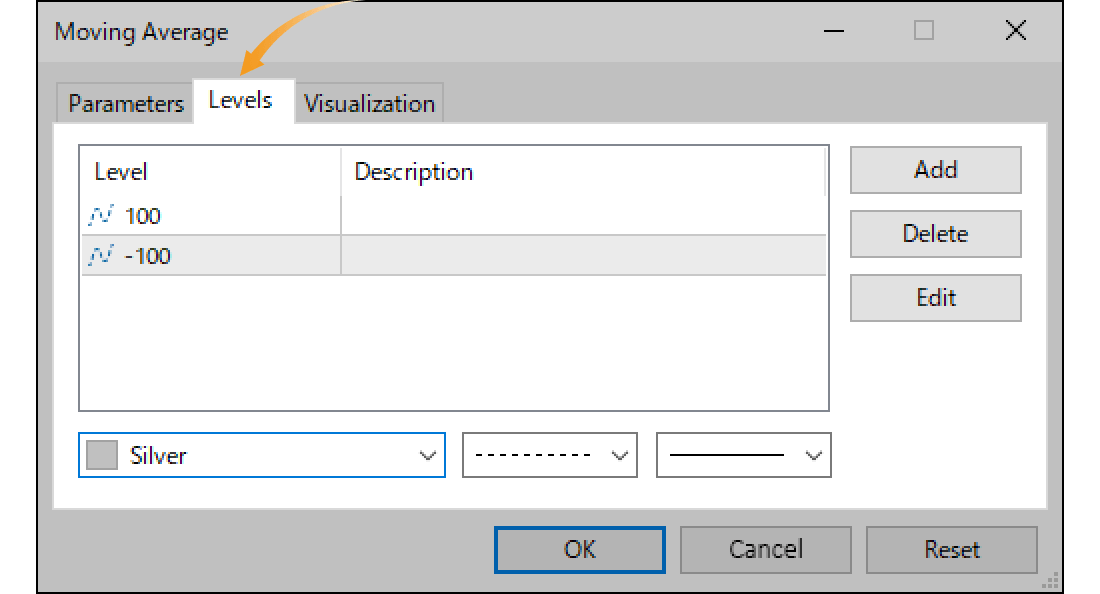
Go to the "Levels" tab and click "Add". Enter a positive number (unit: points) to show a new MA on top, and a negative number to show a new MA on the bottom of the current MA.
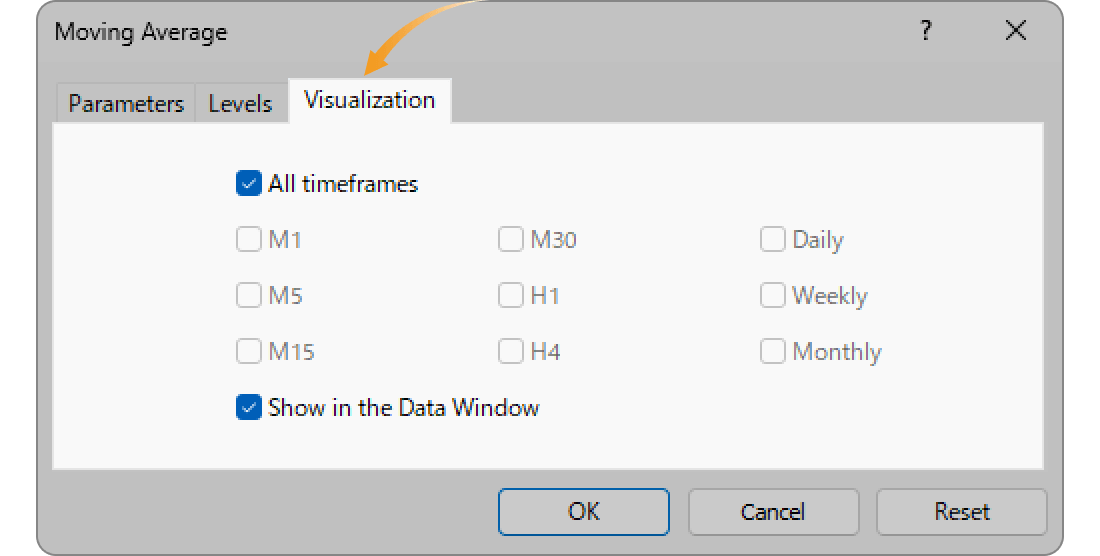
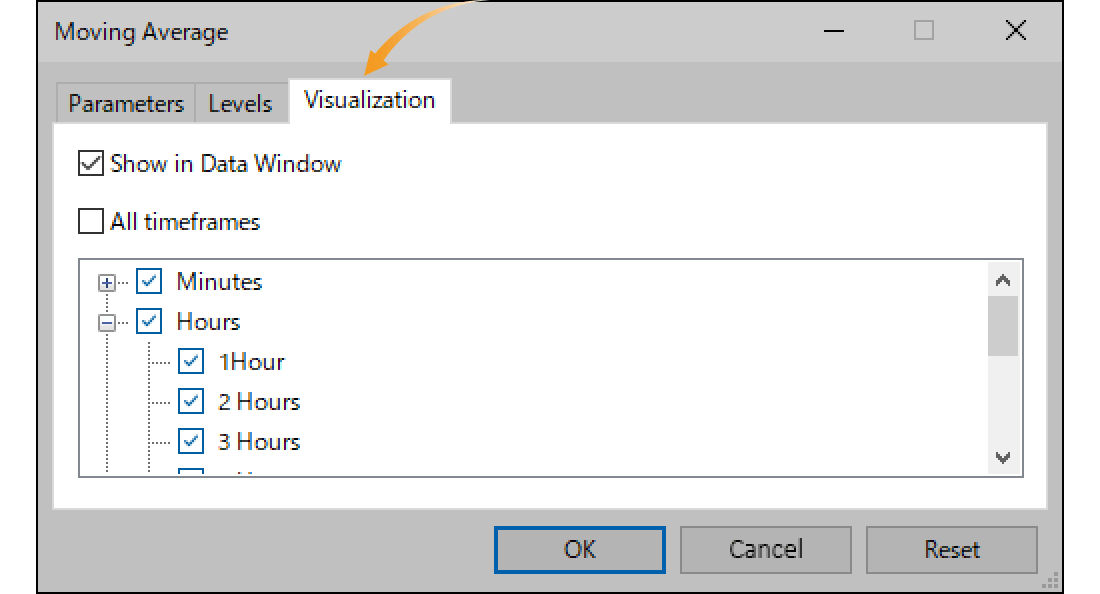
On the "Visualization" tab, you can show/hide MA in the Data Window and specify the timeframes to use MA with.
MA will be displayed on the chart.
MA is classified into short/medium/long term and they're often used together. When the short-term MA crosses the long-term MA from the bottom up, it's called the "golden cross" which indicates a bull market. And when the short-term MA crosses the long-term MA from top to bottom, it's referred to as the "death cross", which indicates a bear market.
Was this article helpful?
0 out of 0 people found this article helpful.
Thank you for your feedback.