Draw equidistant channel
EA, indicators & objects (PC)
EA, indicators & objects (PC)
This article was :
published
updated
In MetaTrader 4 (MT4) and MetaTrader 5 (MT5), you can draw an equidistant channel, which consists of a trendline and a parallel line called the channel line. Draw the trendline first, then adjust the channel line accordingly.
Here we'll take a look at how to draw and set up the equidistant channel in MT4/MT5.
Switch between MT4/MT5 tabs to check the steps for each.
The equidistant channel can be drawn from the menu or the Toolbar.
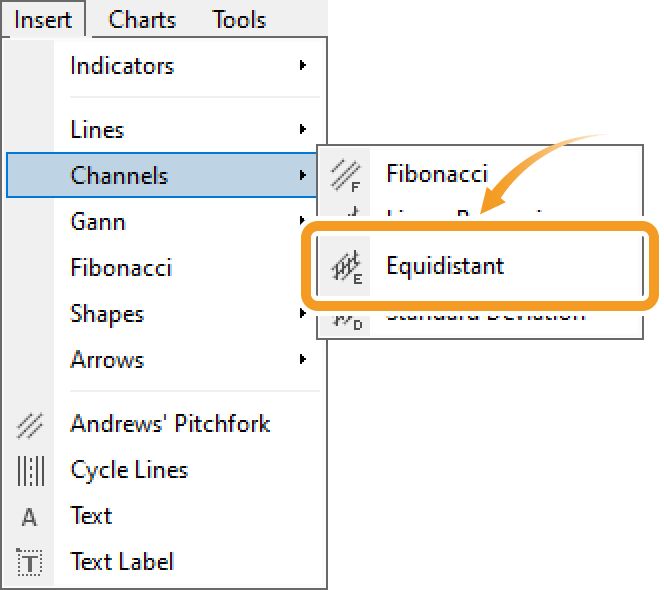
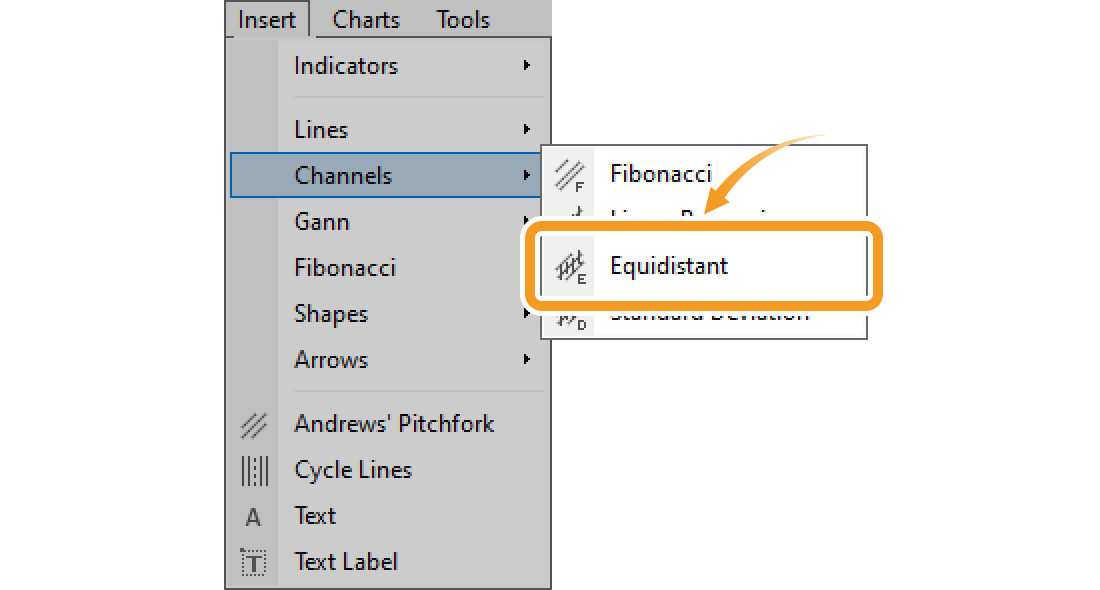
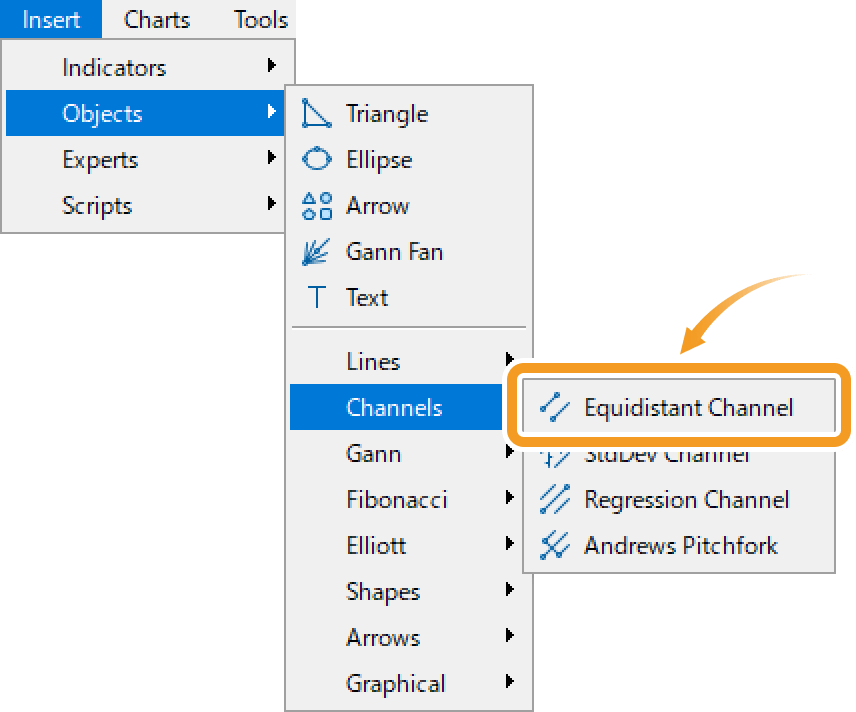
Click "Insert" in the menu. Hover the pointer over "Channels" and select "Equidistant".
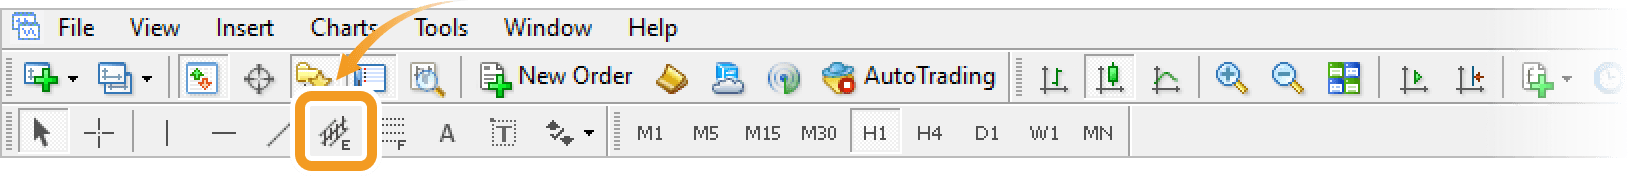
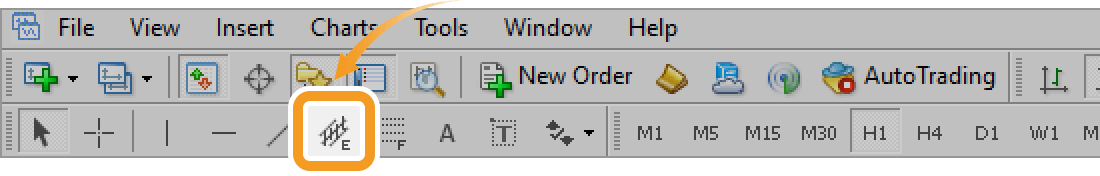
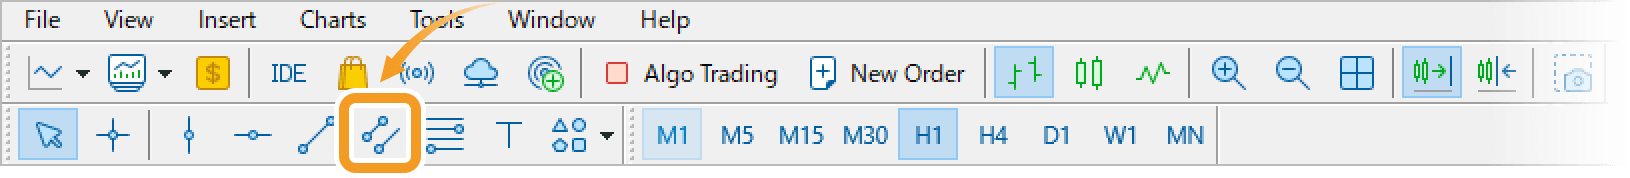
Click the "Draw equidistant channel" button on the toolbar.
In MT4, 5 types of channels are available, including the Andrews' Pitchfork, which is on the "Insert" menu.
Fibonacci channel
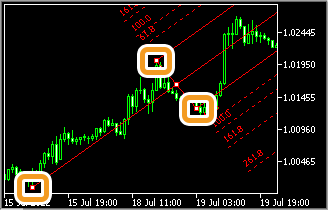
Fibonacci channel uses the trendline and creates parallel channel lines using the Fibonacci ratio.
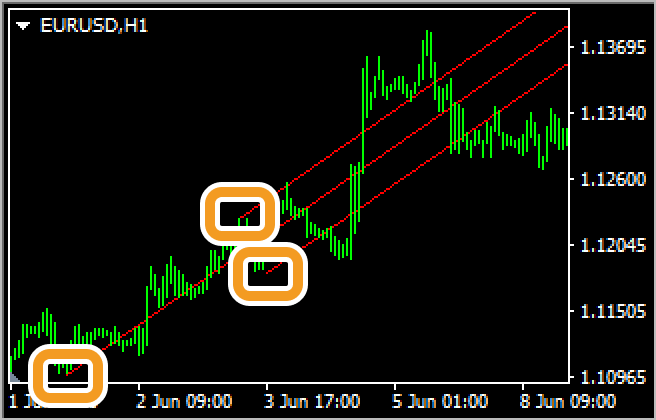
Linear regression
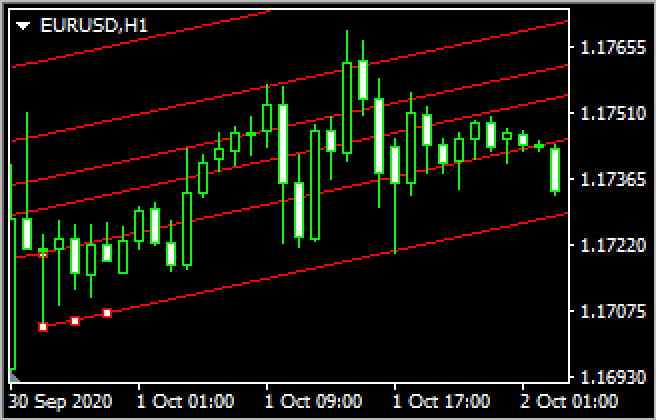
Draws a center line (regression line) using the close price of each candle, and then draws equally spaced two parallel lines above and below it. The parallel lines pass through the close price farthest from the center line.
Equidistant channel
Draws two parallel lines. Each line can be moved separately while keeping them parallel.
Standard deviation
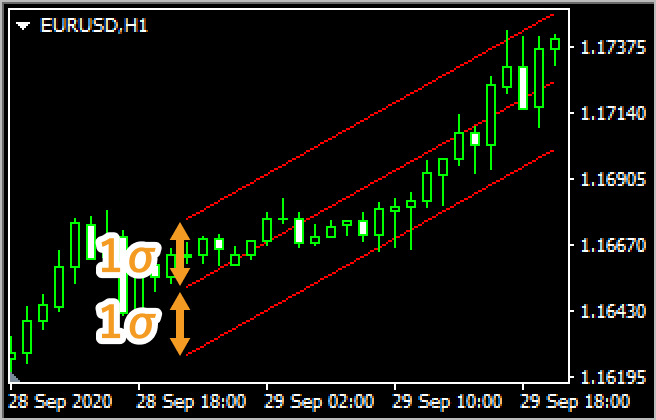
Draws a center line (regression line) using the close price of each candle, and then draws two parallel lines at a distance of standard deviation from the center line.
Andrews' Pitchfork
Three parallel lines are drawn using three points: the starting point of the trend and the high and low just after the trend.
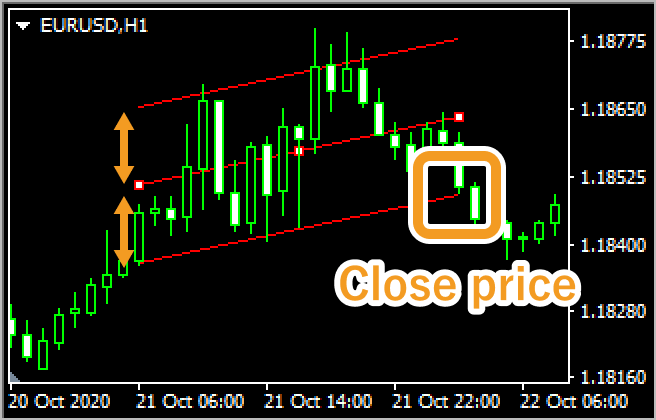
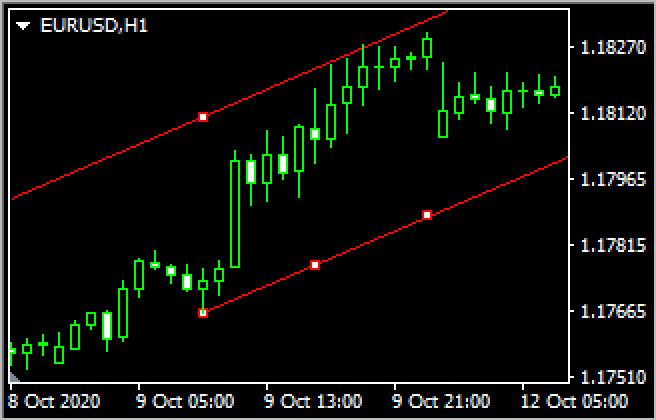
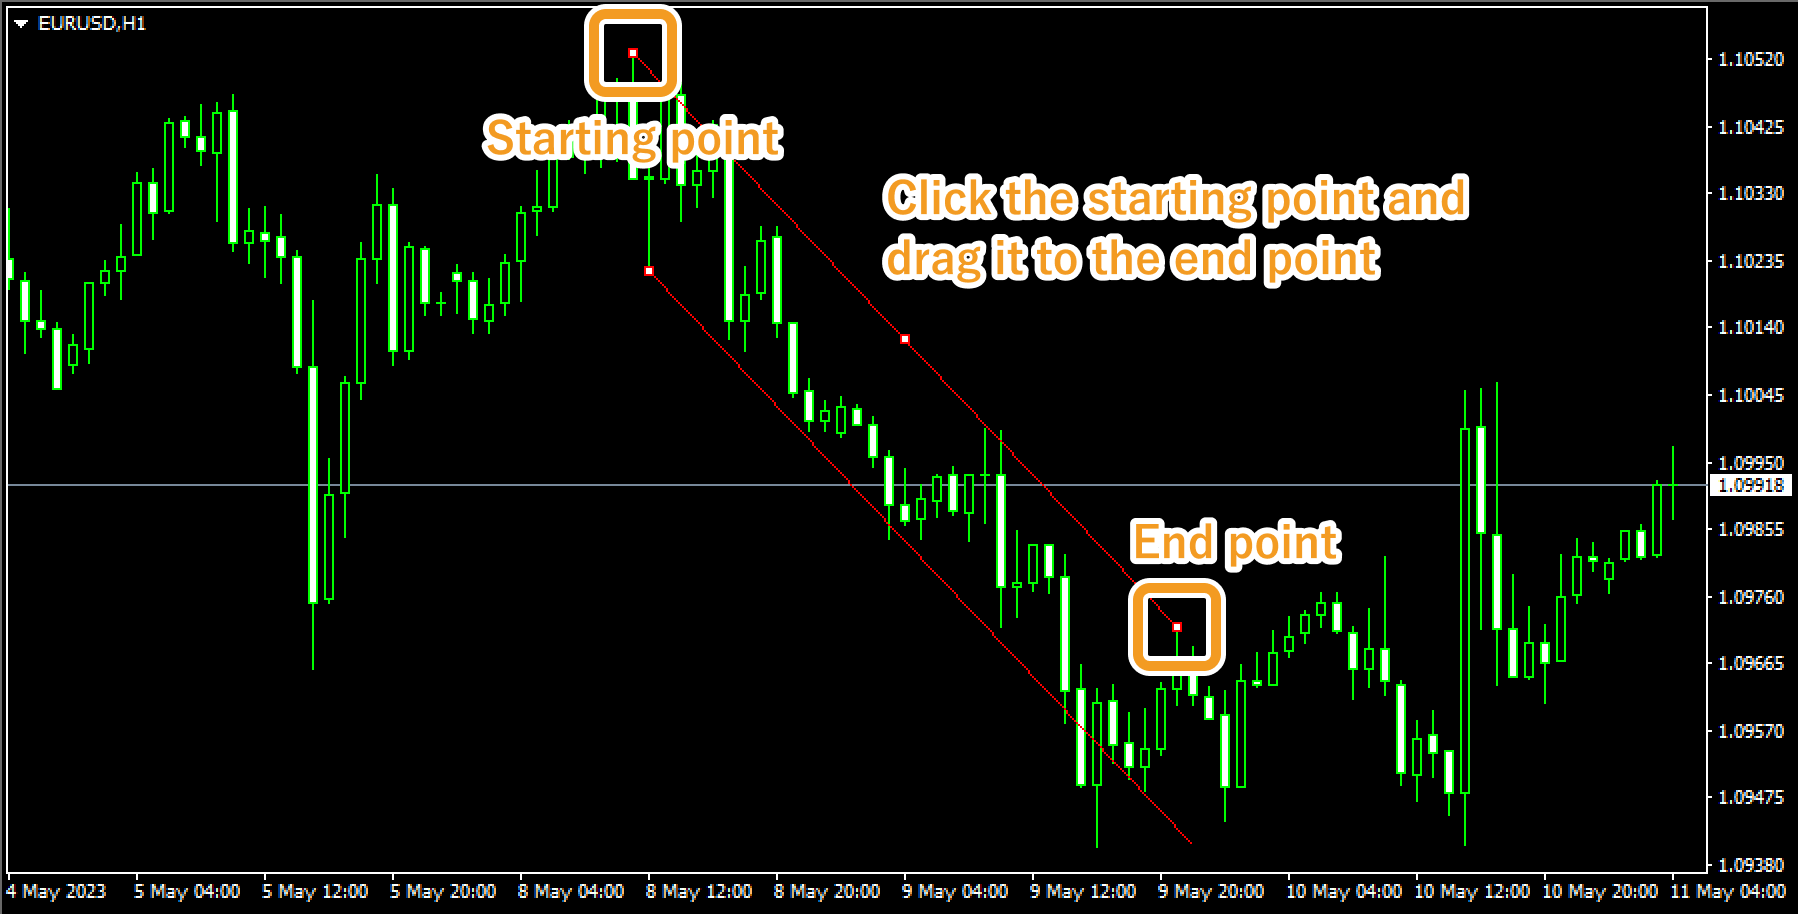
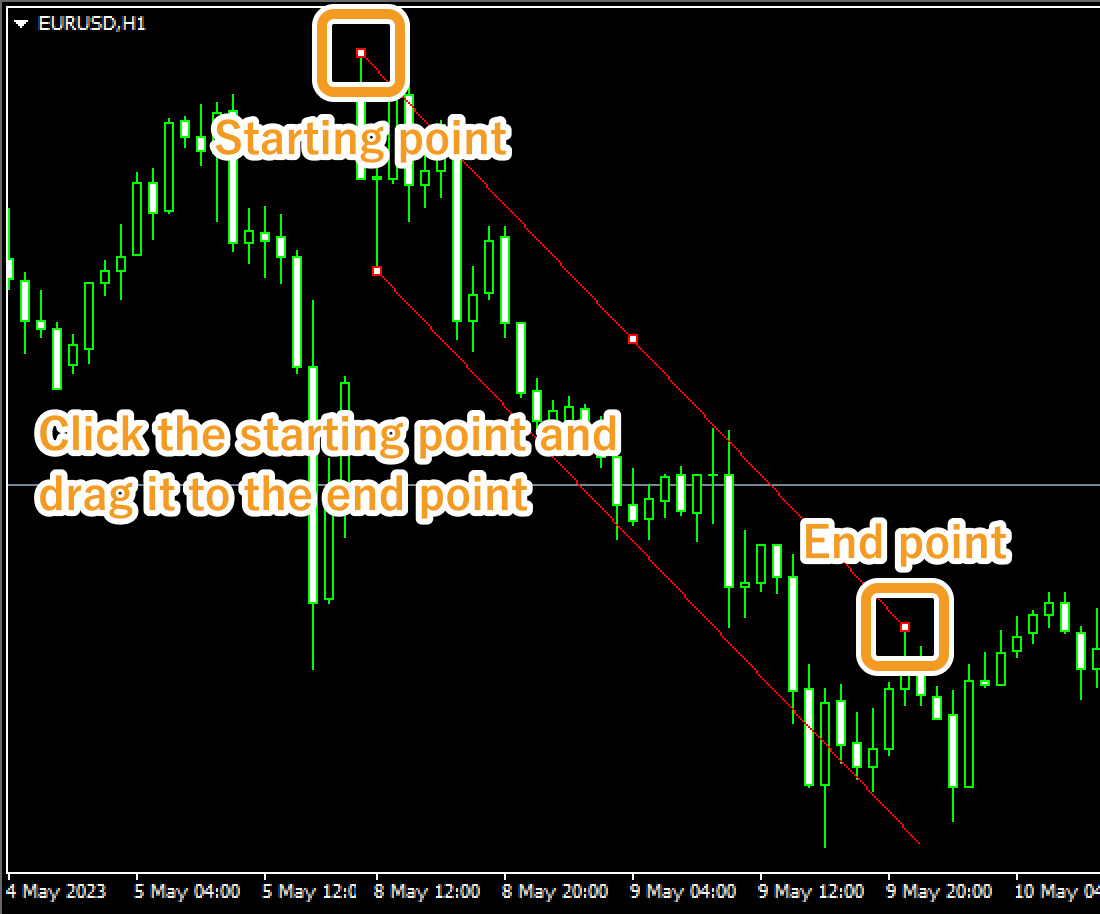
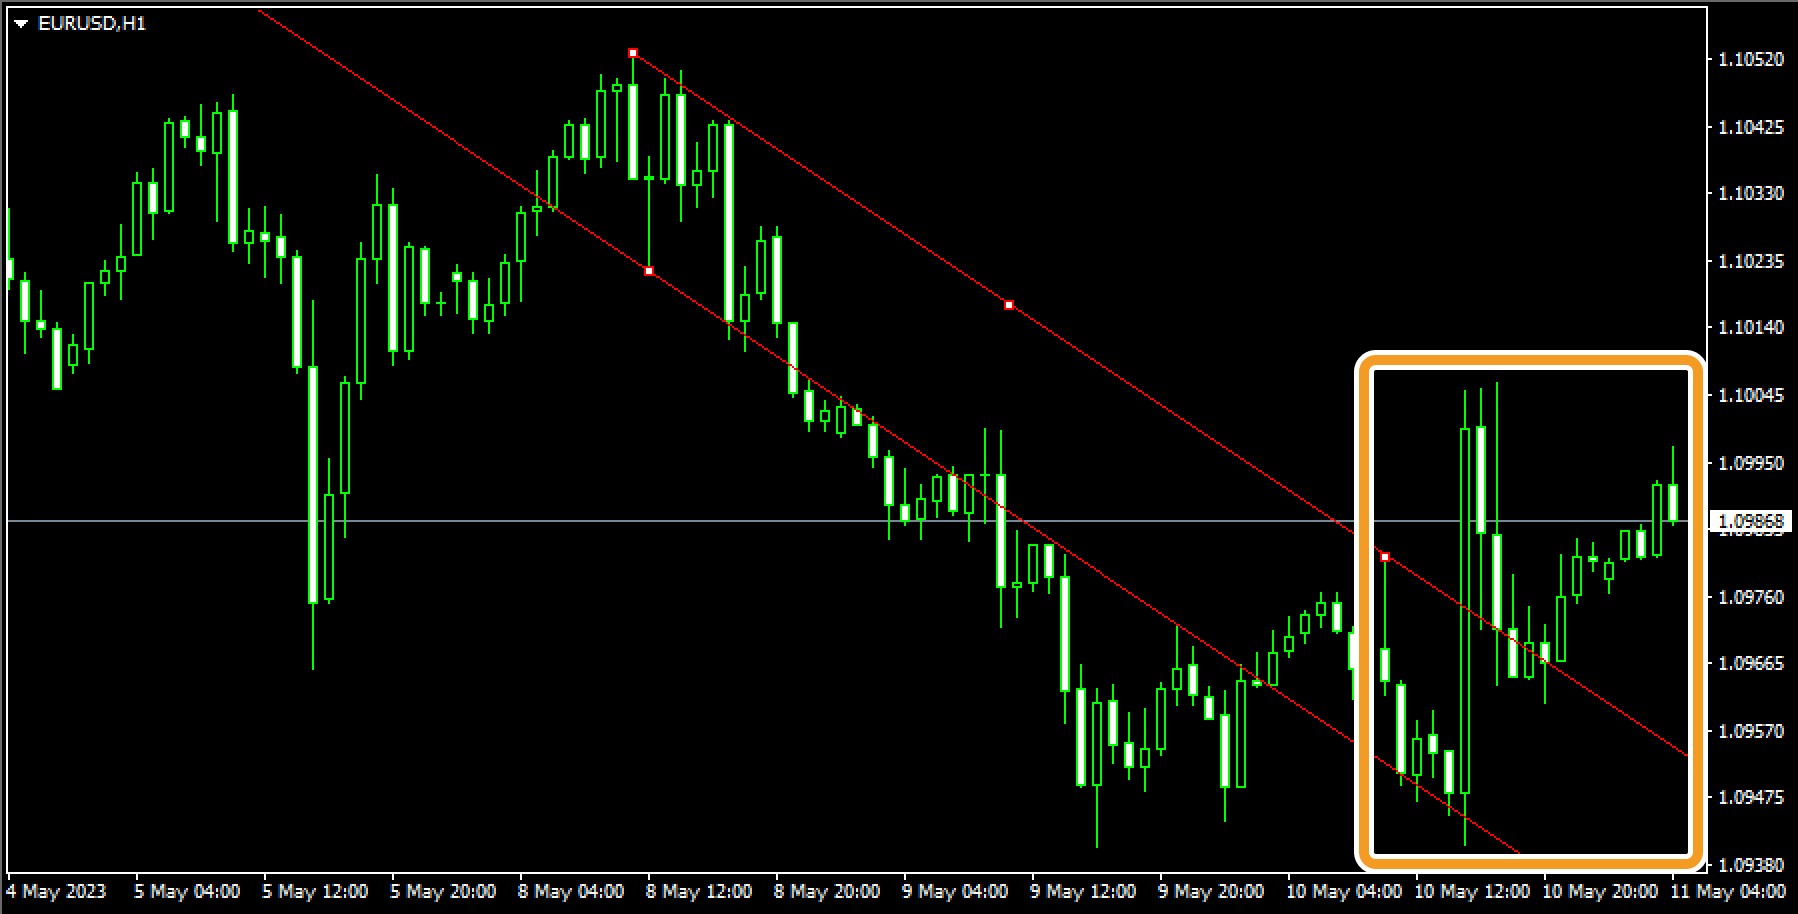
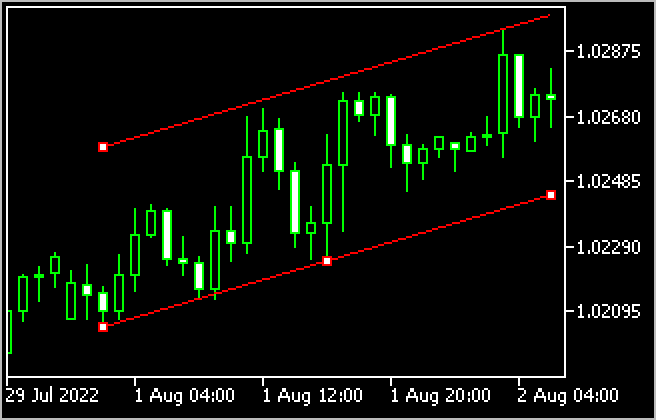
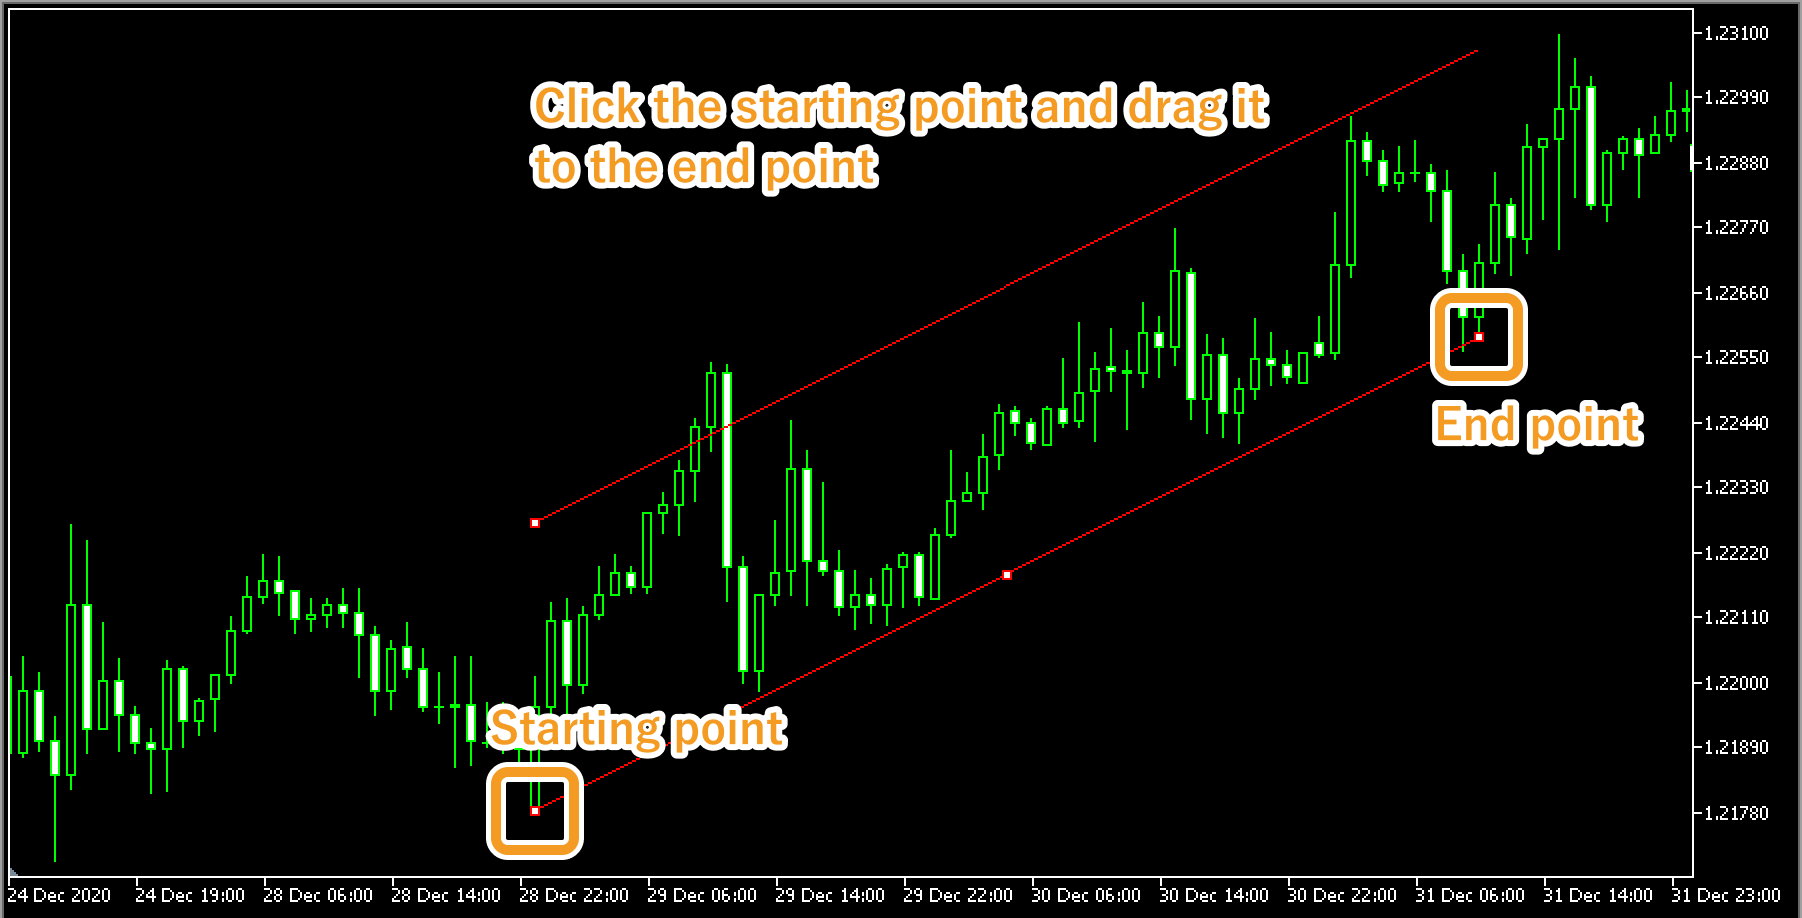
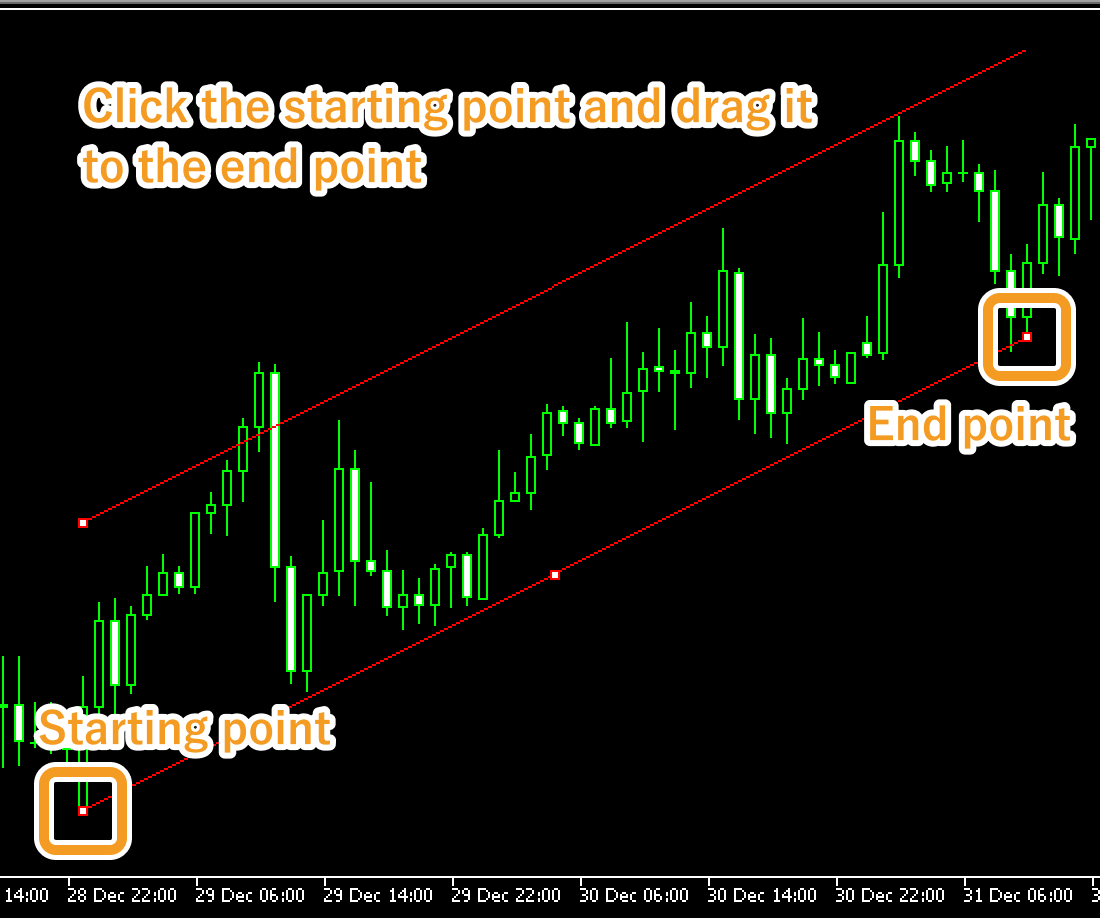
Click the starting point on the chart and drag it to the end point to create the equidistant channel.
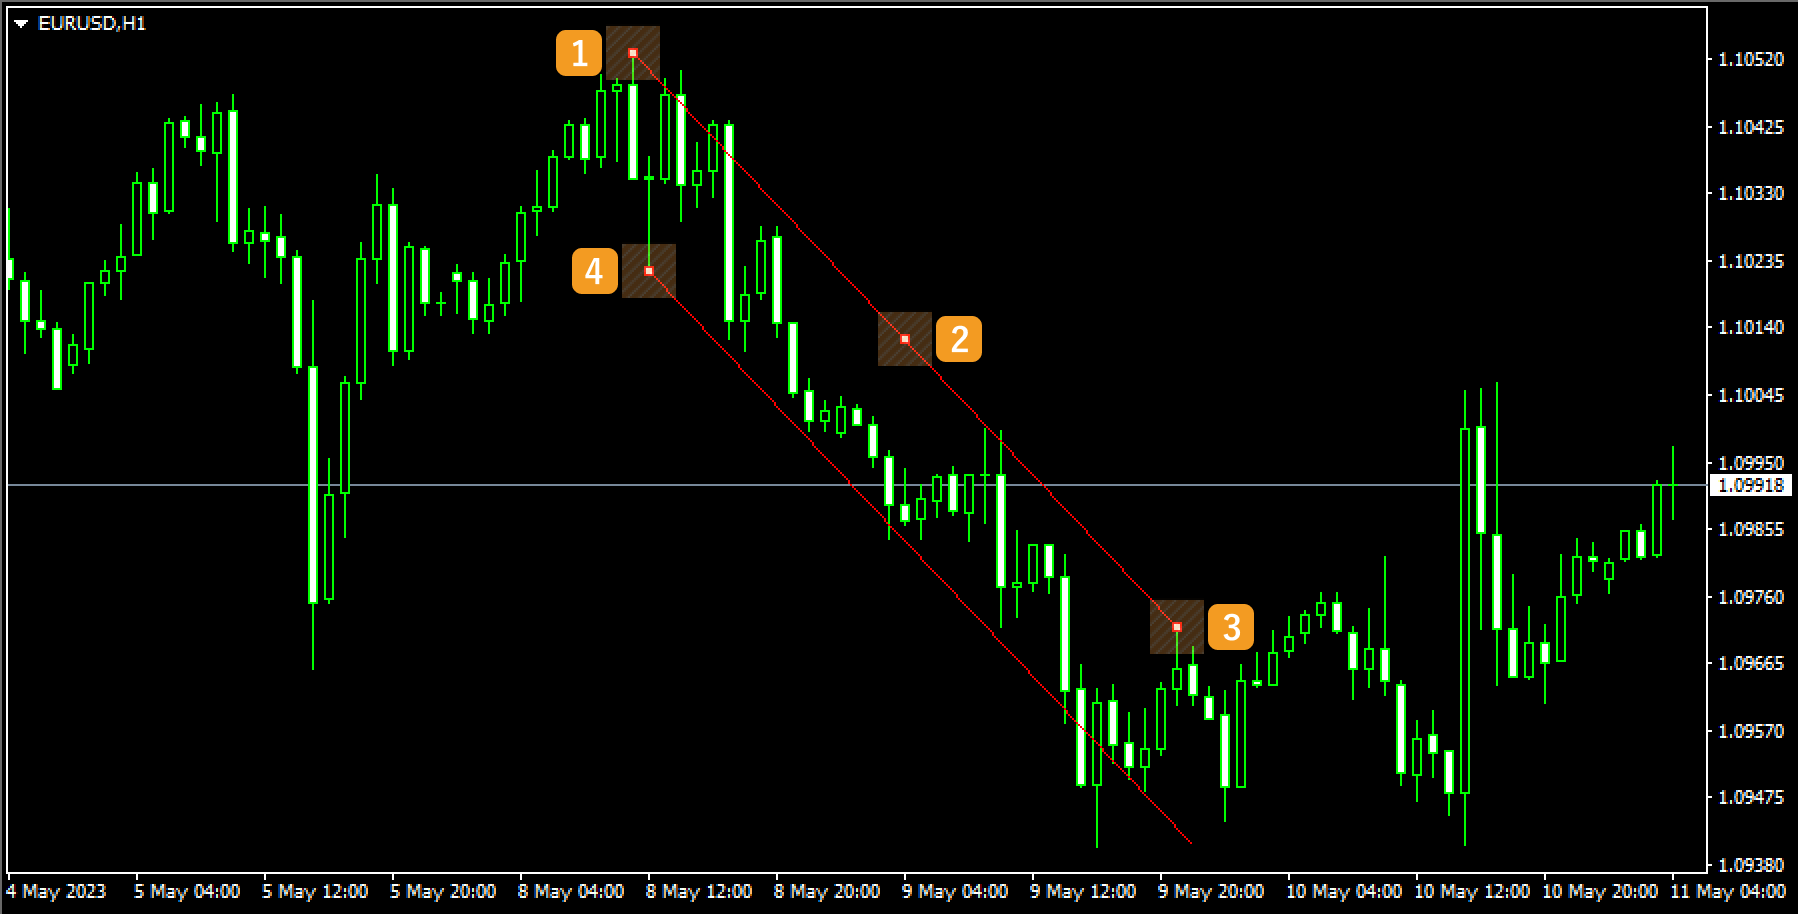
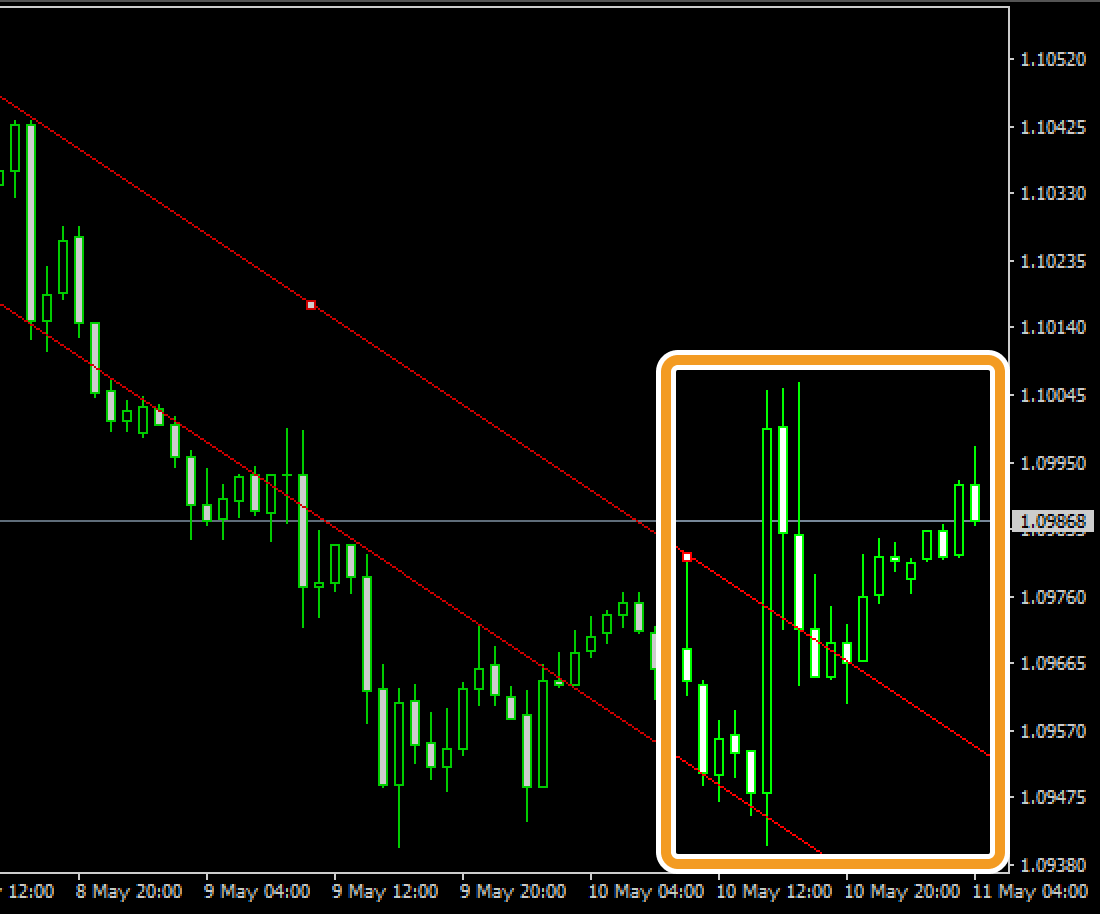
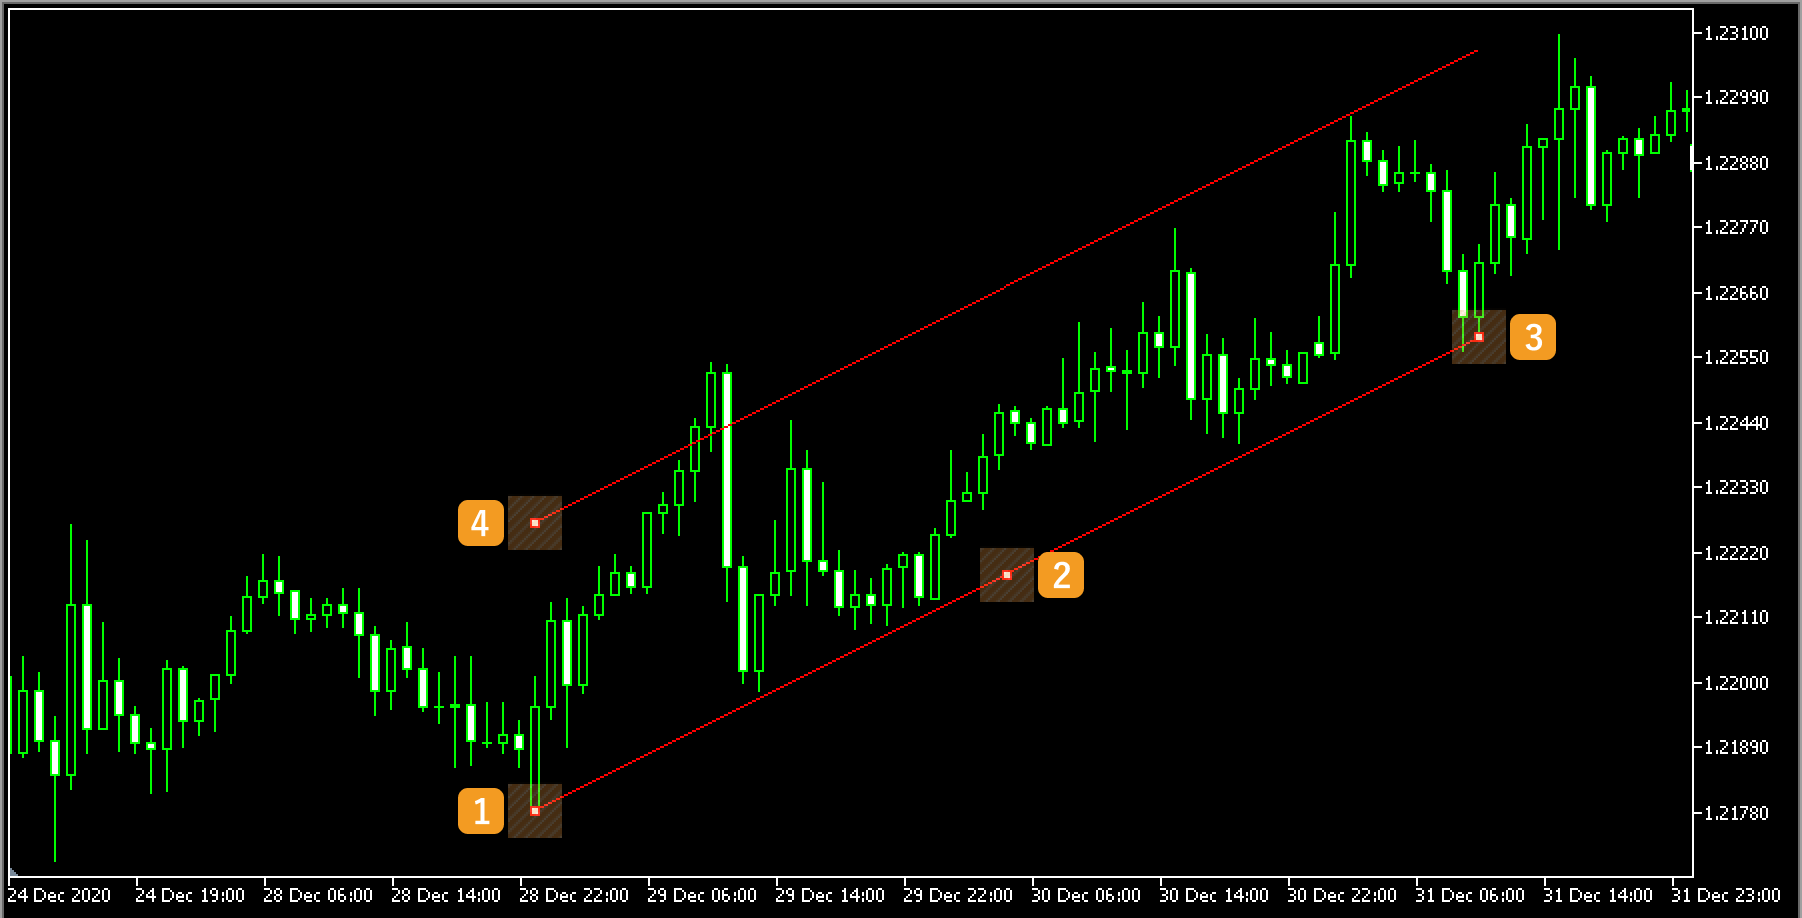
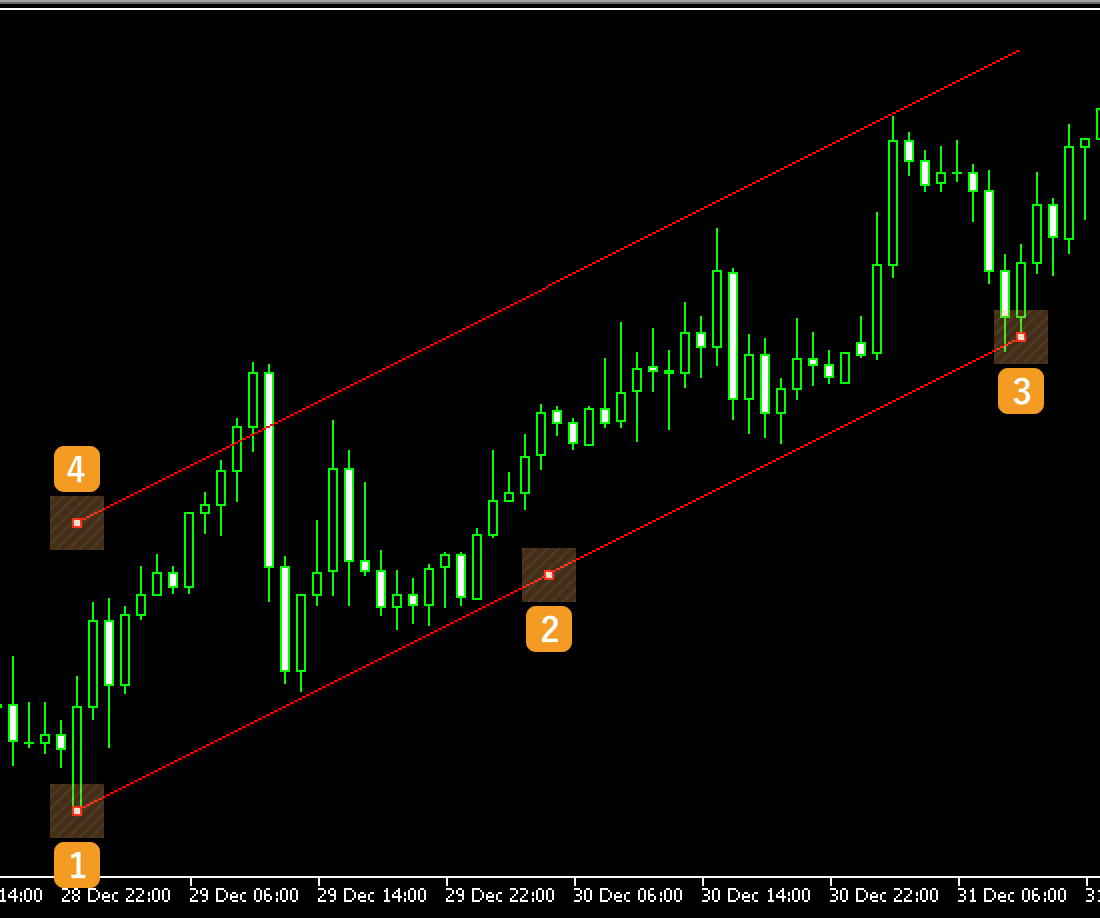
If you want to adjust the position of equidistant channel, make sure the white dots are being displayed on the equidistant channel and move each dot as necessary. If you cannot see the white dots, double-click near the equidistant channel to display the white dots.
|
Number |
Descriptions |
|---|---|
|
1 |
Change the starting point of the trendline. |
|
2 |
Change the position of the equidistant channel. |
|
3 |
Change the end point of the trendline. |
|
4 |
Change the position of the channel line relative to the trendline. |
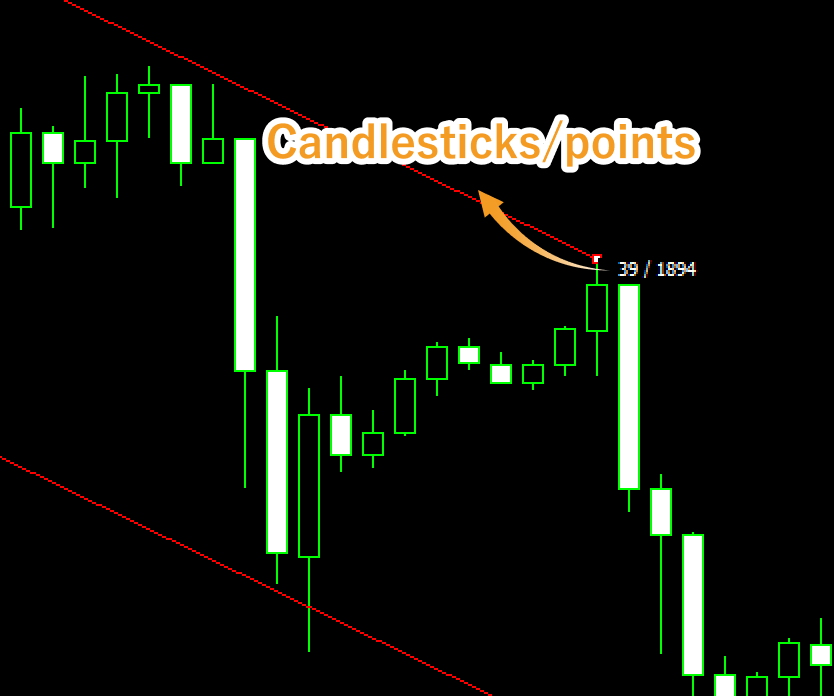
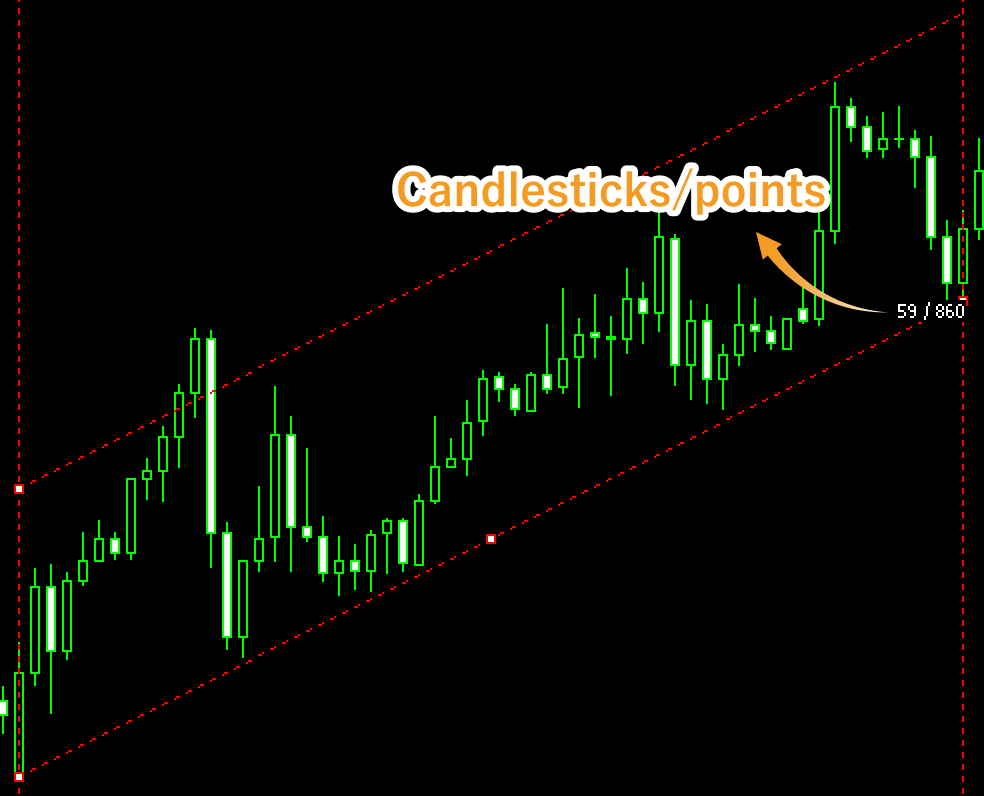
Values displayed when dragging indicate the numbers of candlesticks and points from the starting point to the end point or to the channel line.
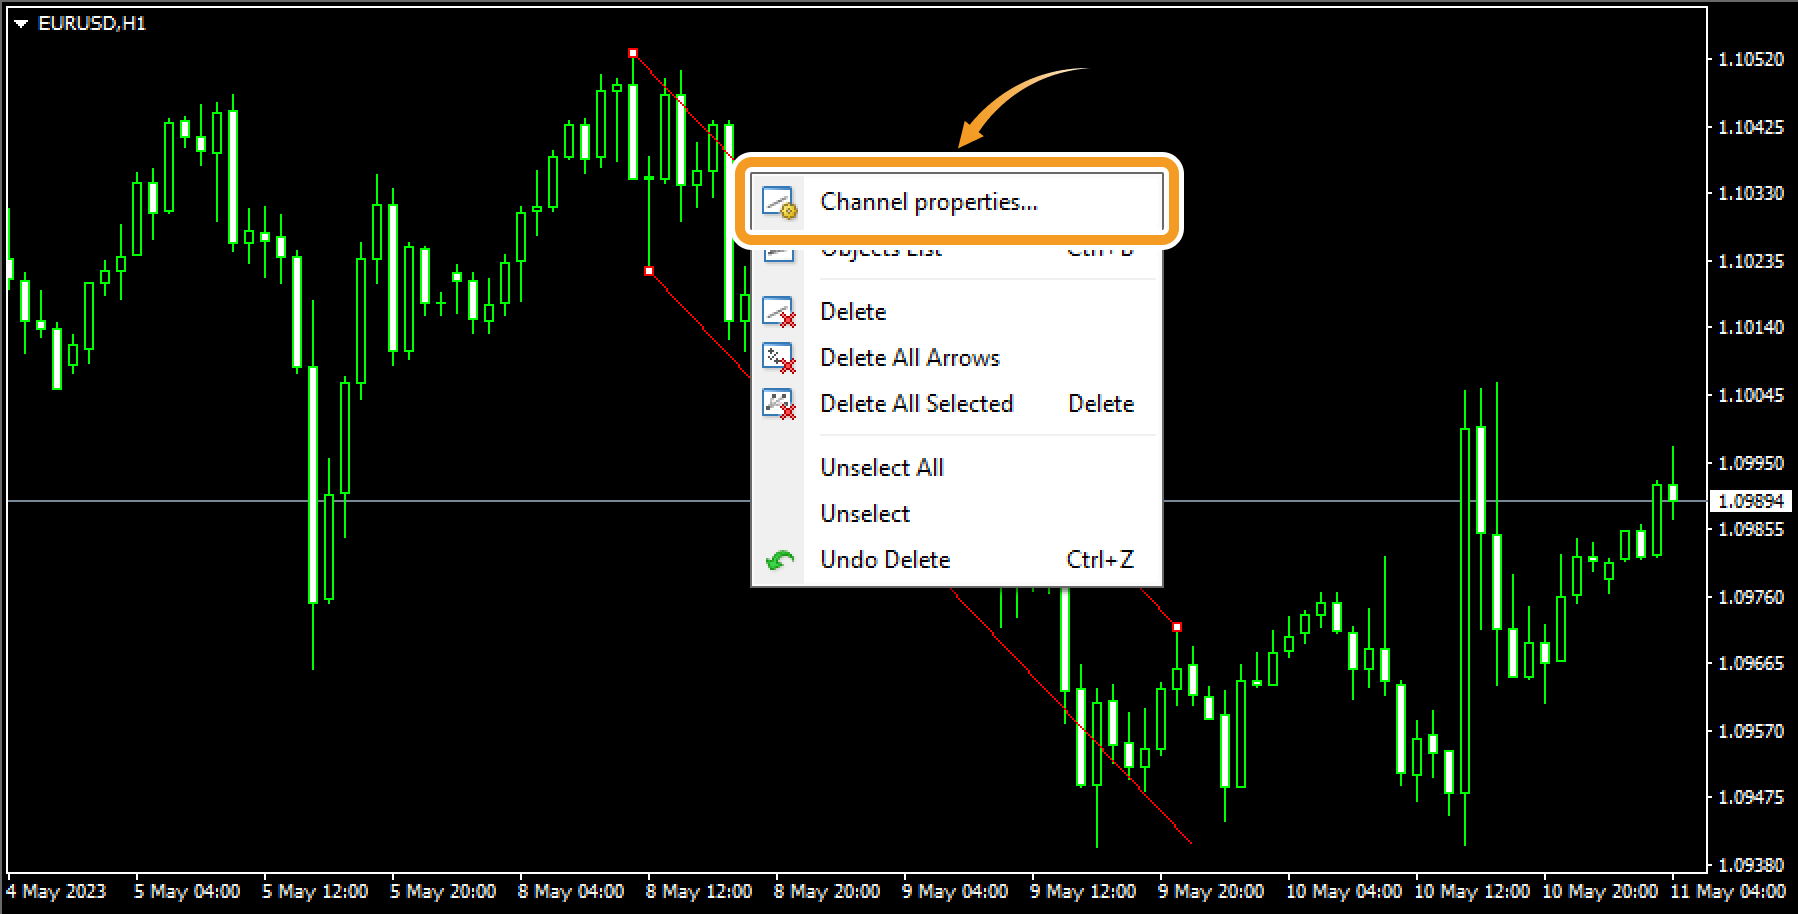
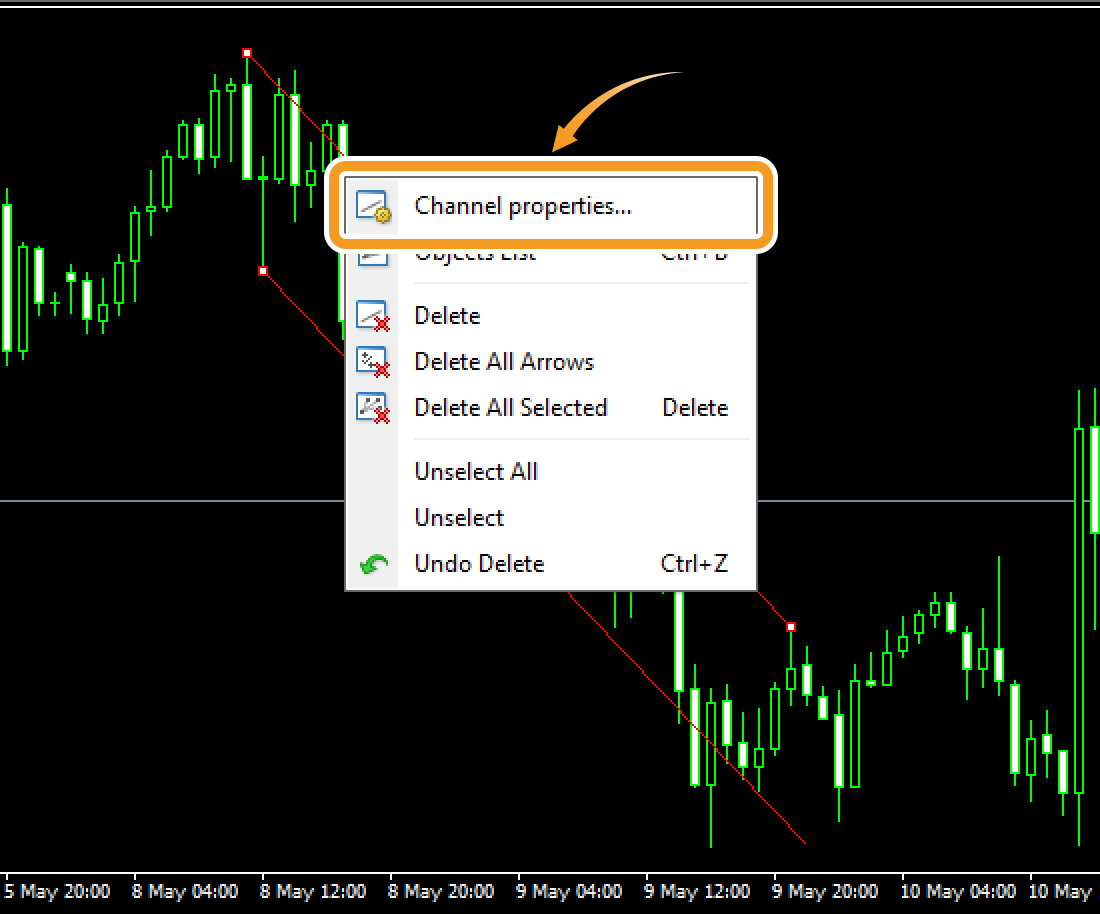
To modify the equidistant channel settings, right-click near the channel and select "Channel properties...".
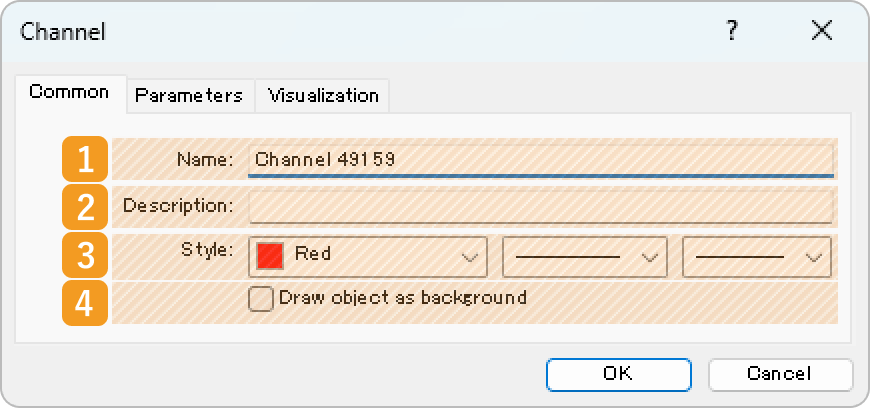
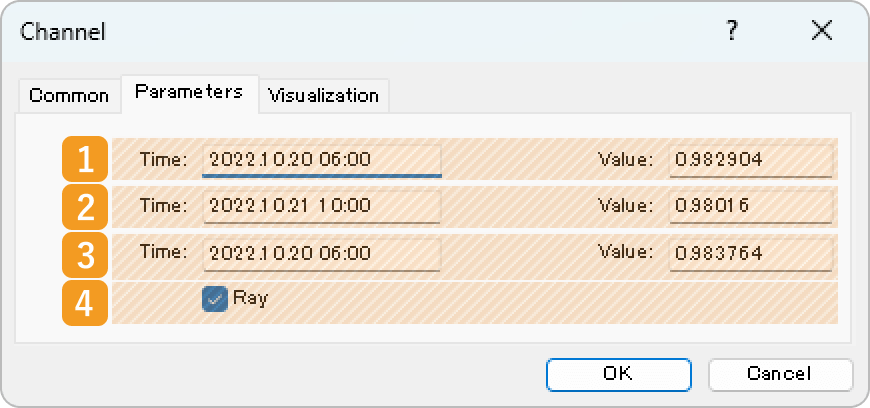
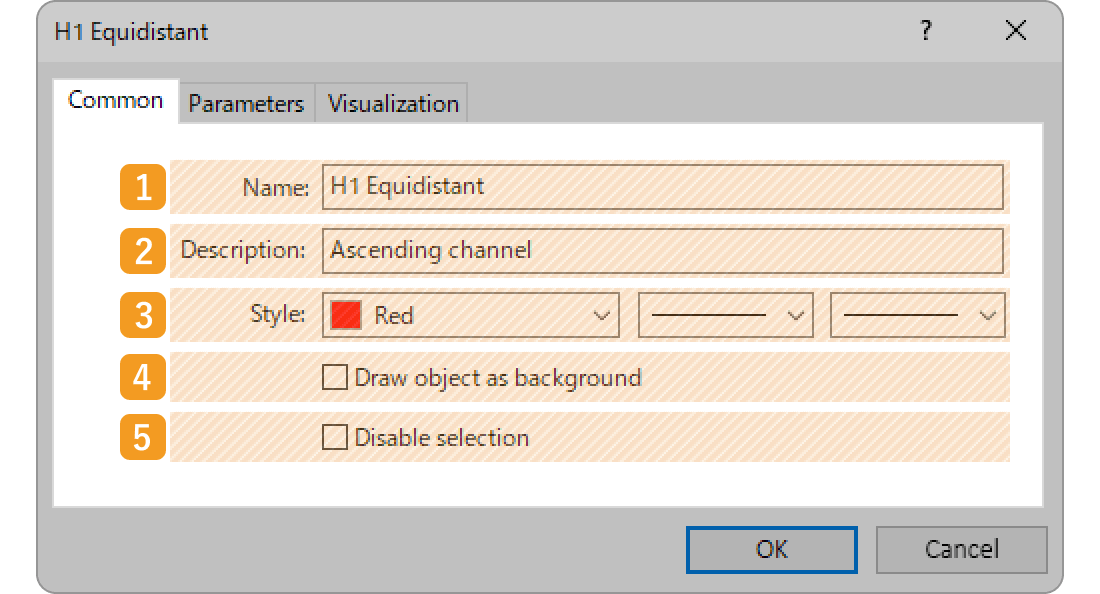
On the "Properties" window, edit the parameters in the "Common", "Parameters", and "Visualization" tabs and click "OK".
|
Number |
Item name |
Descriptions |
|---|---|---|
|
1 |
Name |
Name the equidistant channel. |
|
2 |
Description |
The description can be displayed on the chart when hovering the pointer over the equidistant channel. |
|
3 |
Style |
Set the color, line type, and line thickness for the equidistant channel. |
|
4 |
Draw object as background |
Check this box if you want to place the equidistant channel behind the chart. |
|
Number |
Item name |
Descriptions |
|---|---|---|
|
1 |
Starting point position |
Specify the starting point position by date, time and price. |
|
2 |
End point position |
Specify the end point position by date, time and price. |
|
3 |
Channel line position |
Specify the channel line position by date, time and price. |
|
4 |
Ray |
Check this box to extend the equidistant channel. |
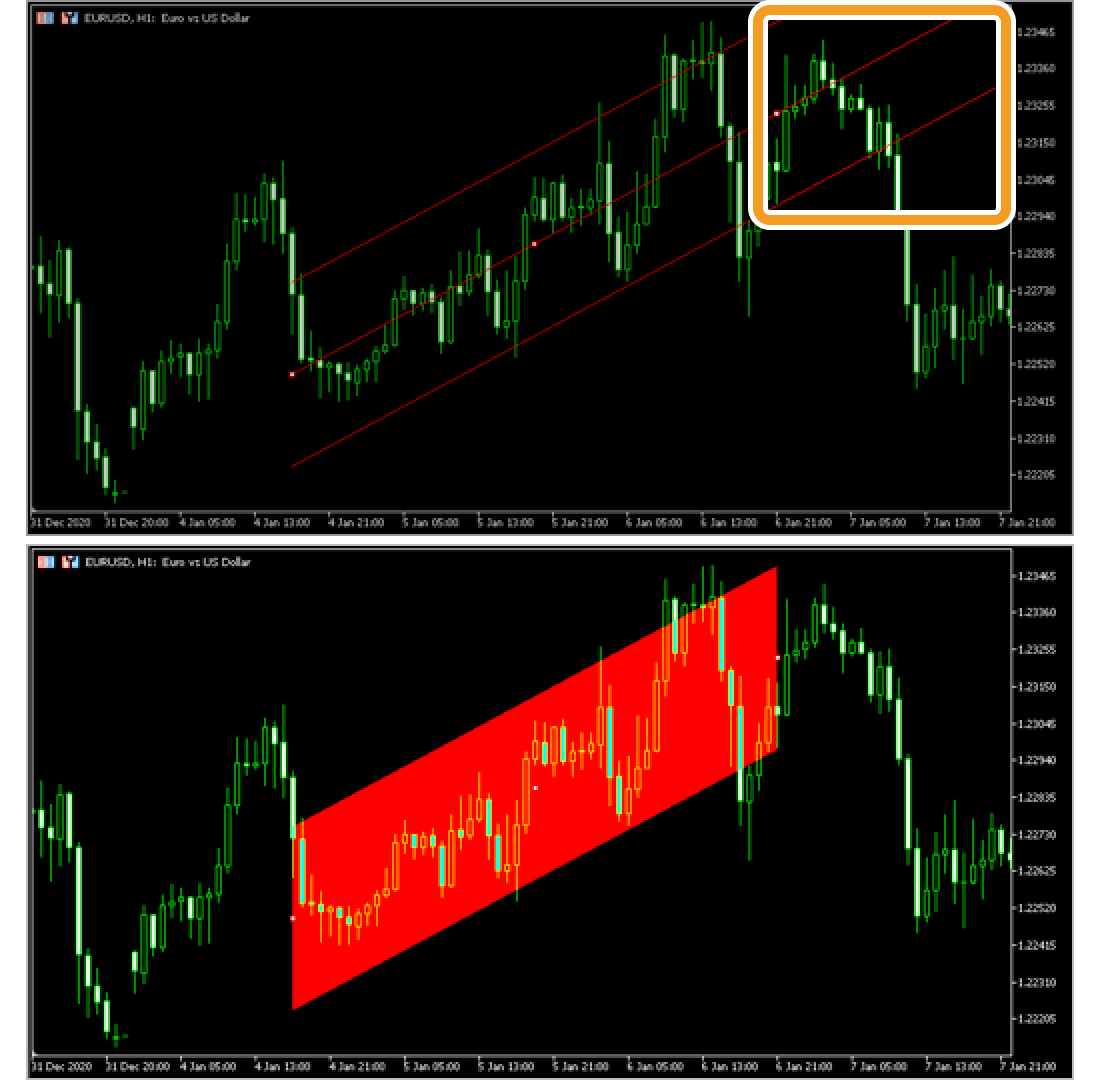
"Ray" is a feature that can be set on an object such as a channel to extend the line beyond its end point. The channel line can be extended beyond the starting point as well. This makes it easier to analyze, as the line will be extended into the past or future, based on the price movement between the starting and end points at a given time.
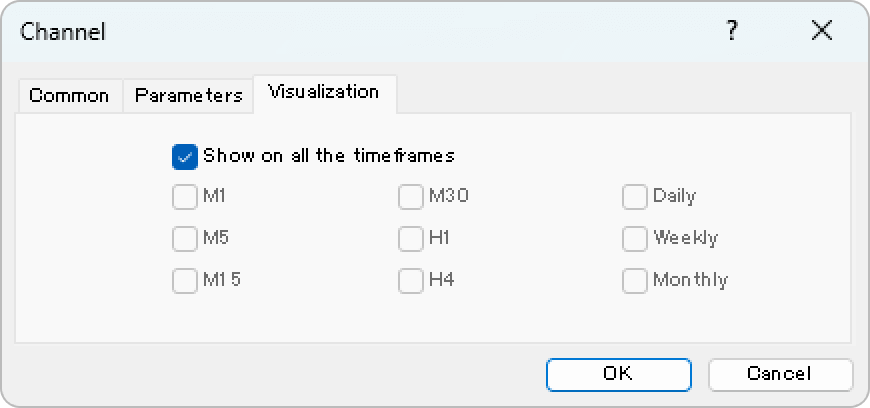
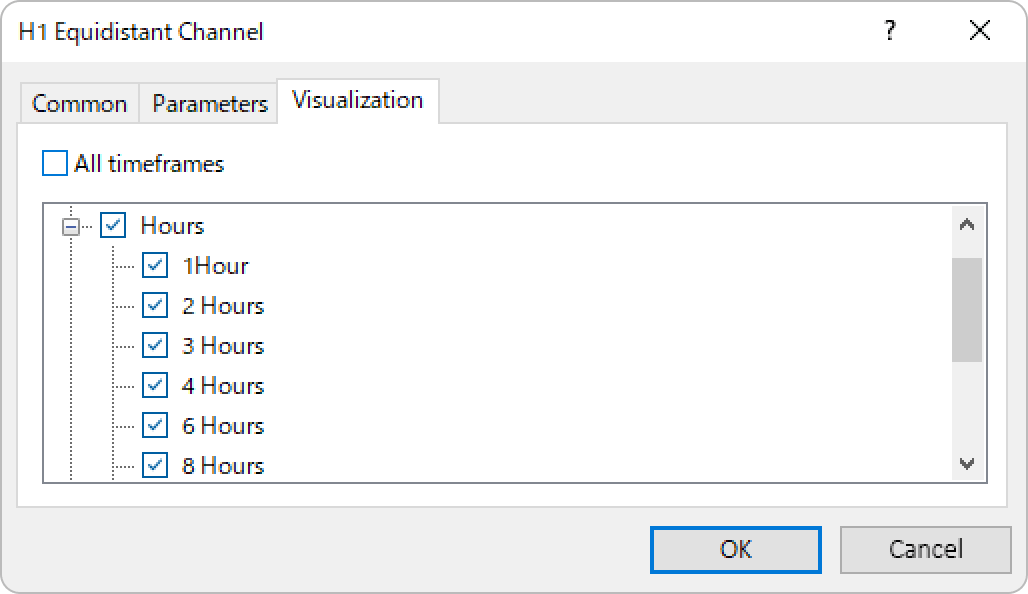
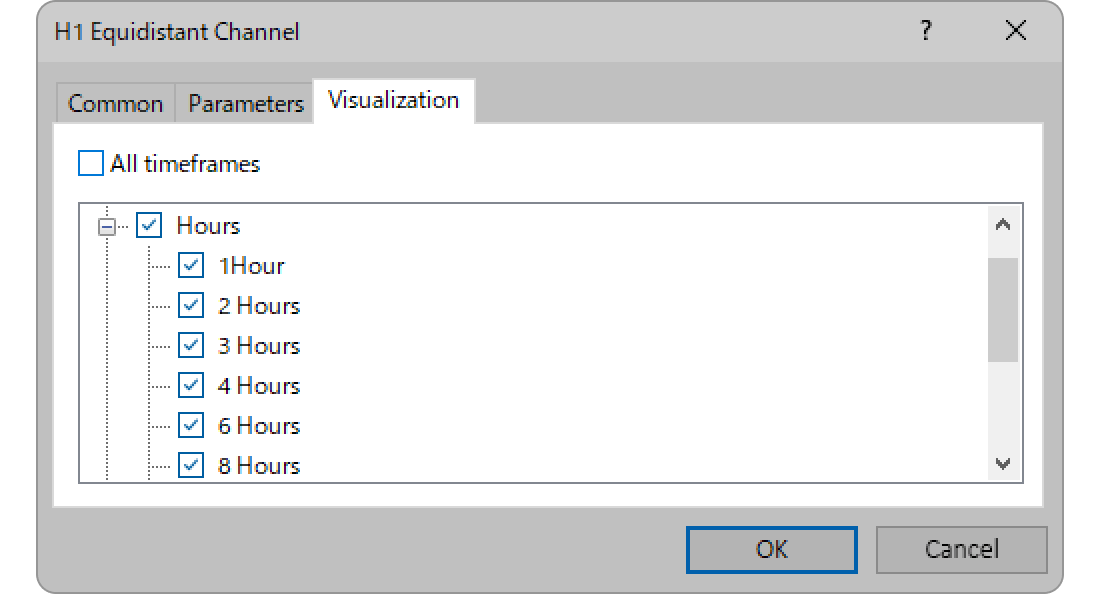
On the "Visualization" tab, you can specify the timeframes to use the equidistant channel with.
The equidistant channel can be drawn from the menu or the Toolbar.
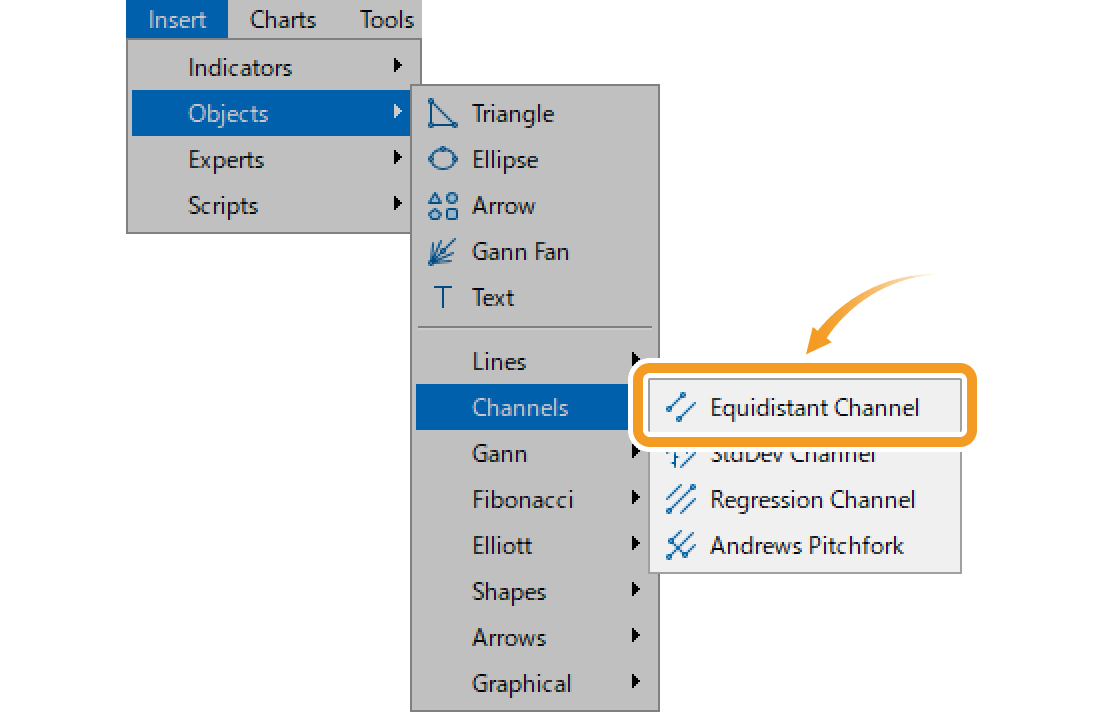
Click "Insert" in the menu. Hover the pointer over "Objects" > "Channels" and select "Equidistant Channel".
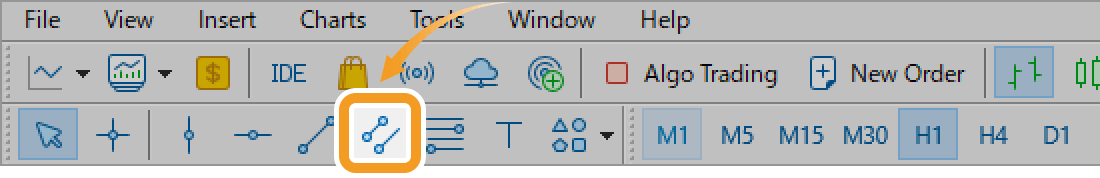
Click the "Draw equidistant channel" button on the toolbar.
On MT5, five types of channels can be drawn including the Fibonacci channel in the "Fibonacci" menu.
Equidistant channel
Draws two parallel lines. Each line can be moved separately while keeping them parallel.
Standard deviation
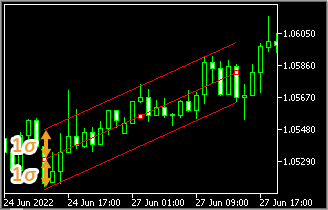
Draws a center line (regression line) using the close price of each candle, and then draws two parallel lines at a distance of standard deviation from the center line.
Linear regression
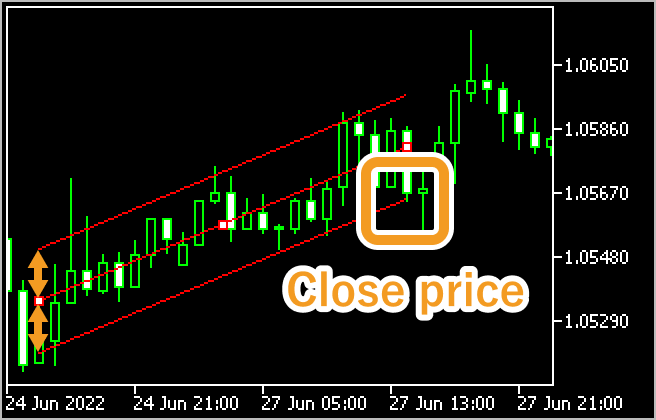
Draws a center line (regression line) using the close price of each candle, and then draws equally spaced two parallel lines above and below it. The parallel lines pass through the close price farthest from the center line.
Andrews' Pitchfork
Three parallel lines are drawn using three points: the starting point of the trend and the high and low just after the trend.
Fibonacci channel
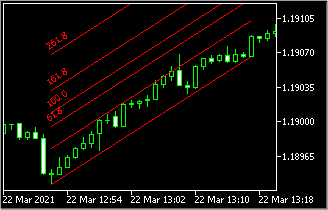
Fibonacci channel uses the trendline and creates parallel channel lines using the Fibonacci ratio.
Click the starting point on the chart and drag it to the end point to create the equidistant channel.
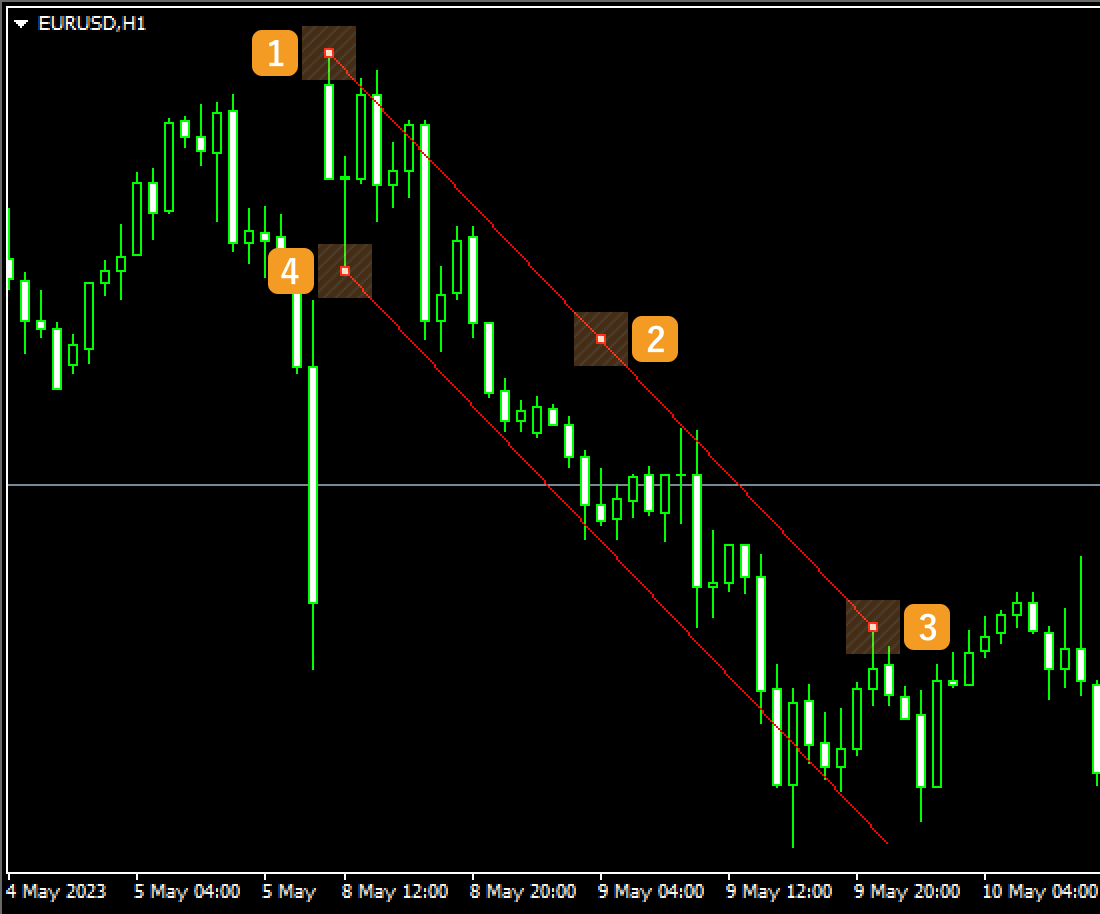
If you want to adjust the position of equidistant channel, make sure the white dots are being displayed on the equidistant channel and move each dot as necessary. If you cannot see the white dots, double-click near the equidistant channel to display the white dots.
|
Number |
Descriptions |
|---|---|
|
1 |
Change the starting point of the trendline. |
|
2 |
Change the position of the equidistant channel. |
|
3 |
Change the end point of the trendline. |
|
4 |
Change the position of the channel line parallel to the trendline. |
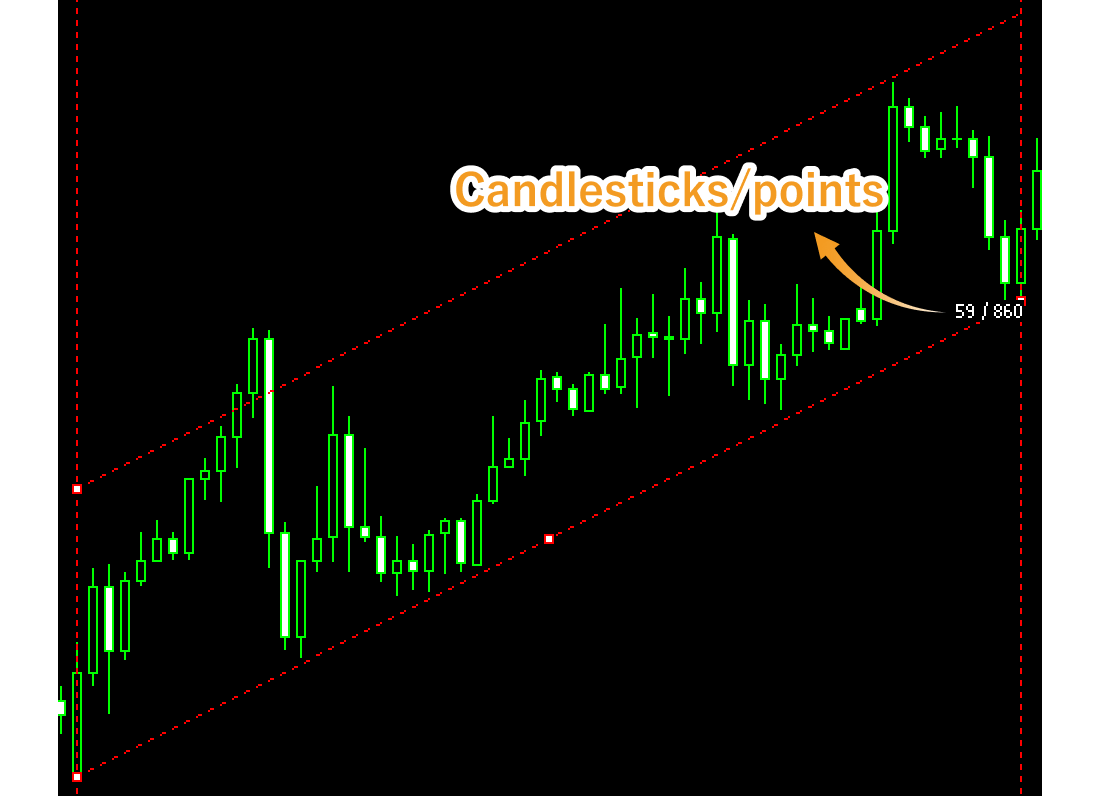
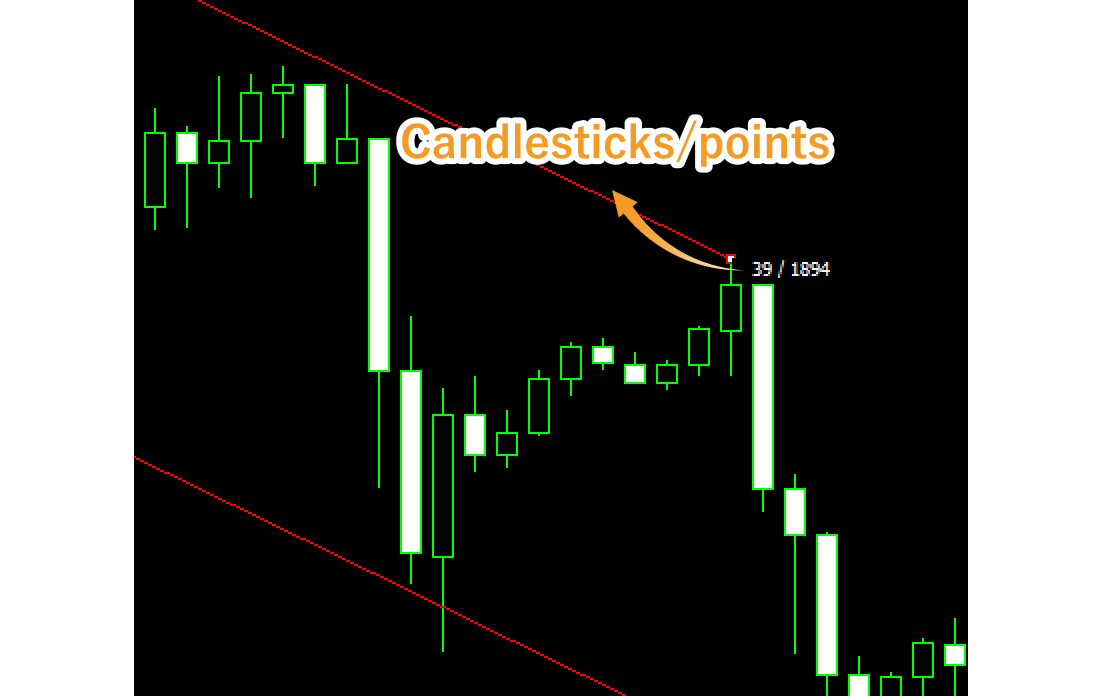
Values displayed when dragging indicate the numbers of candlesticks and points from the starting point to the end point or to the channel line.
To modify the equidistant channel settings, right-click near the channel and select "Properties of (channel name)".
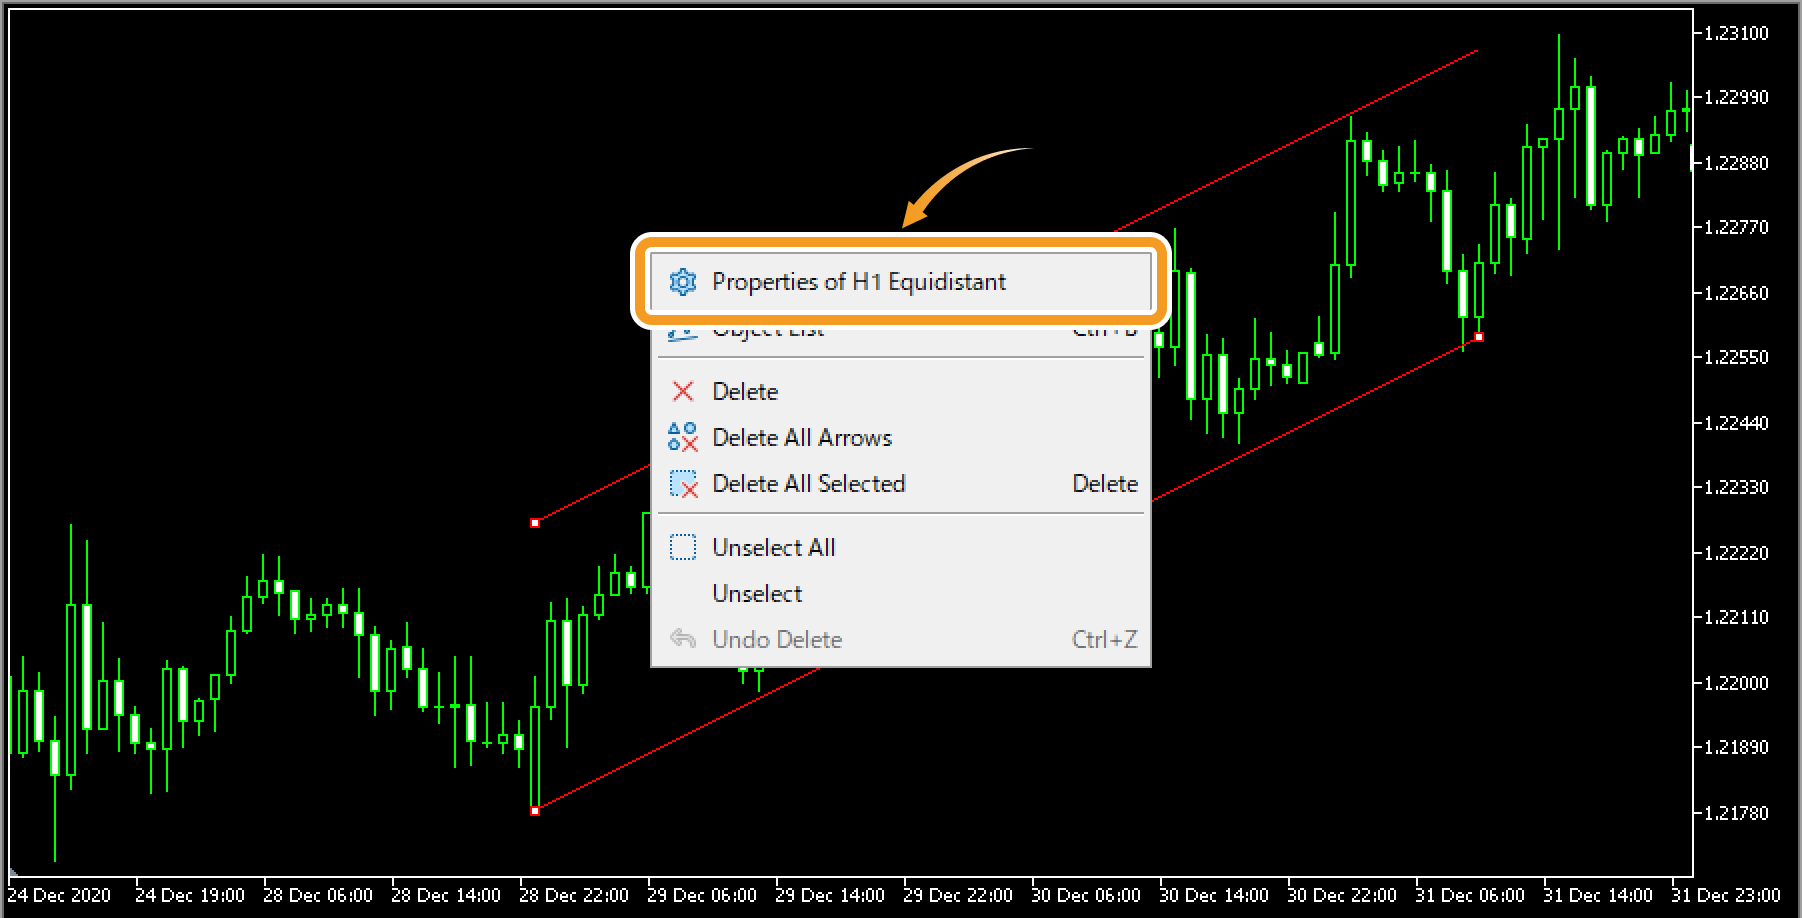
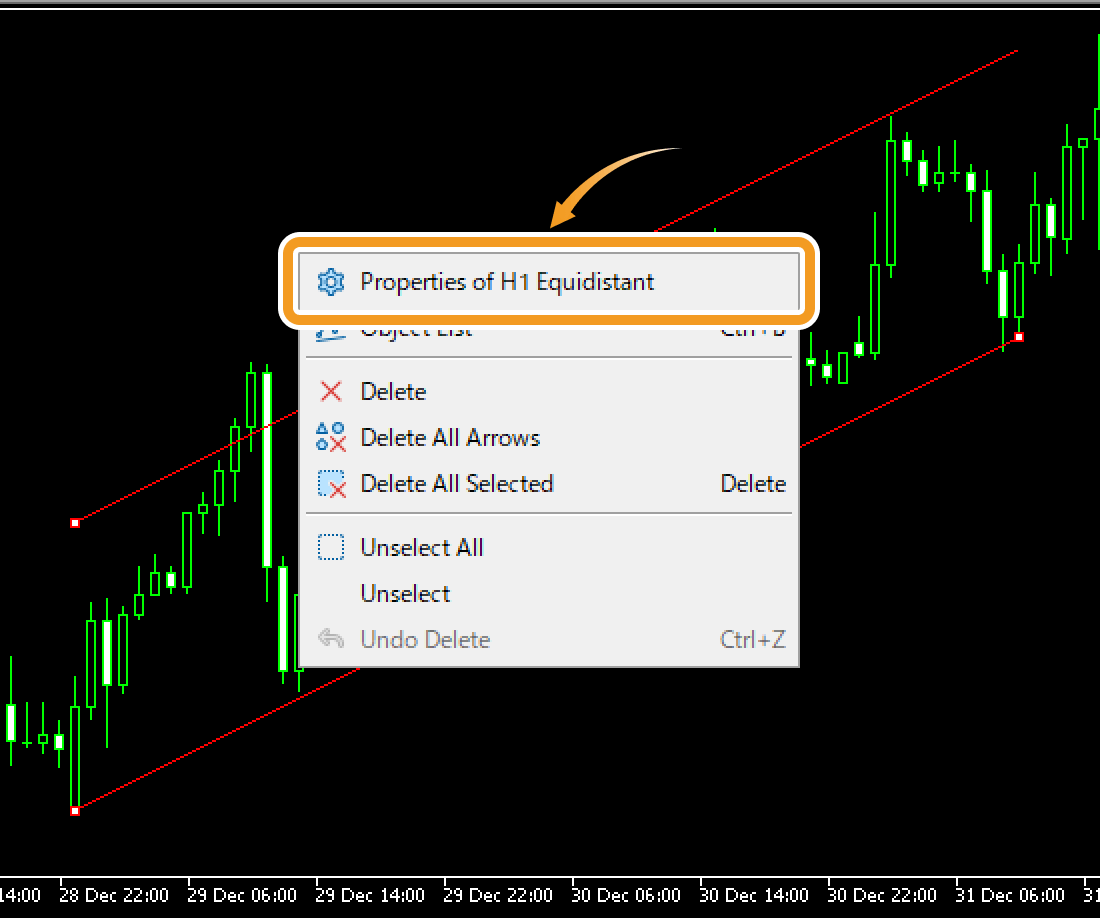
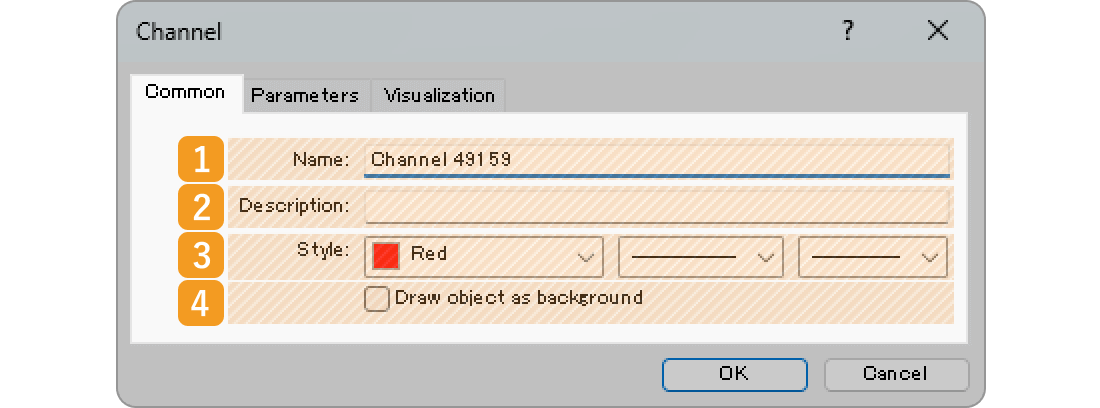
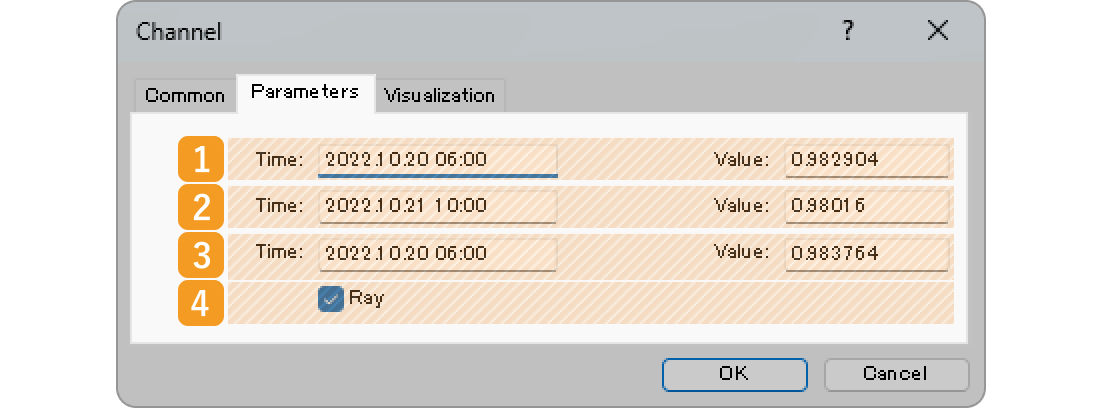
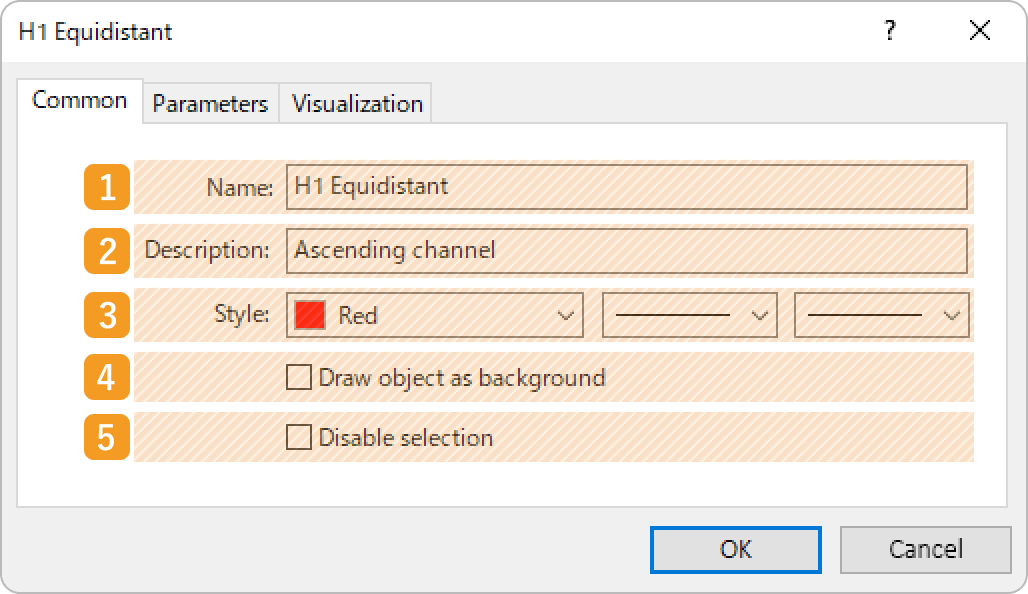
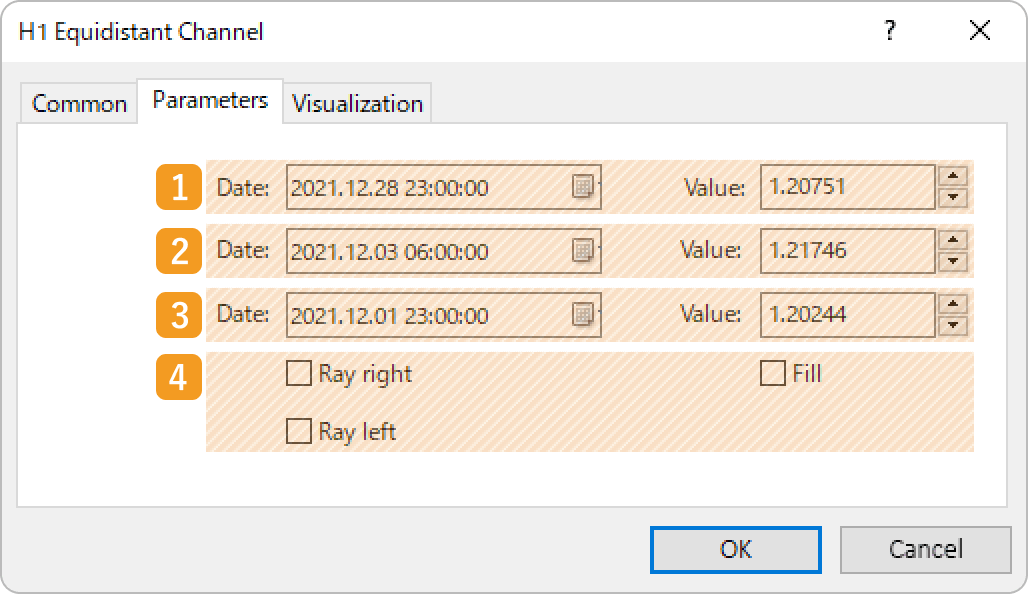
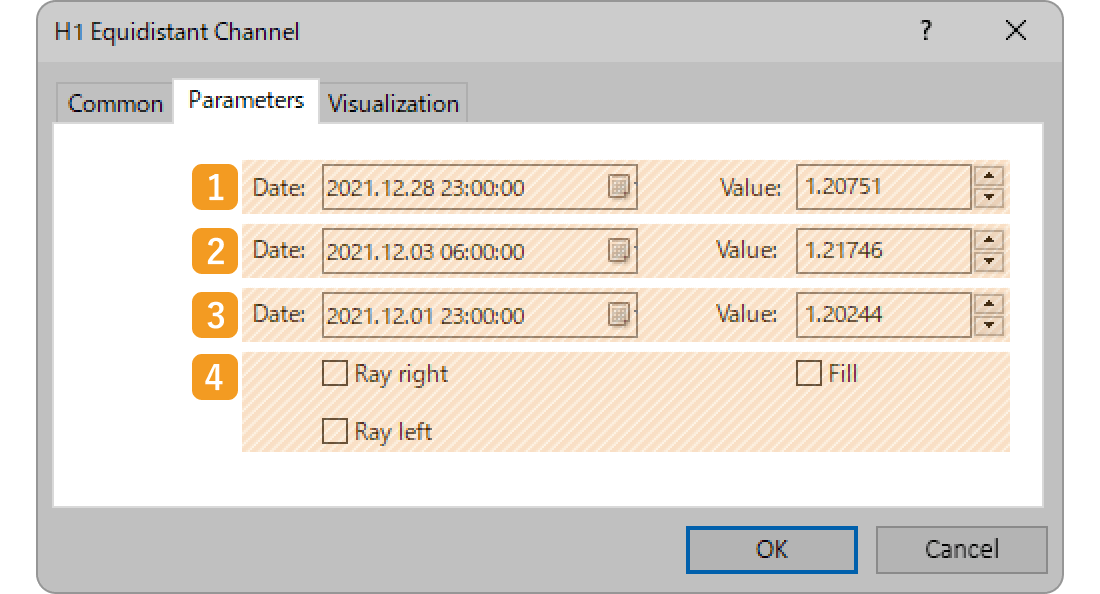
On the "Properties" window, edit the parameters in the "Common", "Parameters", and "Visualization" tabs and click "OK".
|
Number |
Item name |
Descriptions |
|---|---|---|
|
1 |
Name |
Name the equidistant channel. |
|
2 |
Description |
The description of the equidistant channel can be displayed on the chart. |
|
3 |
Style |
Set the color, line type, and line thickness for the equidistant channel. |
|
4 |
Draw object as background |
Check this box if you want to place the equidistant channel behind the chart. |
|
5 |
Disable selection |
Check this box if you want to disable the editing of the equidistant channel. |
|
Number |
Item name |
Descriptions |
|---|---|---|
|
1 |
Starting point position |
Specify the starting point position by date, time and price. |
|
2 |
End point position |
Specify the end point position by date, time and price. |
|
3 |
Channel line position |
Specify the channel line position by date, time and price. |
|
4 |
Ray/Fill |
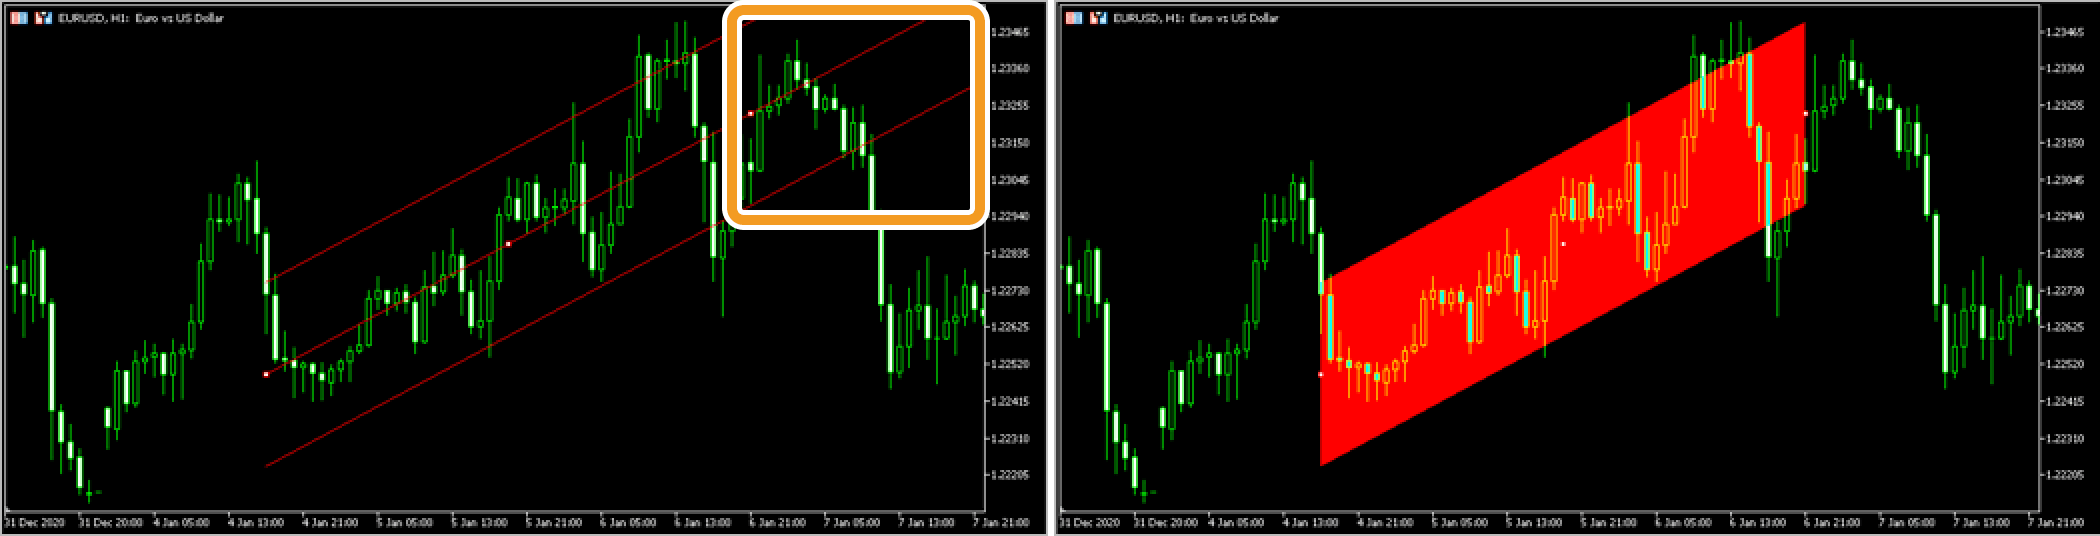
Check each box to extend the equidistant channel to the left and right, or fill inside the channel. |
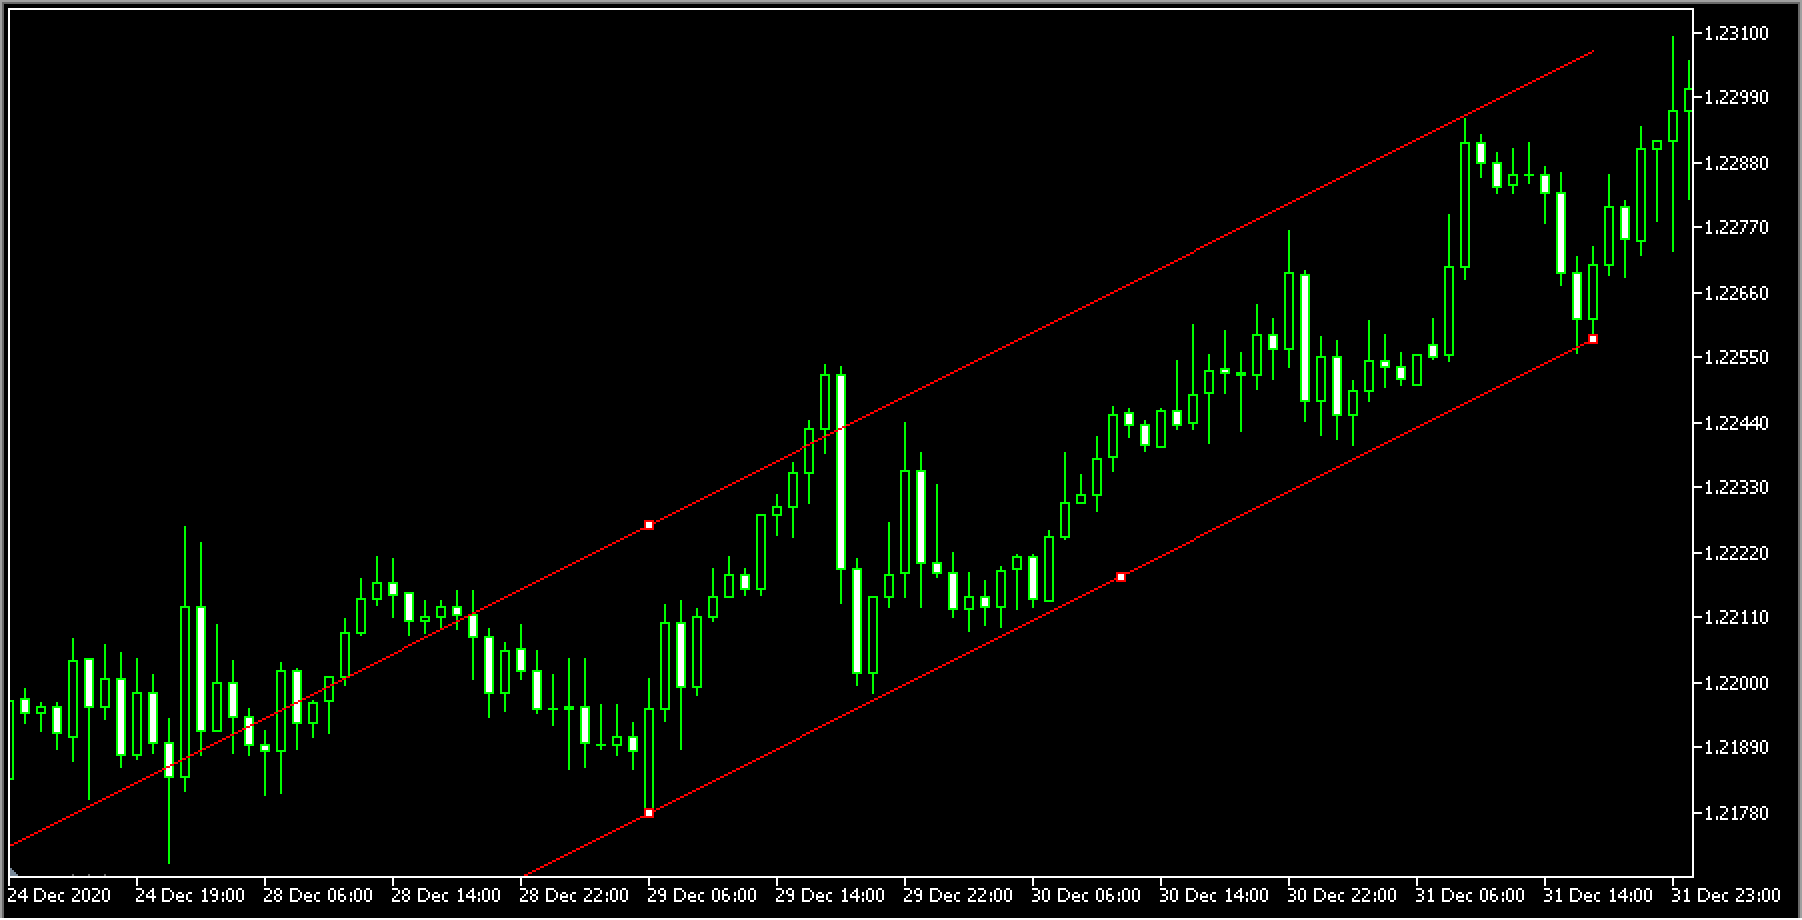
Ray is a feature for channels and other objects to extend the line beyond its starting and end points. This makes it easier to analyze, as the line will be extended into the past and future, based on the price movement between the points at a given time.
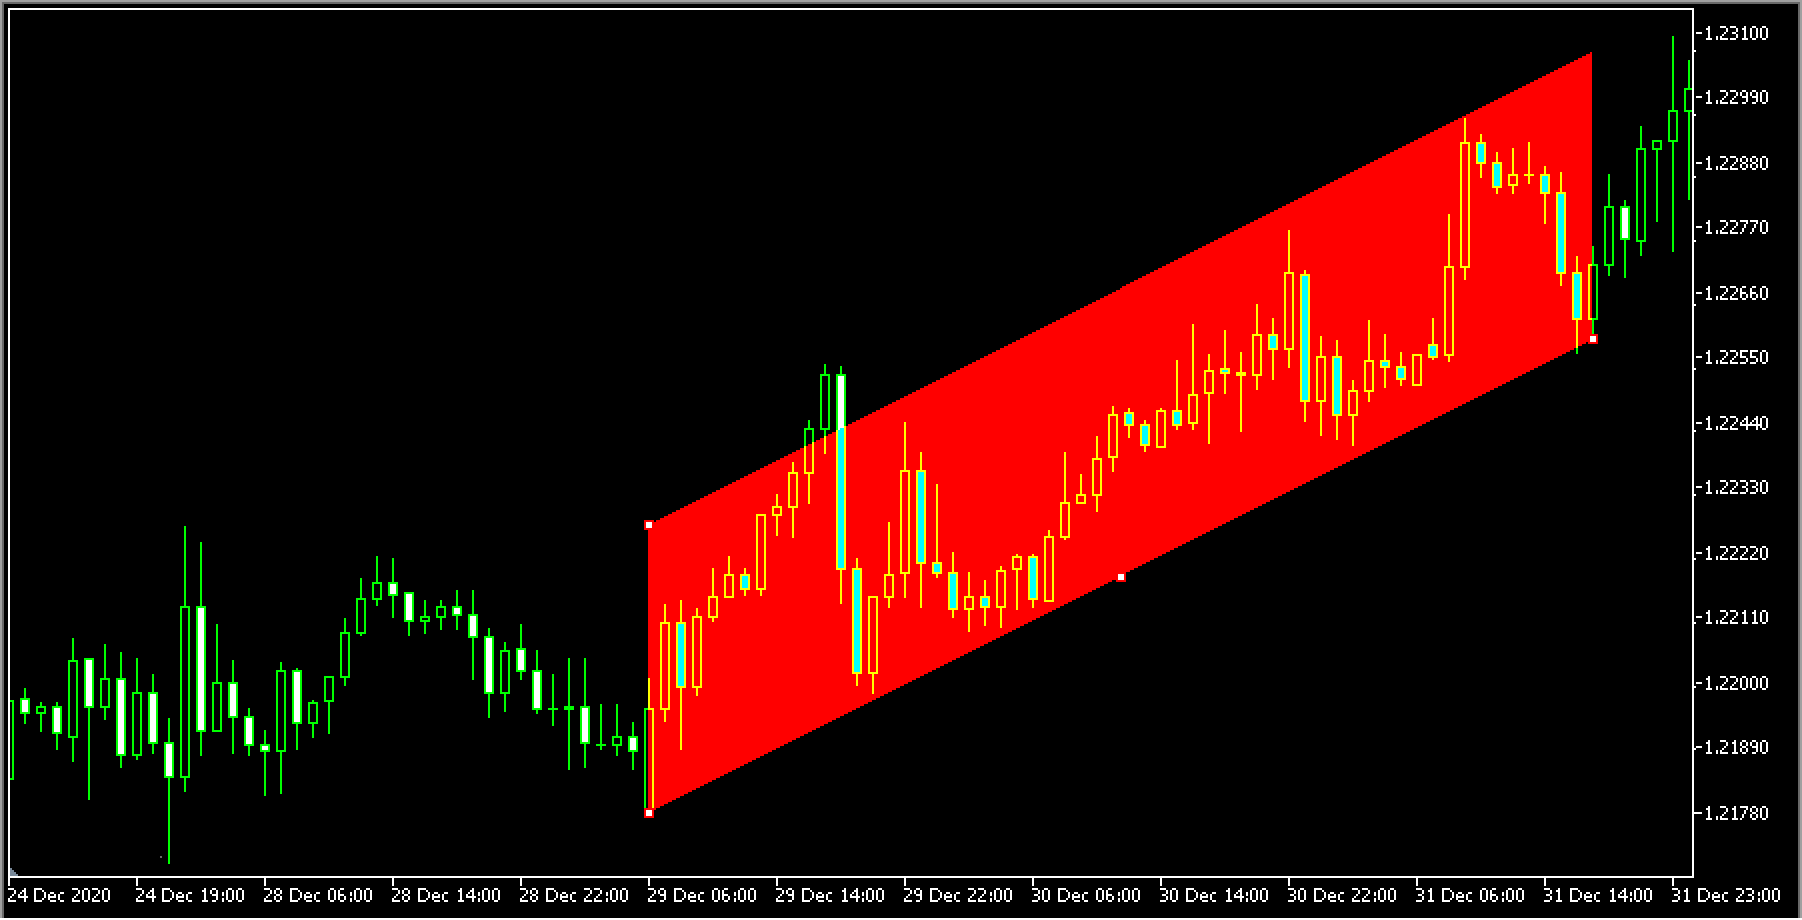
As for "Fill", this feature fills the channel with a color to highlight its range.


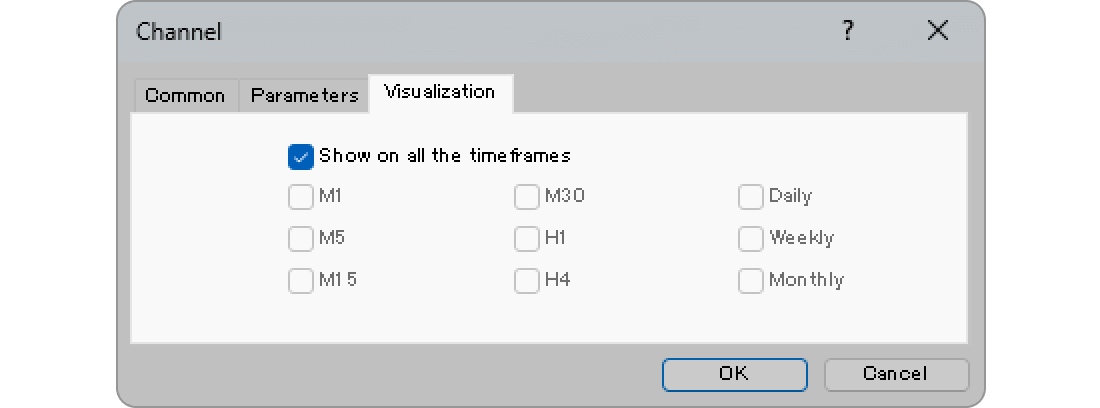
On the "Visualization" tab, you can specify the timeframes to use the equidistant channel with.
Was this article helpful?
0 out of 0 people found this article helpful.
Thank you for your feedback.