MT4/MT5: Draw trendline
EA, indicators & objects (Mobile & tablet)
EA, indicators & objects (Mobile & tablet)

This article was :
published
updated
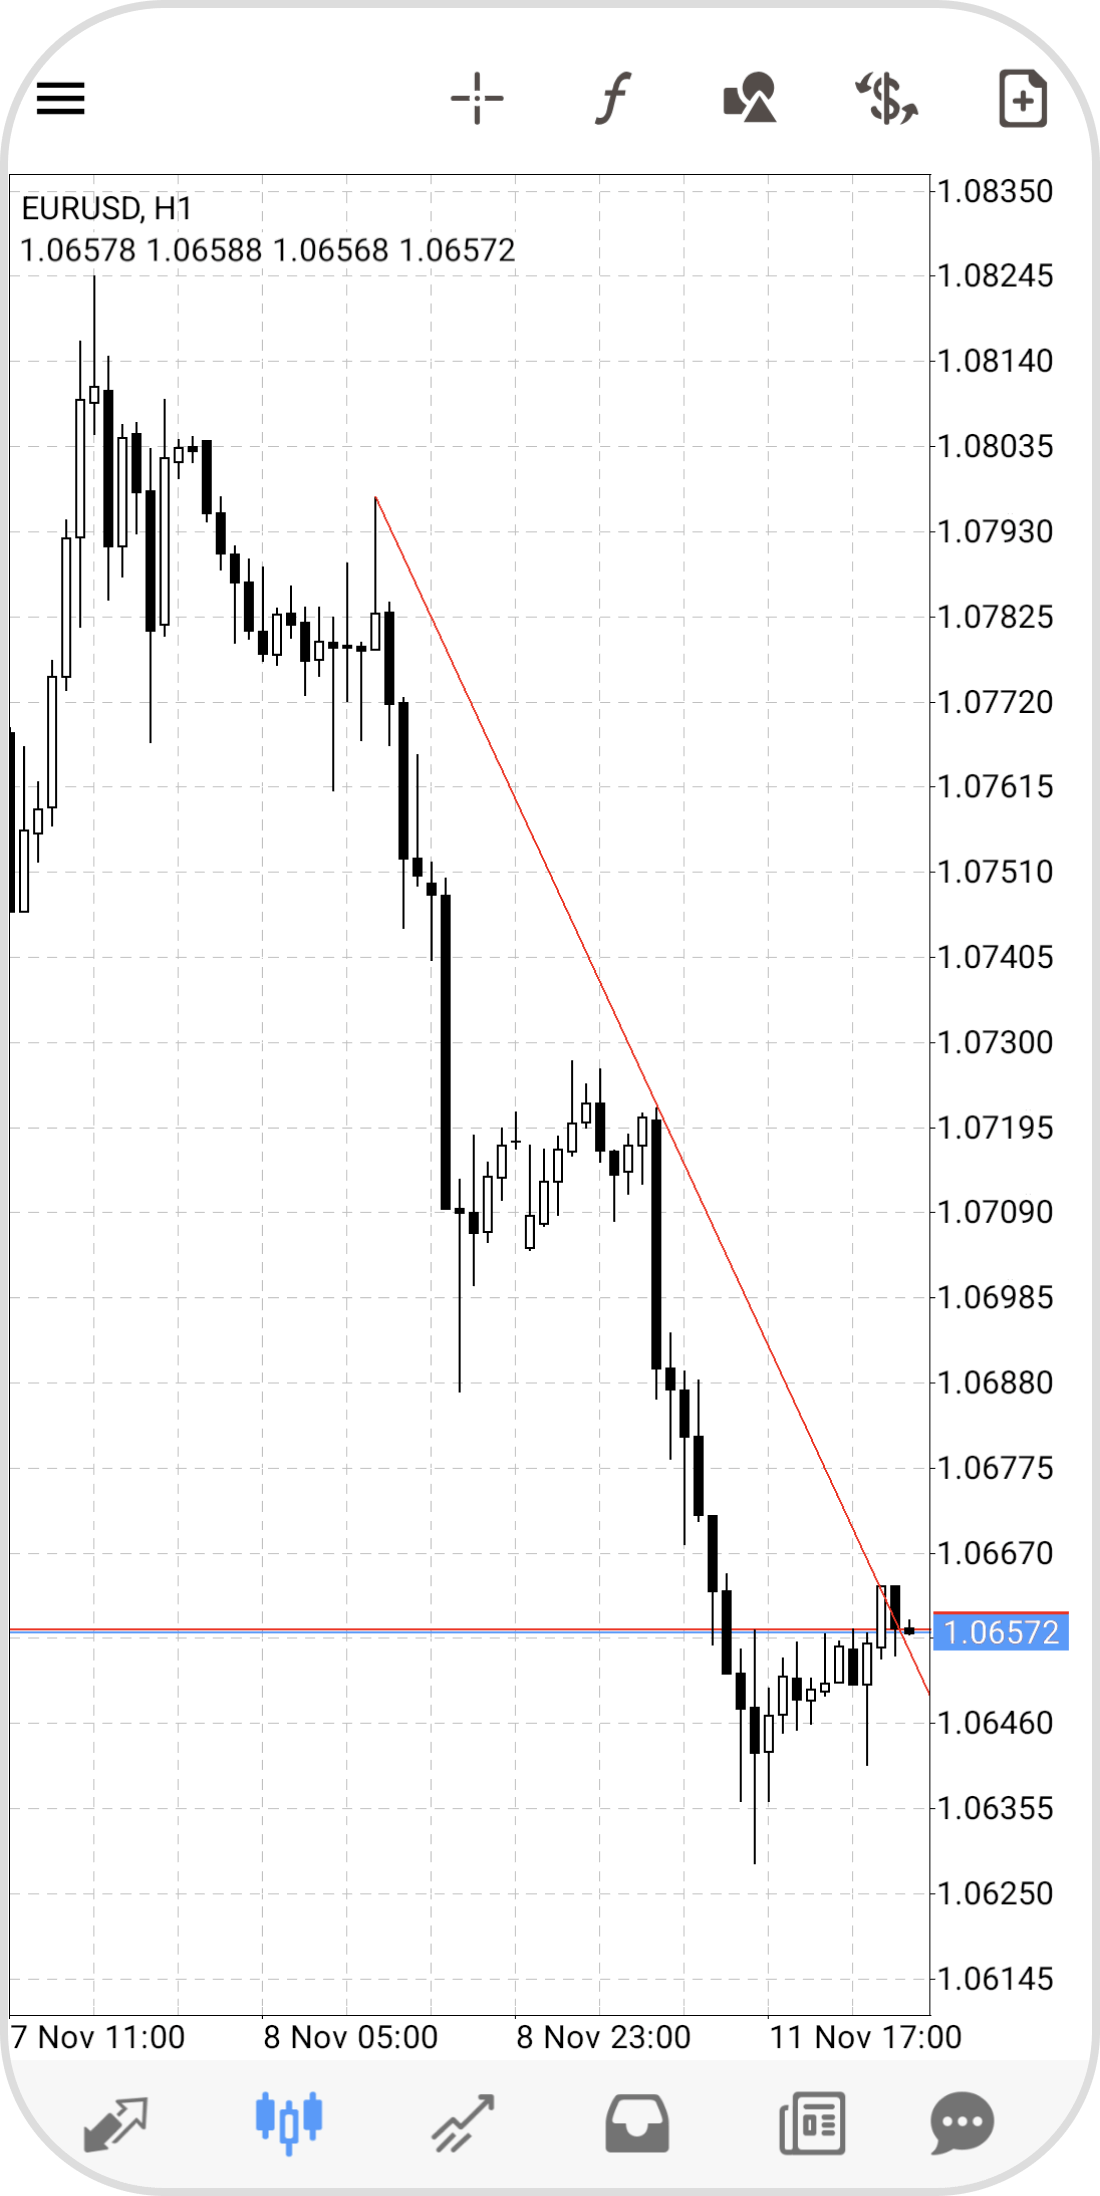
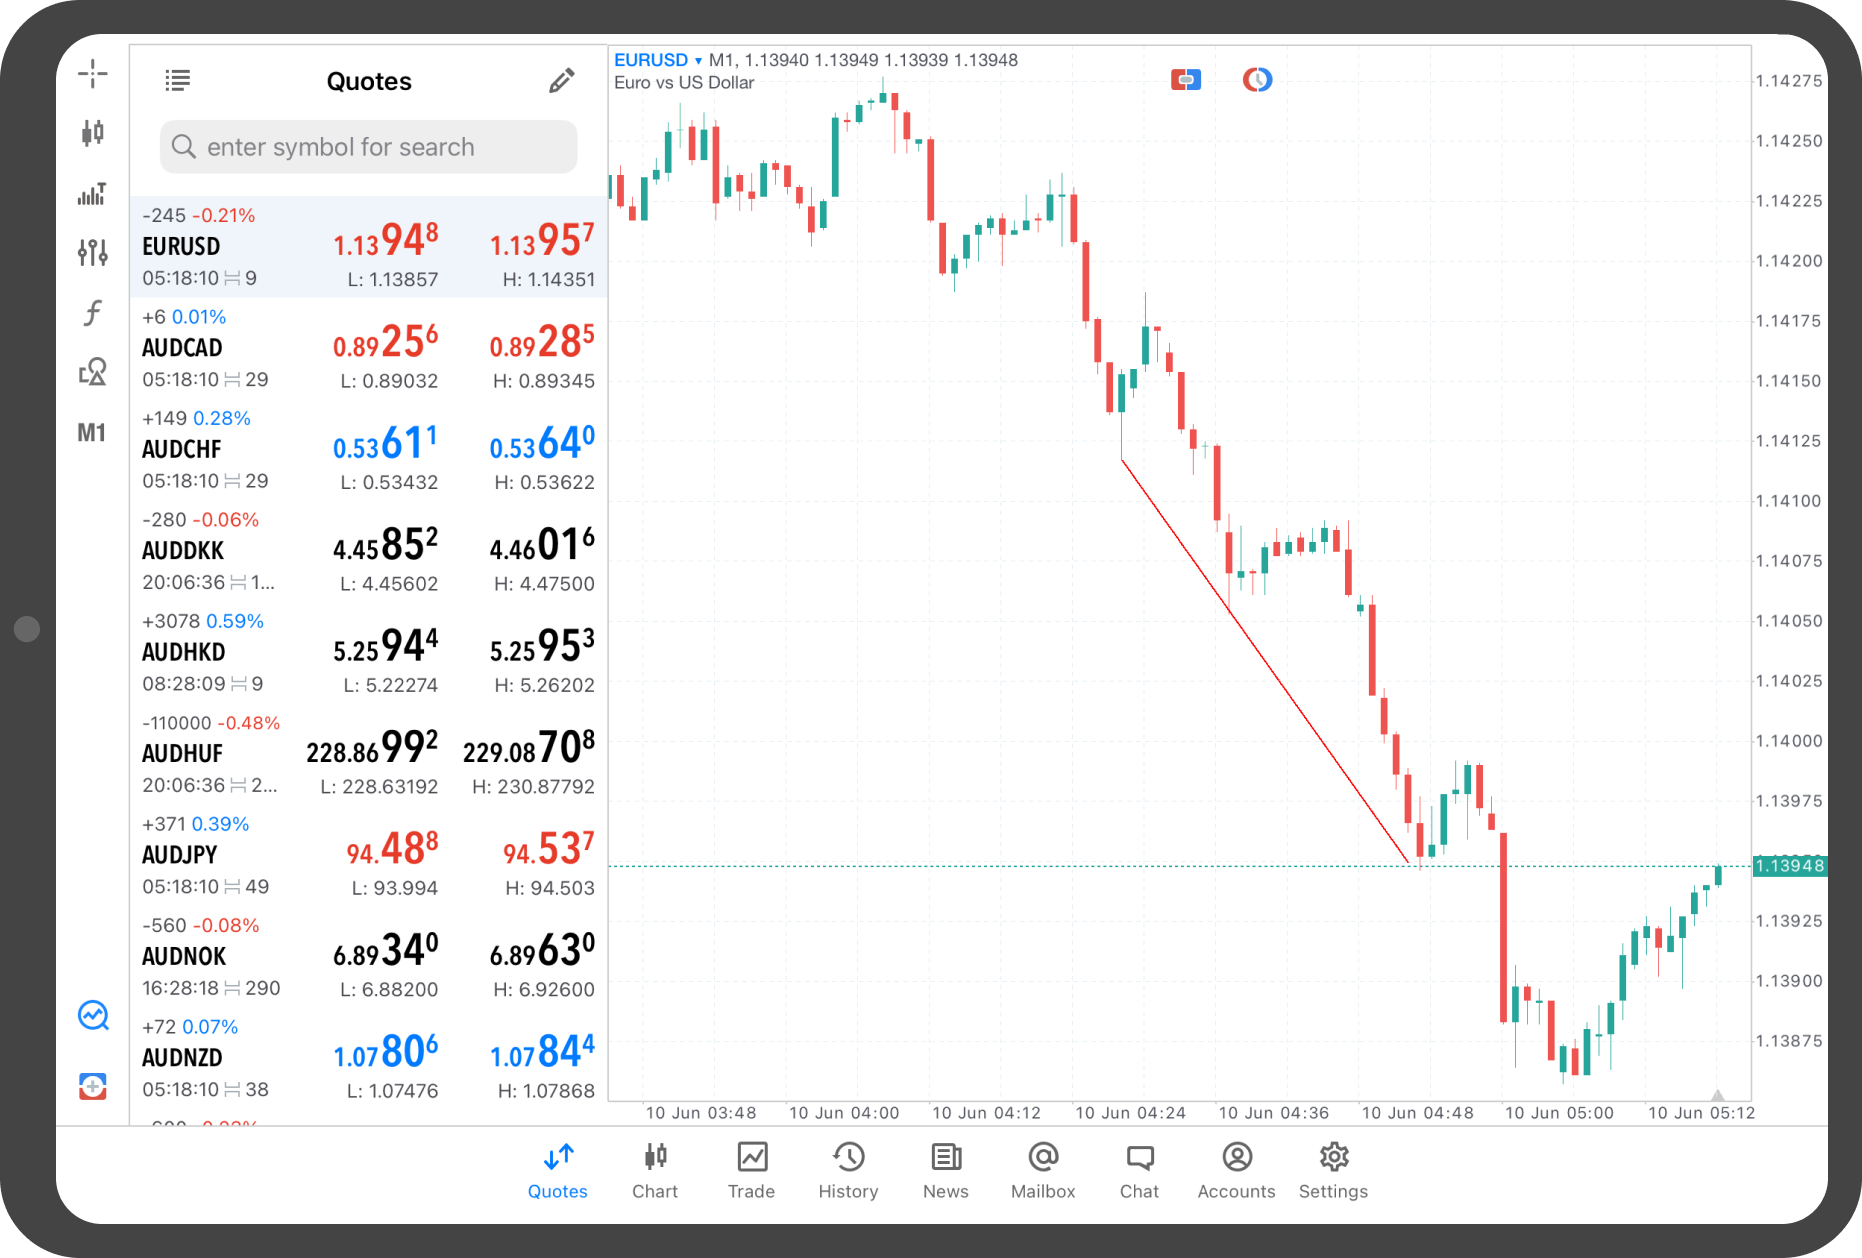
Here we'll look over the steps on how to display a trendline on the chart in MetaTrader4 (MT4) / MetaTrader5 (MT5) app for Android and iOS mobile devices. Trendline connects the low, high, or close prices to read trend strength or support and resistance lines. Combining trendlines allows for chart pattern analysis, which focuses on chart shapes.
| Related article: | Draw trendline by angle |
| Draw cycle lines |
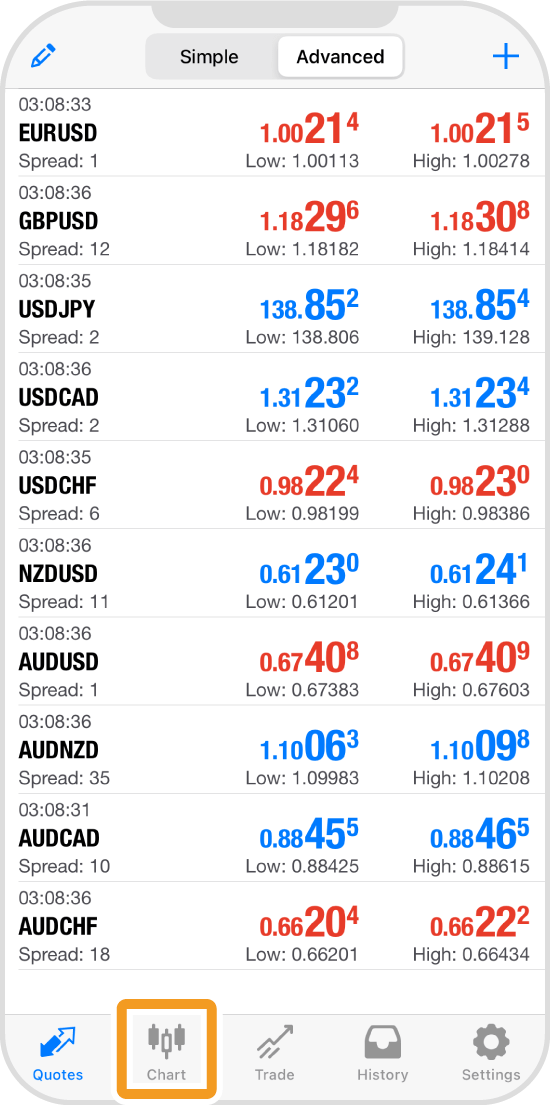
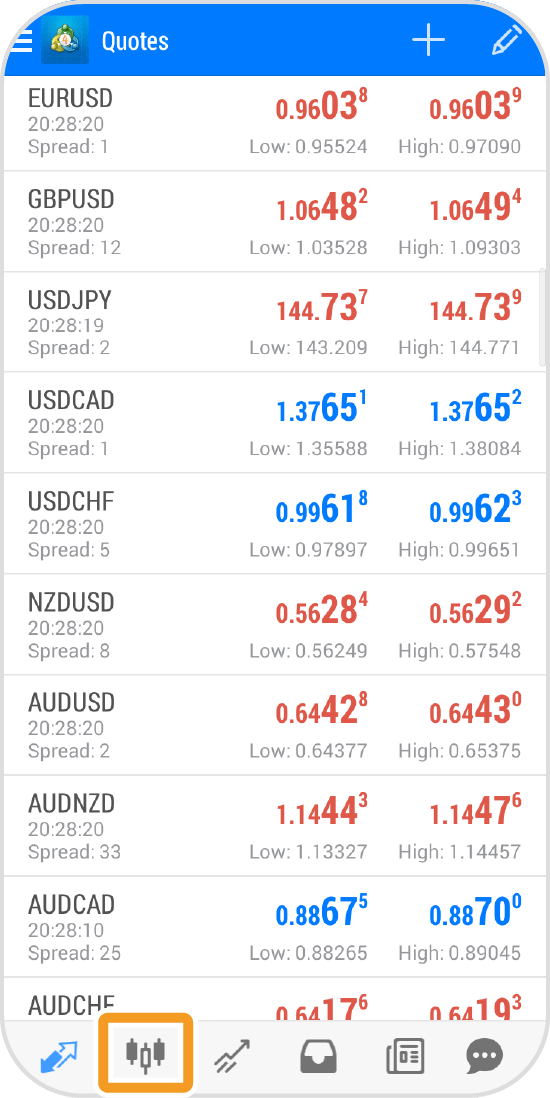
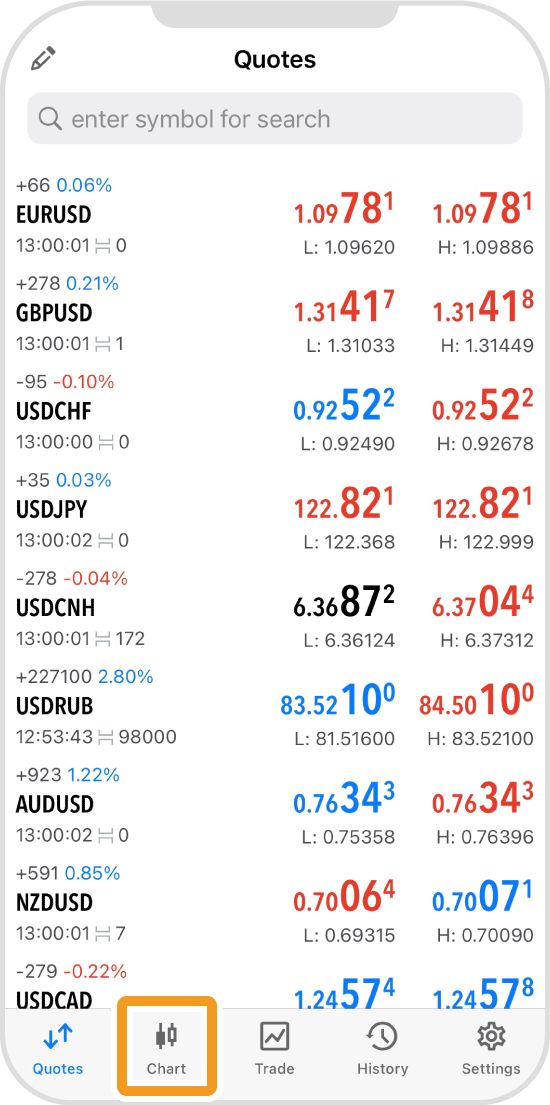
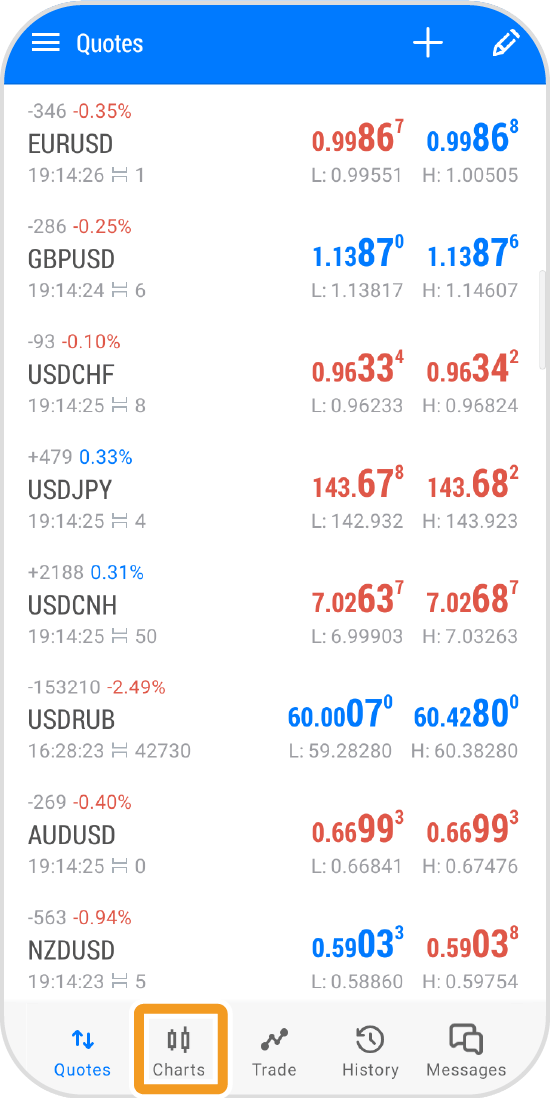
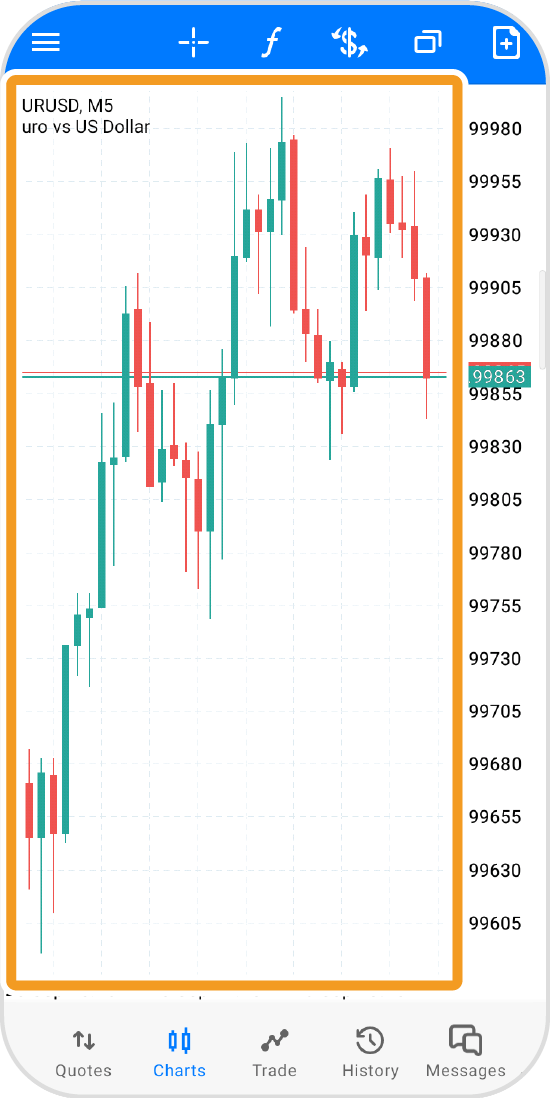
Tap "Chart" on the bottom navigation bar.
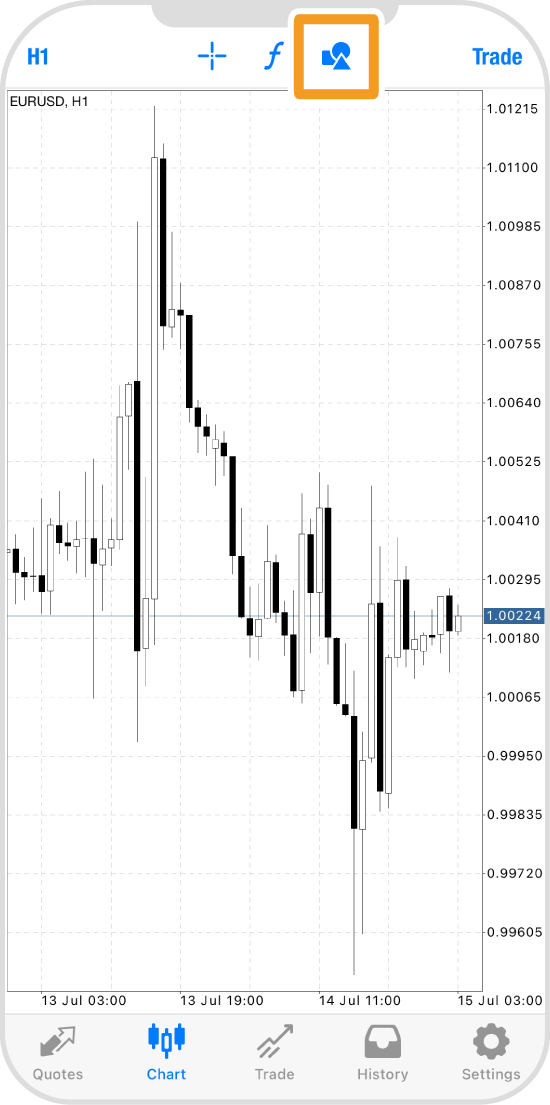
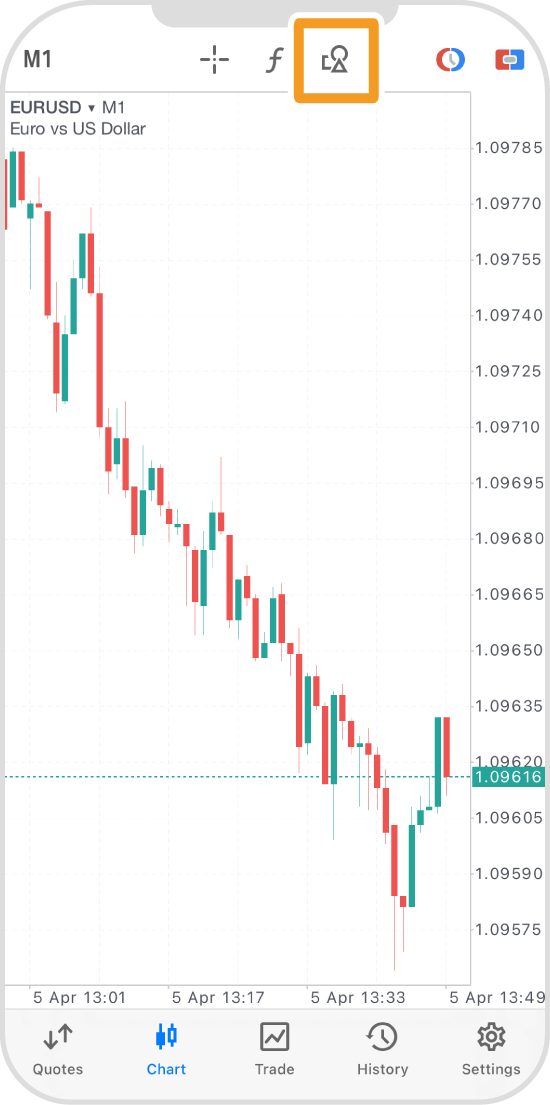
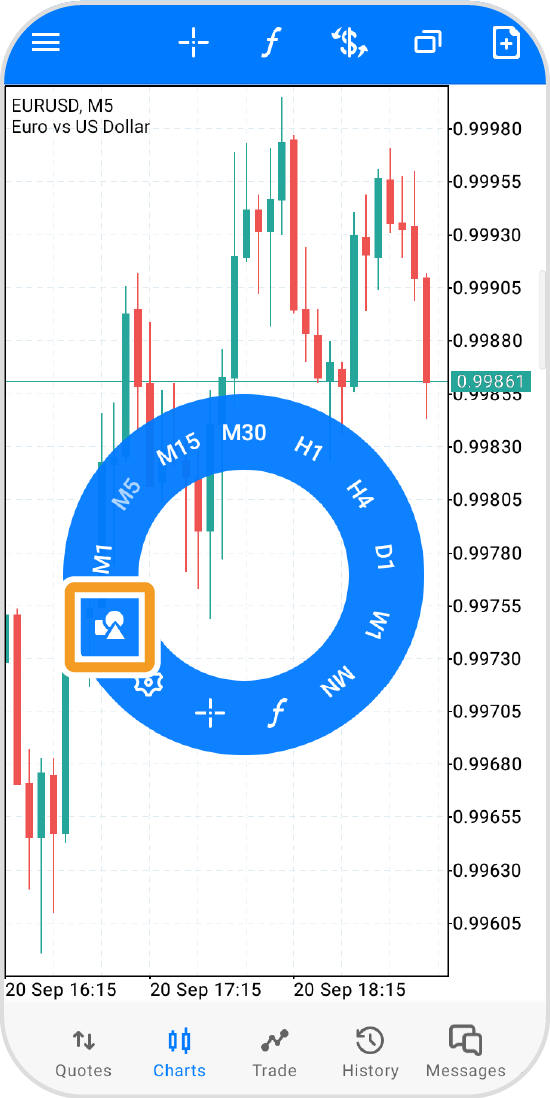
Tap the "Objects" icon at the top.
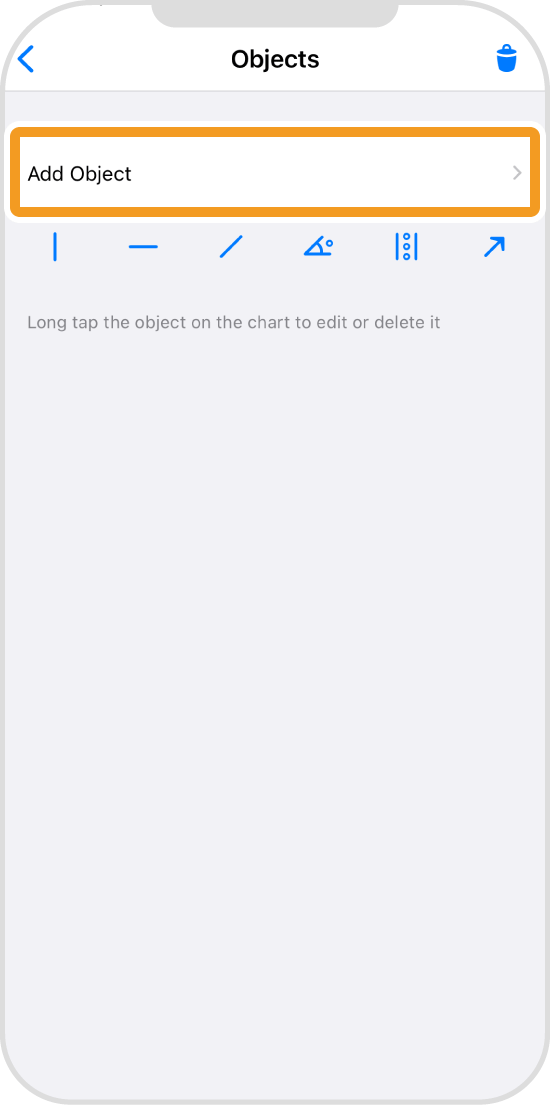
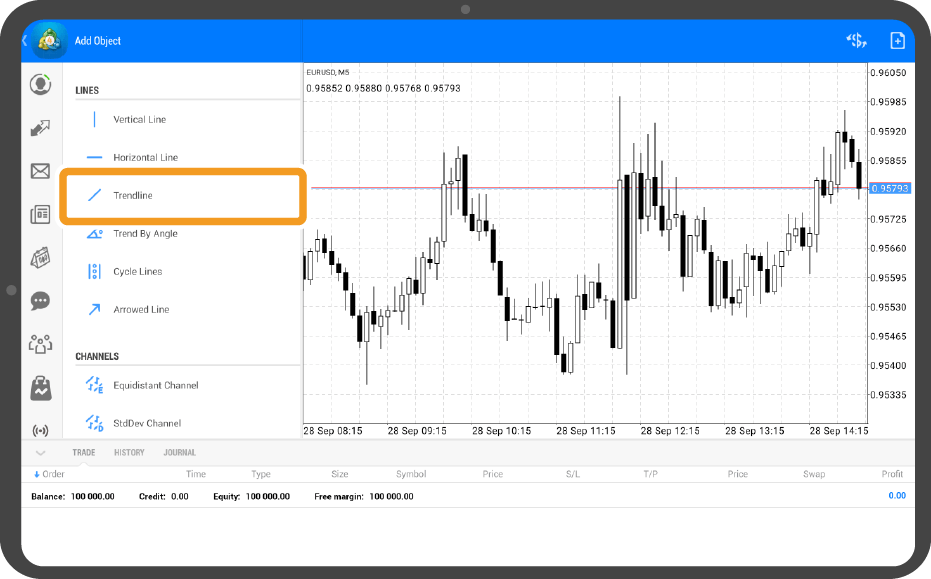
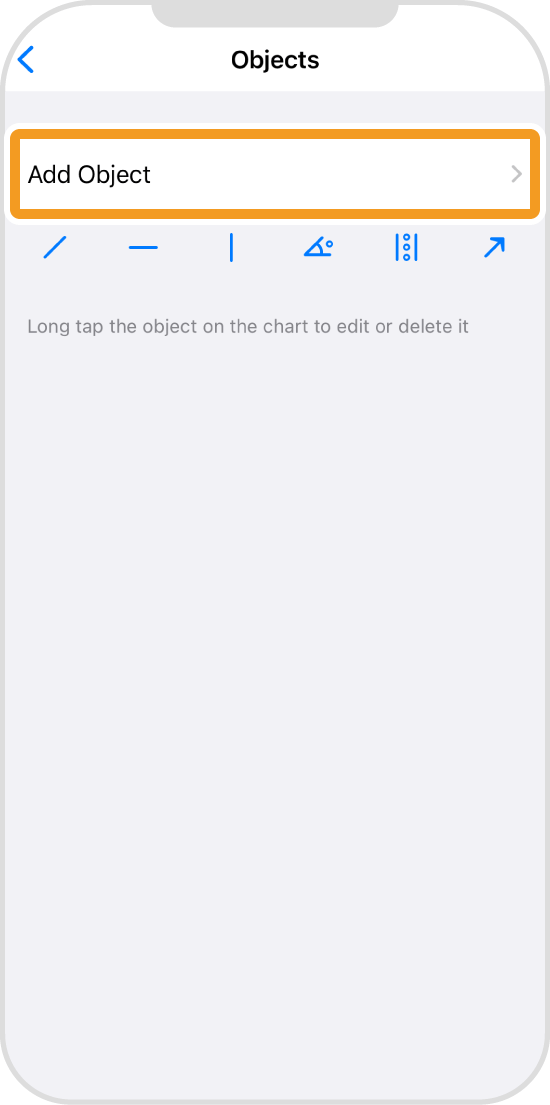
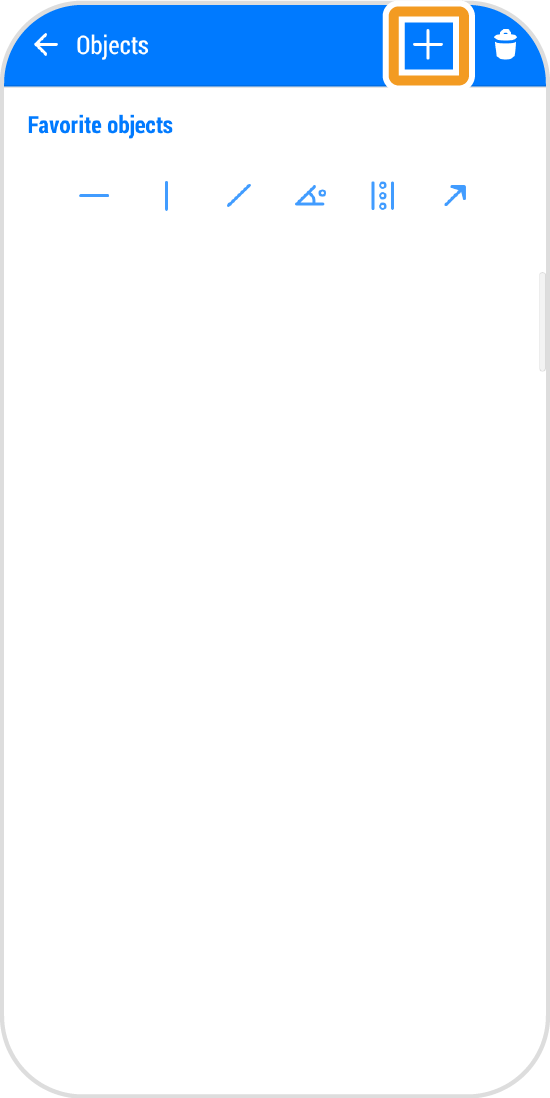
Tap "Add Object".
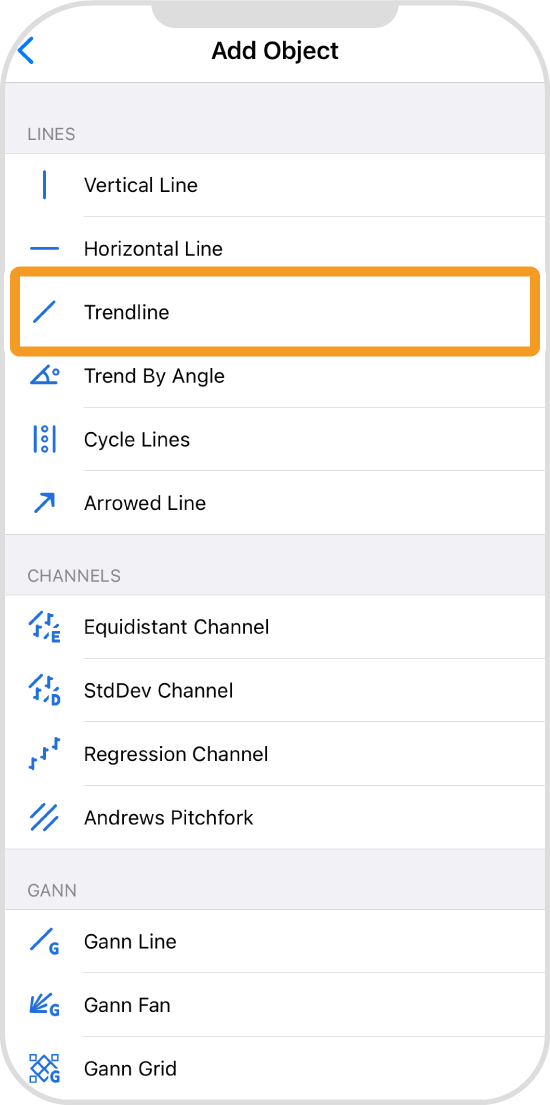
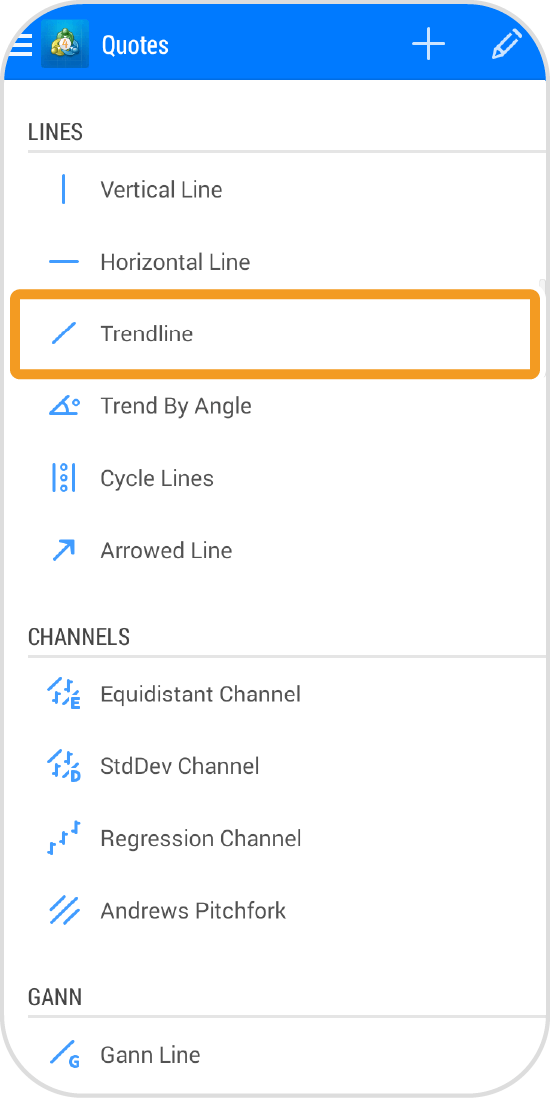
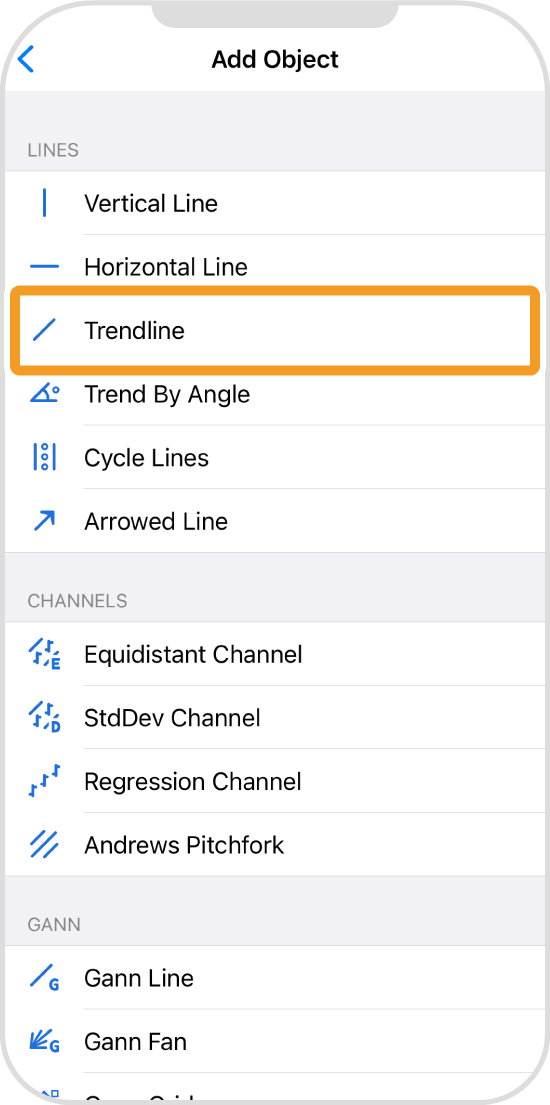
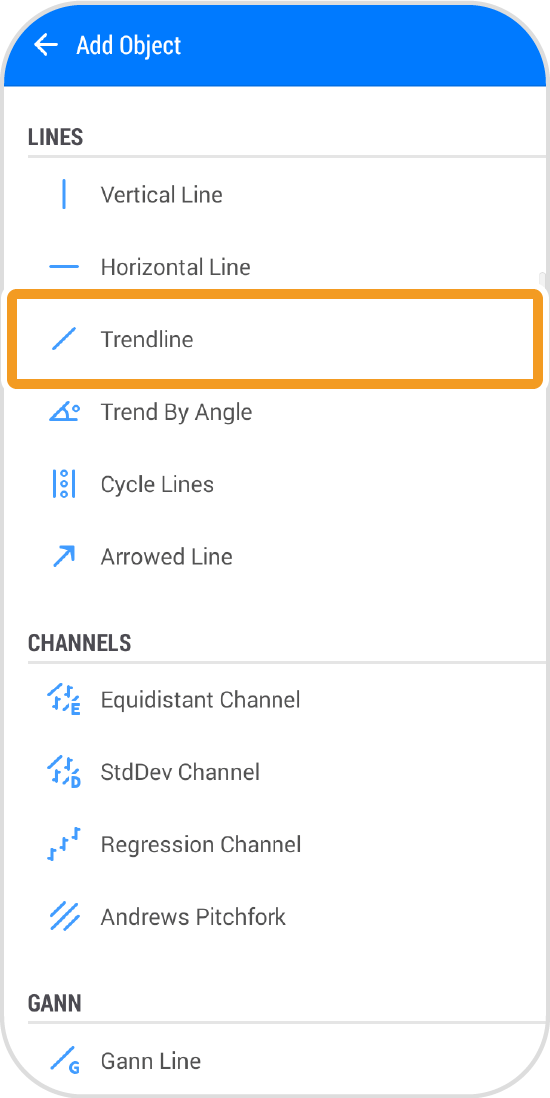
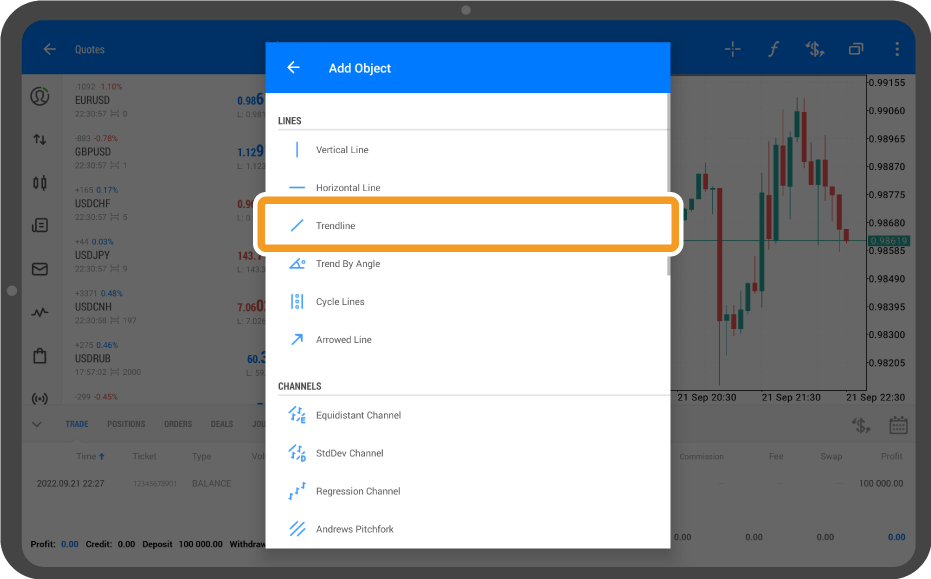
Tap "Trendline".
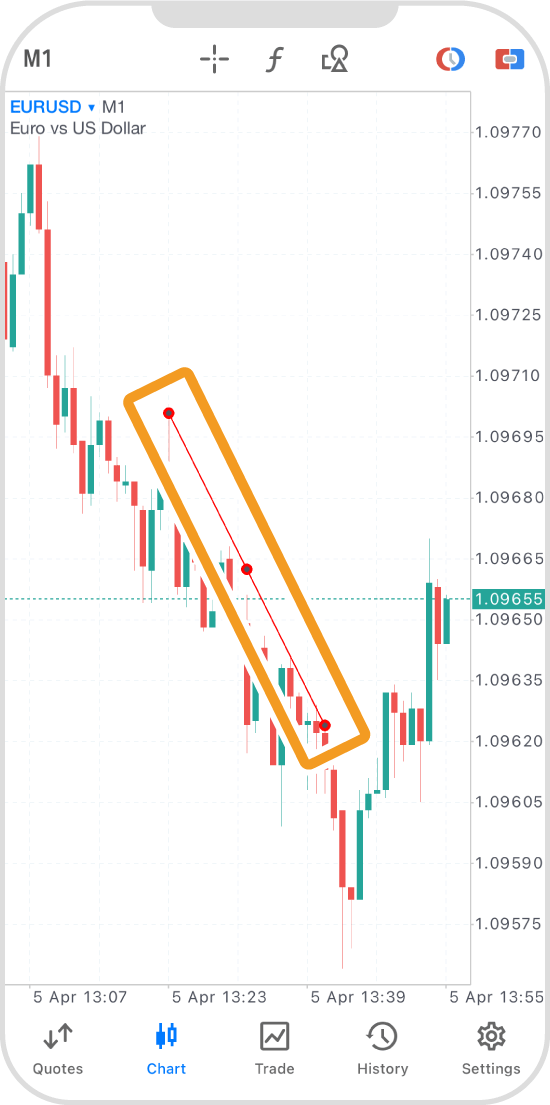
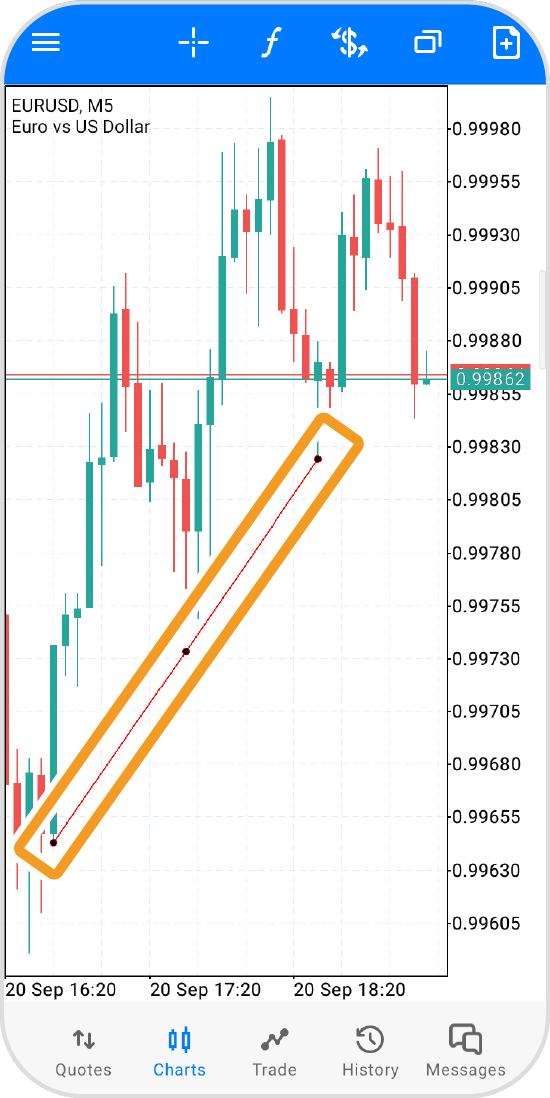
Tap at the starting point and drag to the end point.
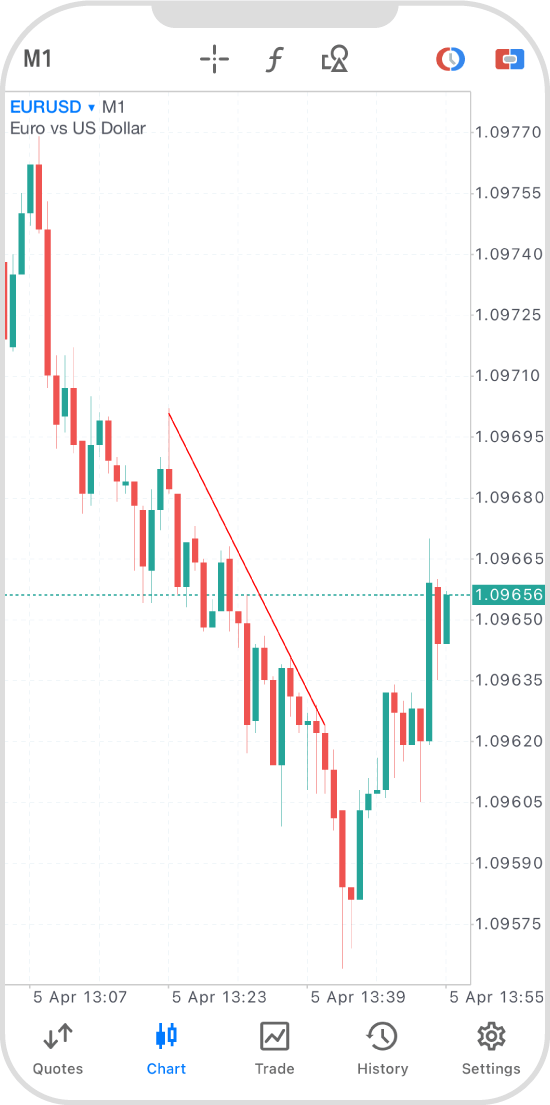
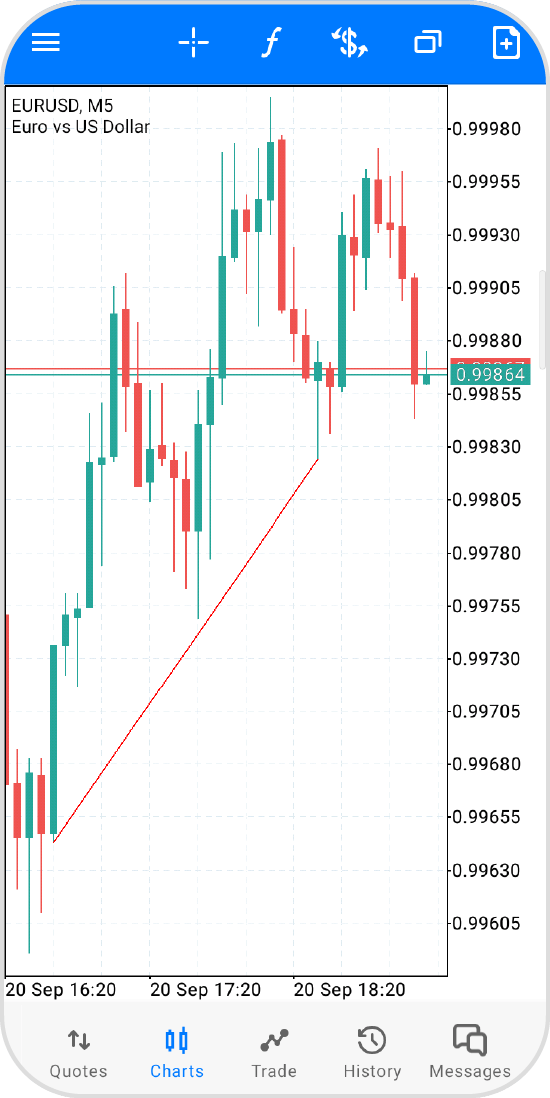
To fix the trendline, tap on the line to hide the dots.
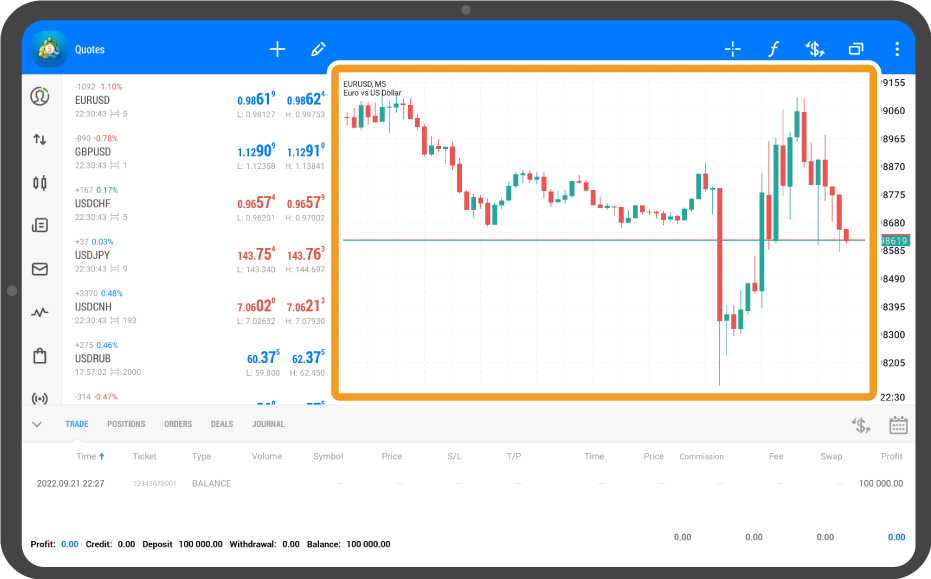
Tap "Chart" on the bottom navigation bar.
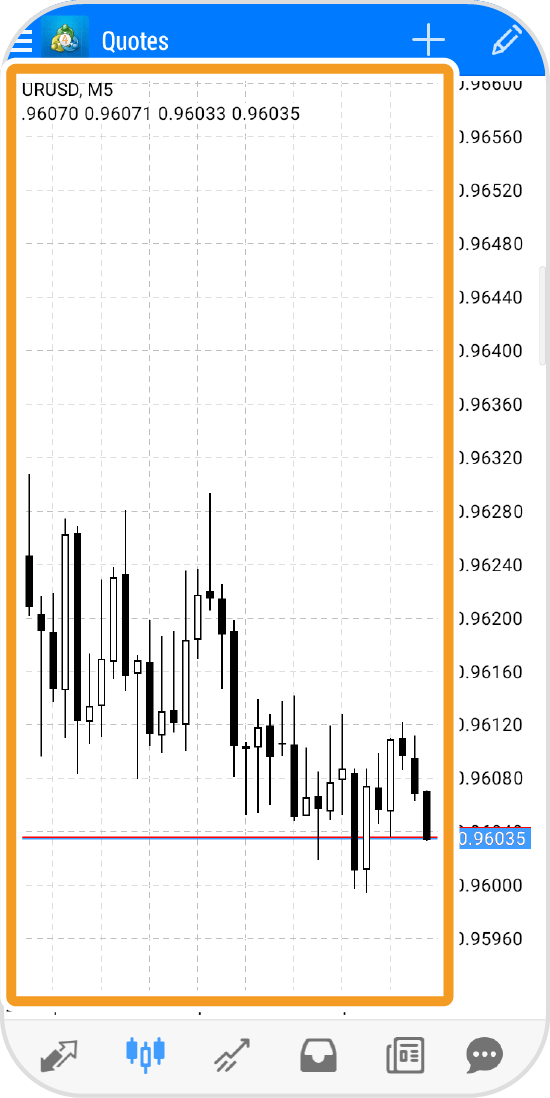
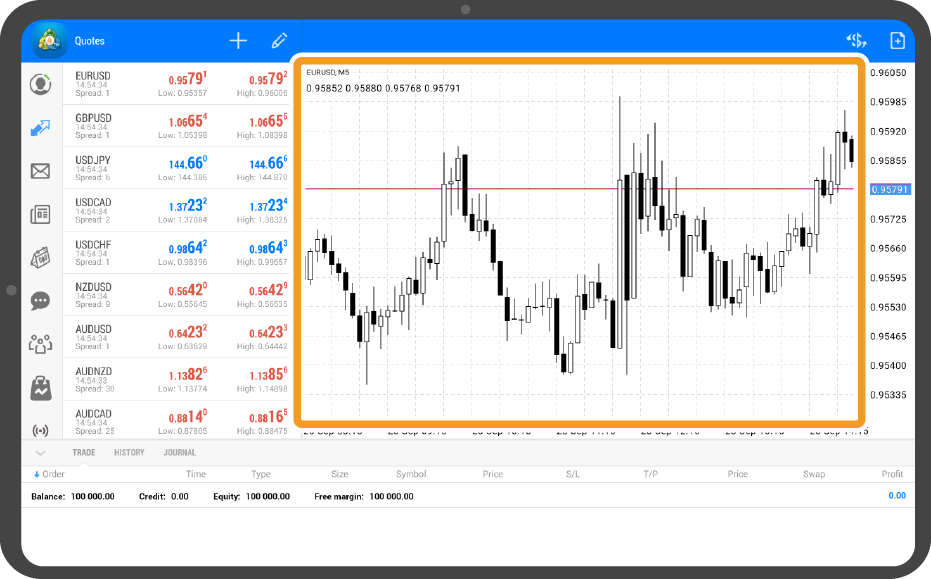
Tap on the chart.
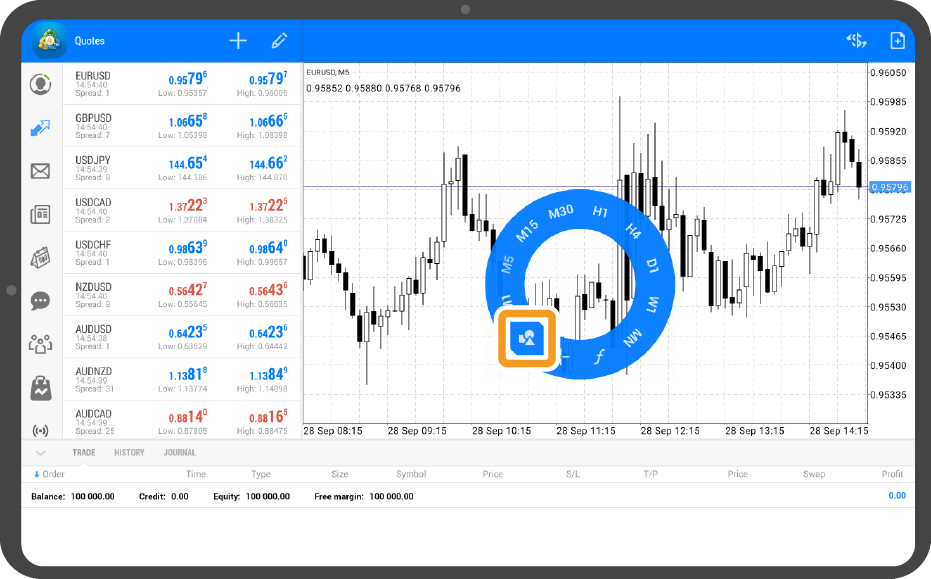
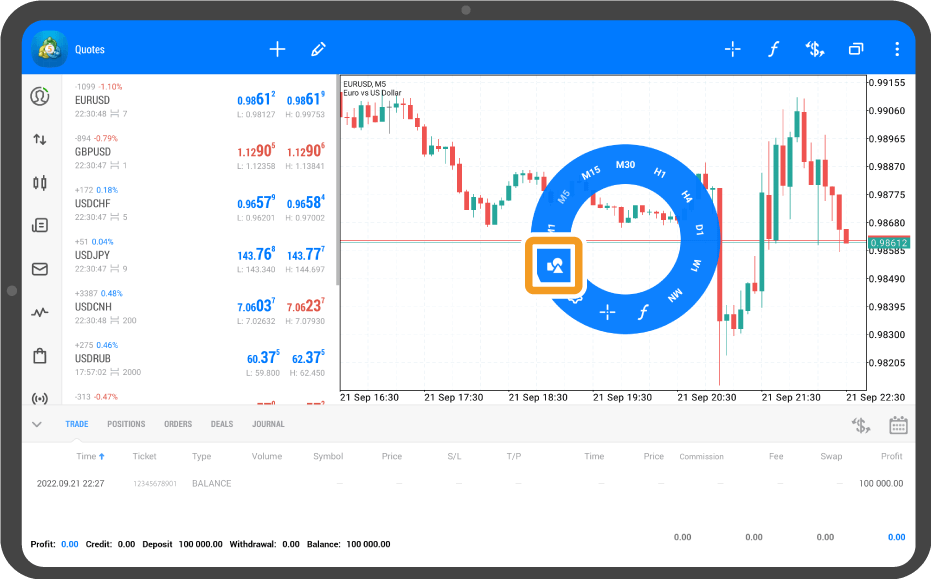
Tap the "Objects" icon.
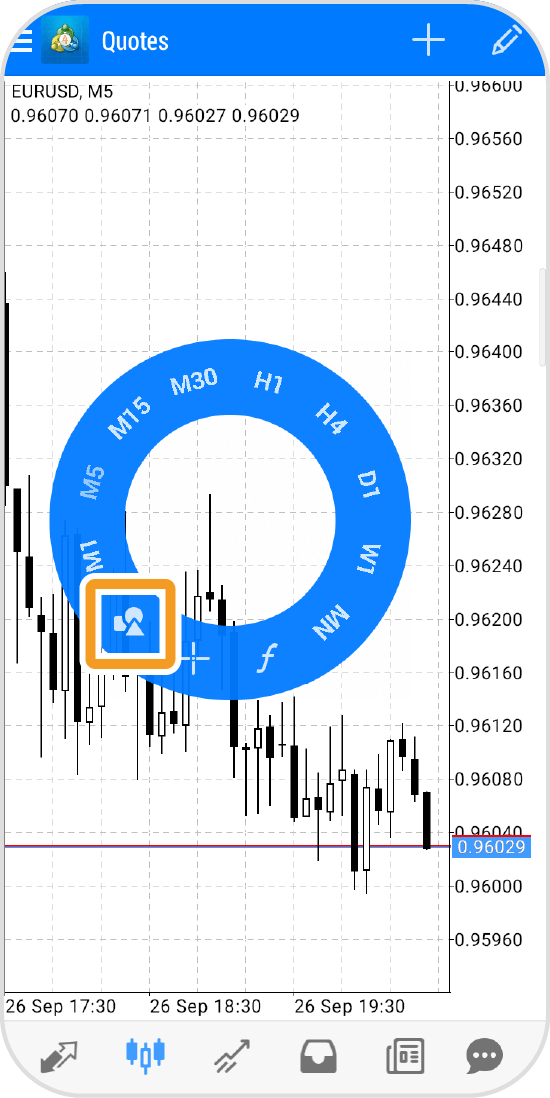
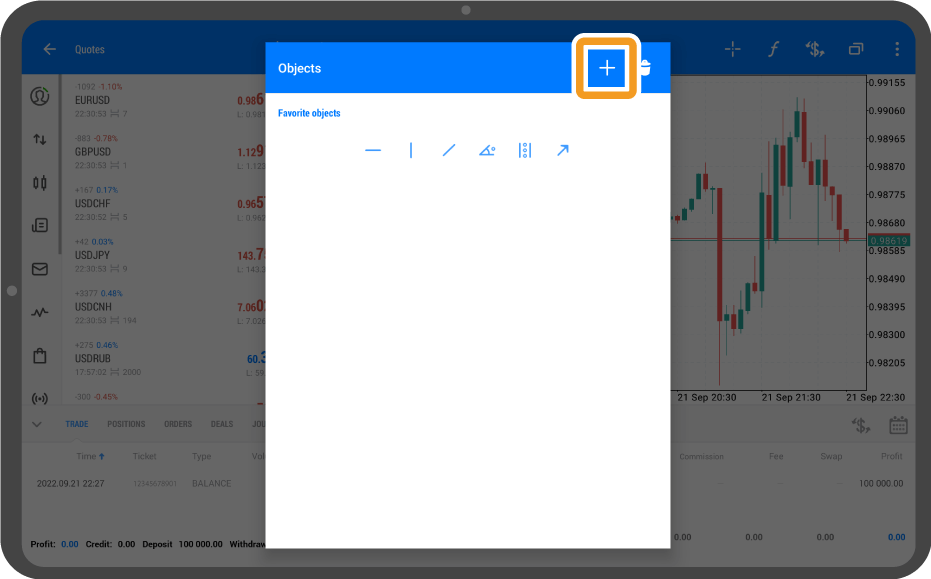
Tap "+" in the top right corner.
Tap at the starting point and drag to the end point.
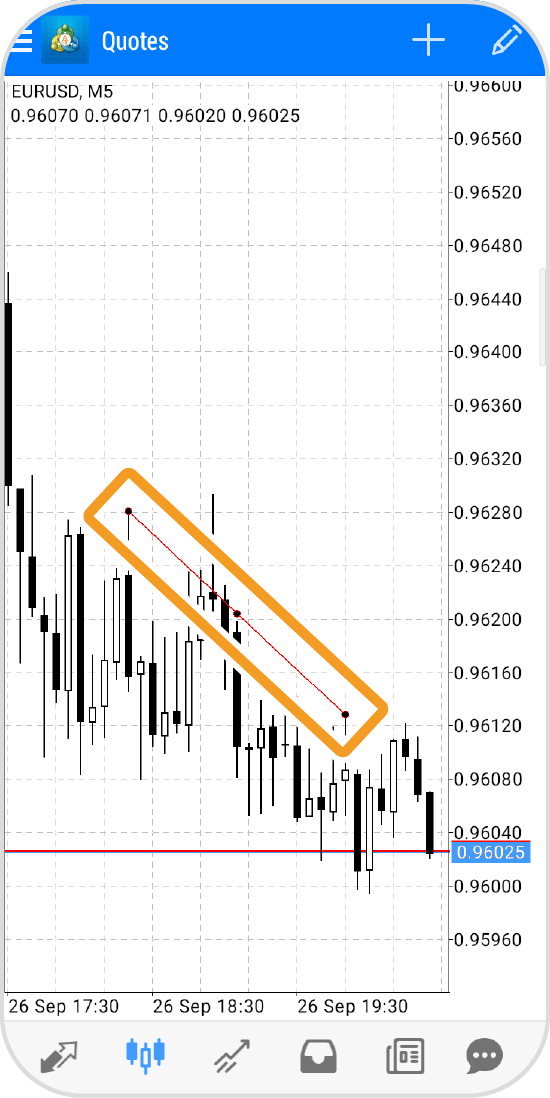
Tap at the starting point of the trendline and drag to the end point.
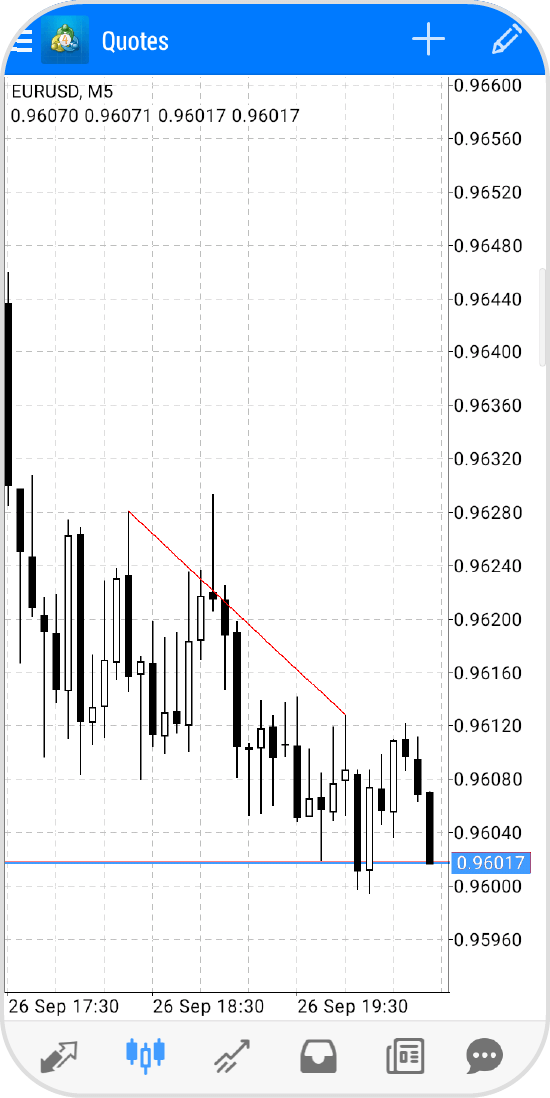
To fix the trendline, tap around it and hide the black dots.
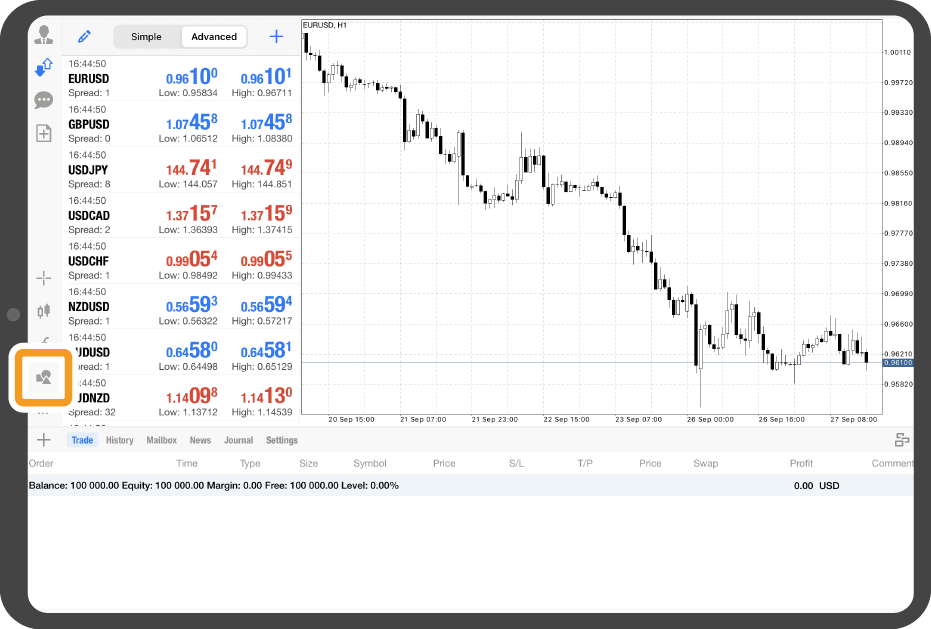
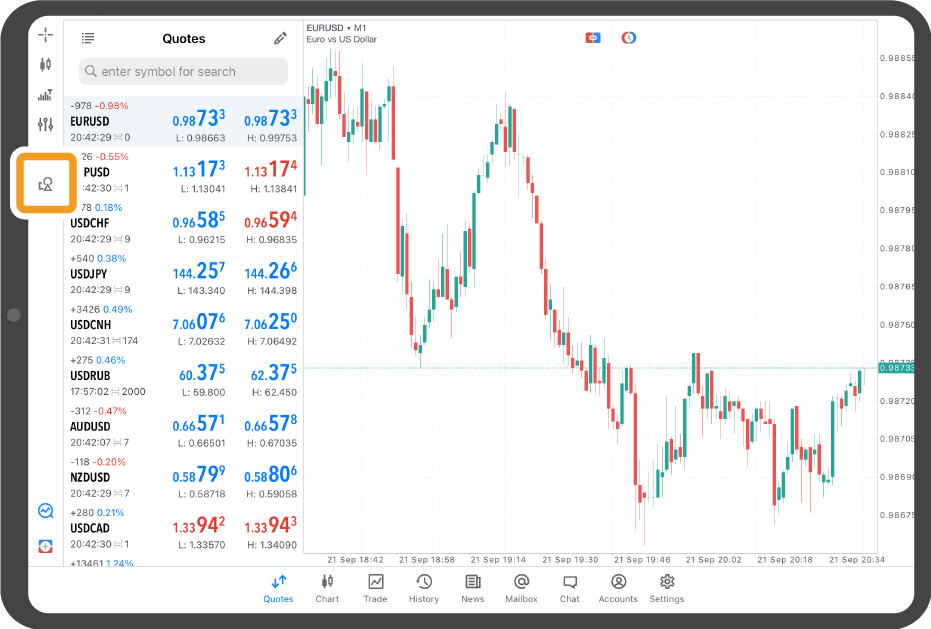
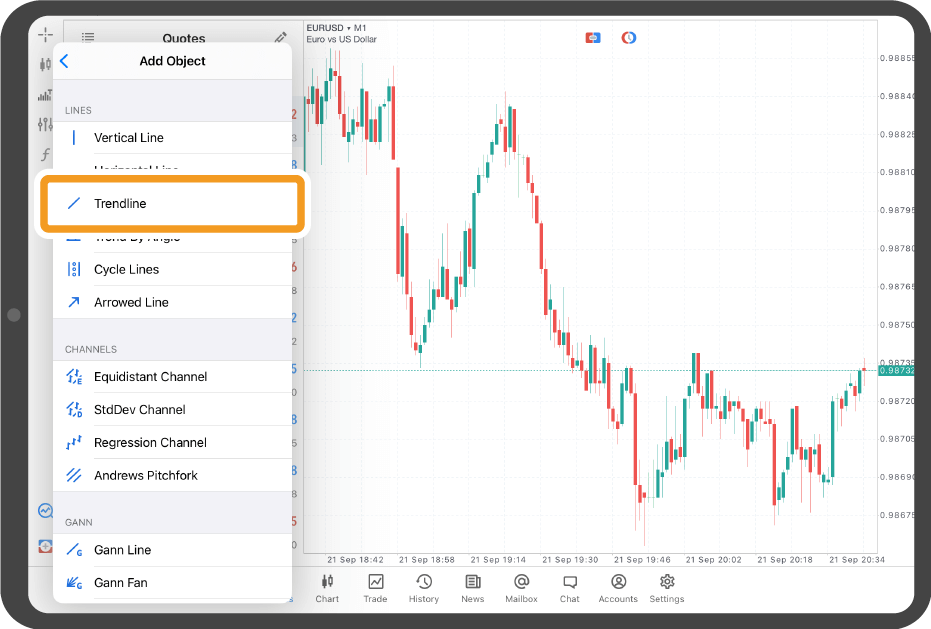
Tap the "Objects" icon on the left.
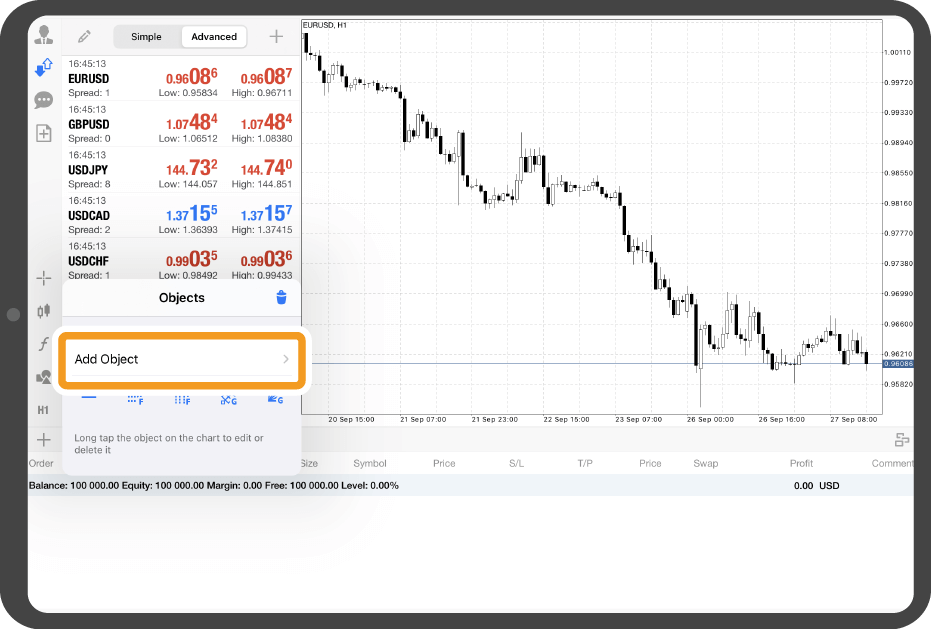
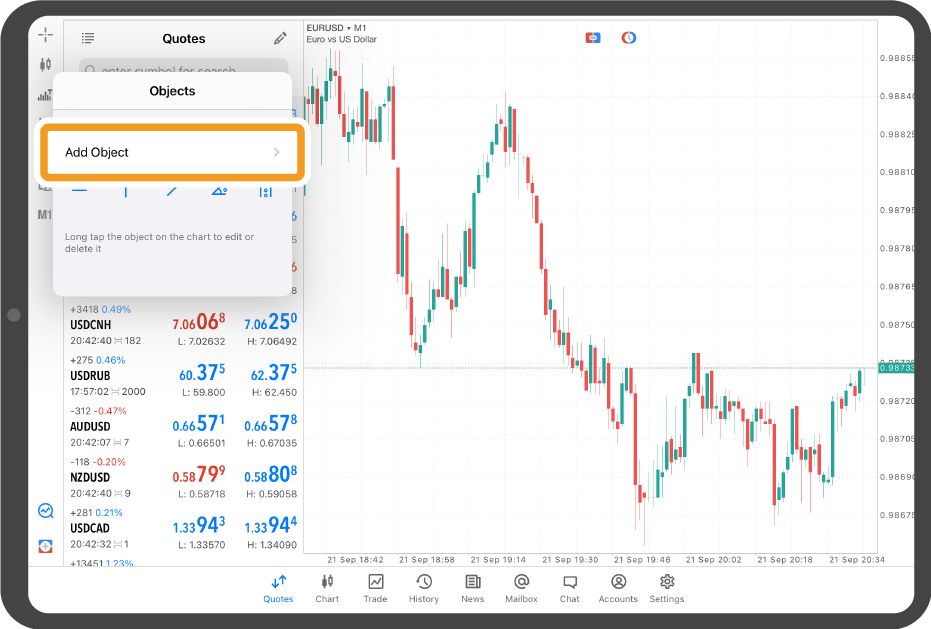
Tap "Add Object".
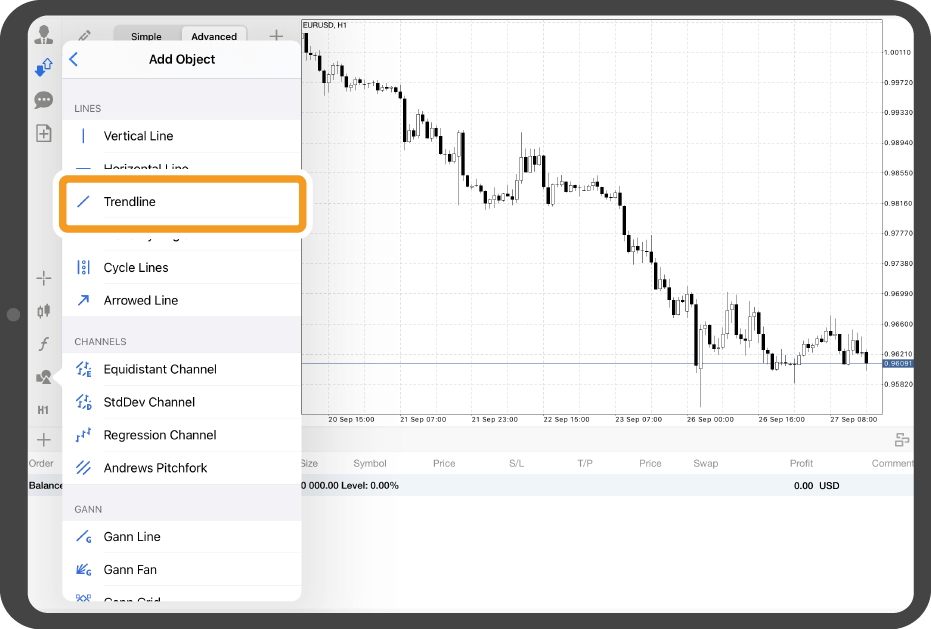
Tap "Trendline".
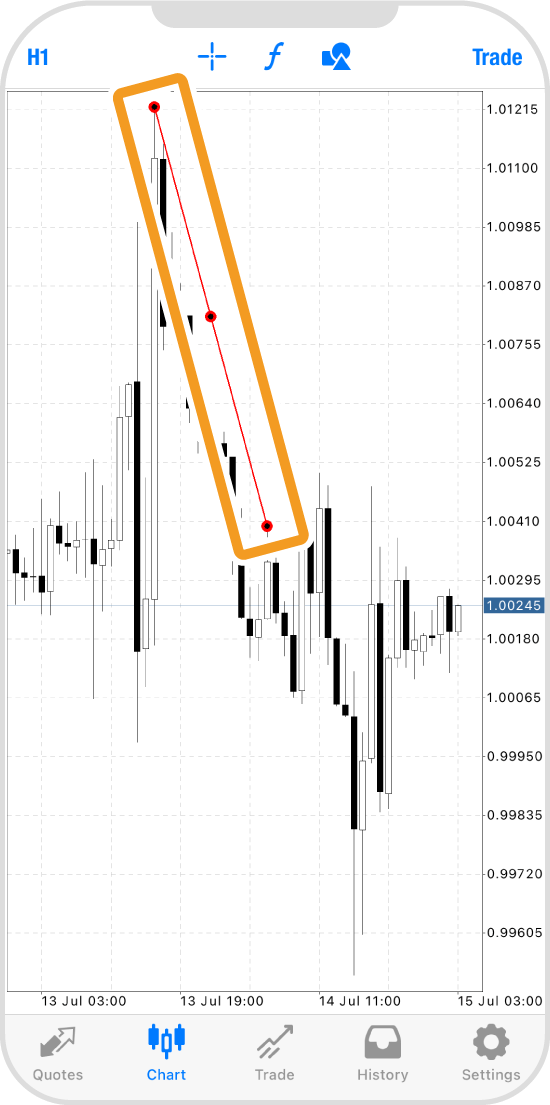
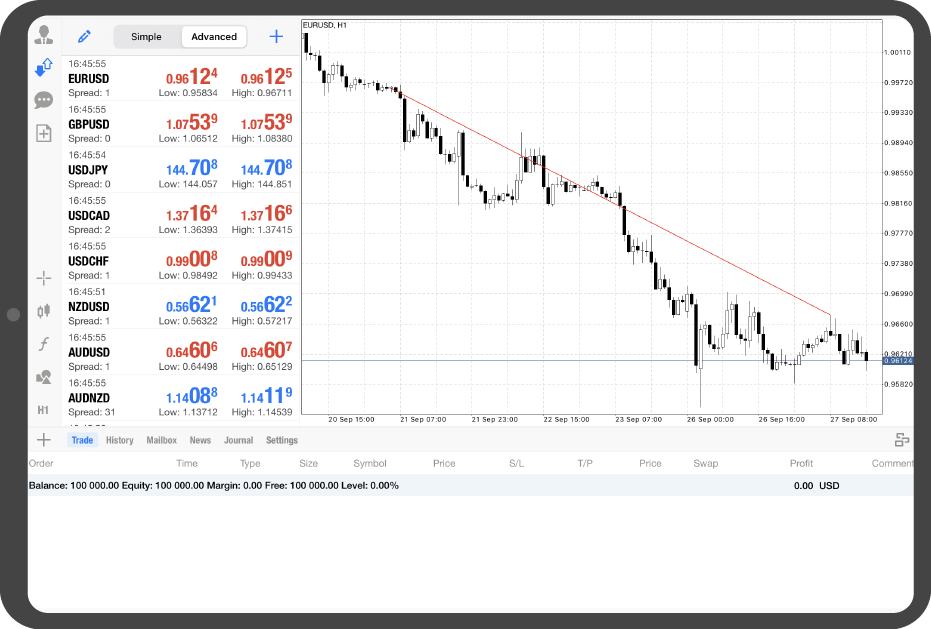
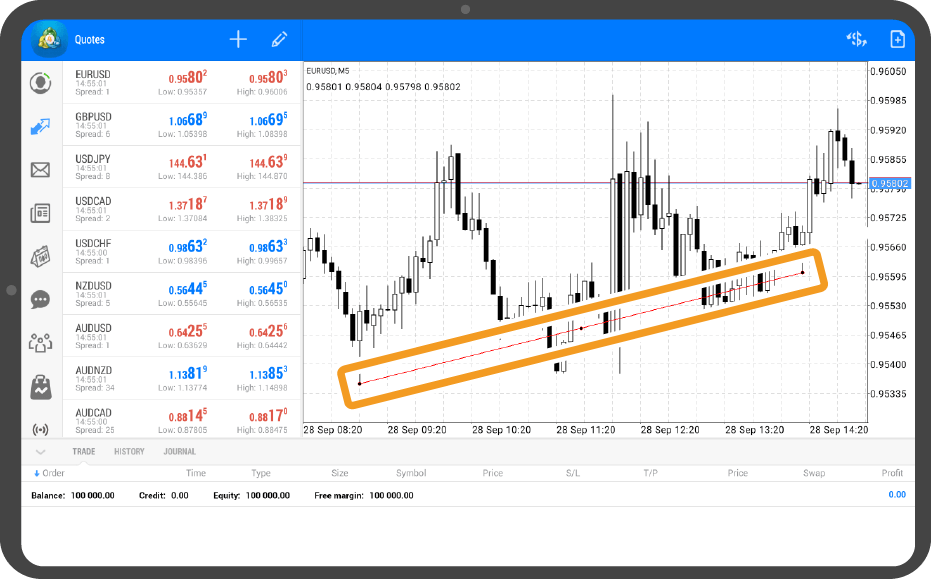
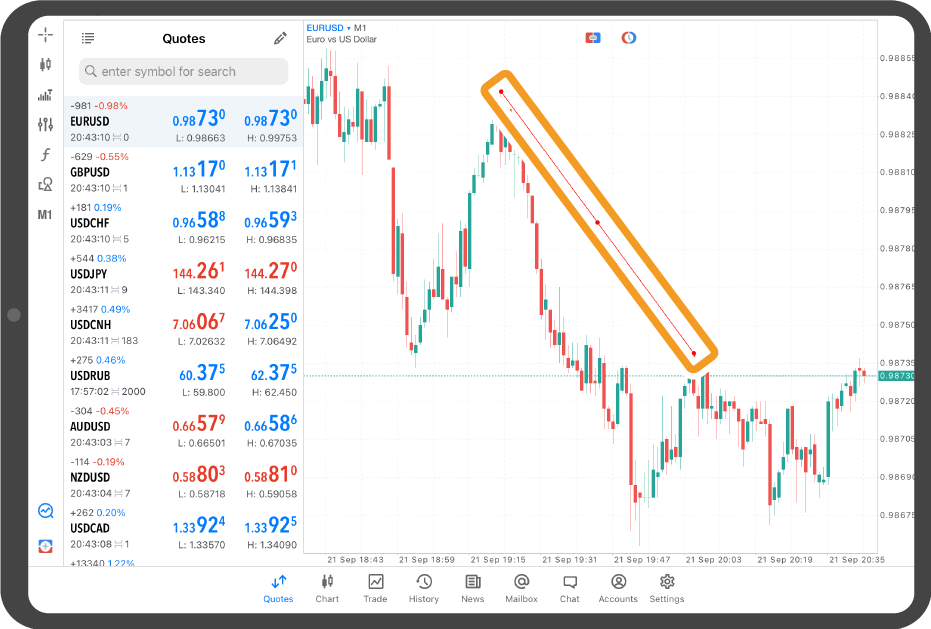
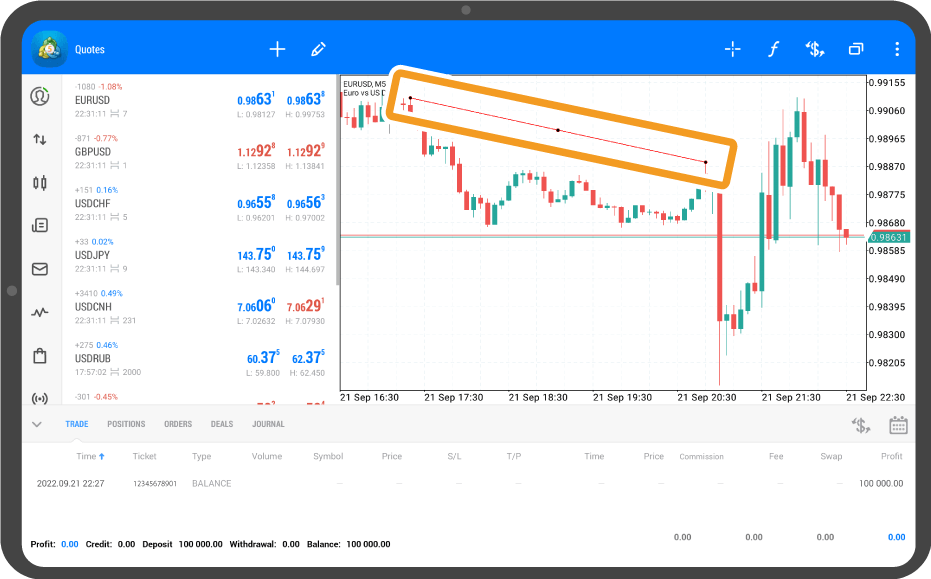
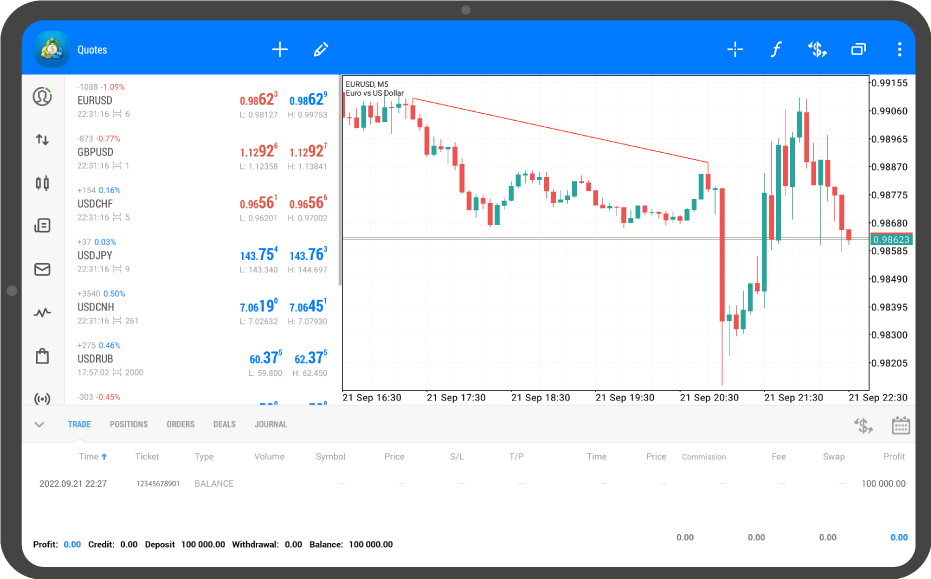
Tap at the starting point of the trendline and drag to the end point.
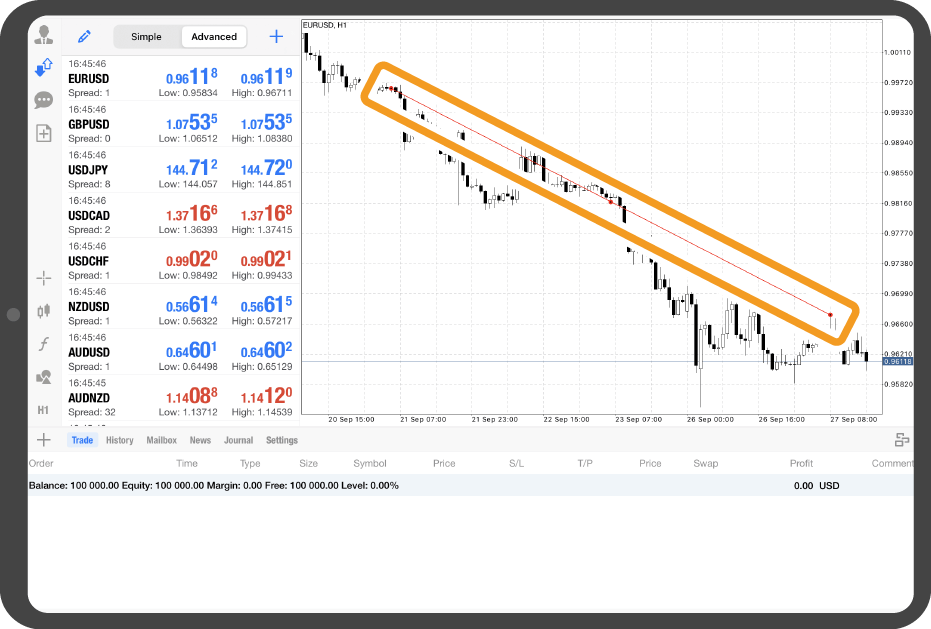
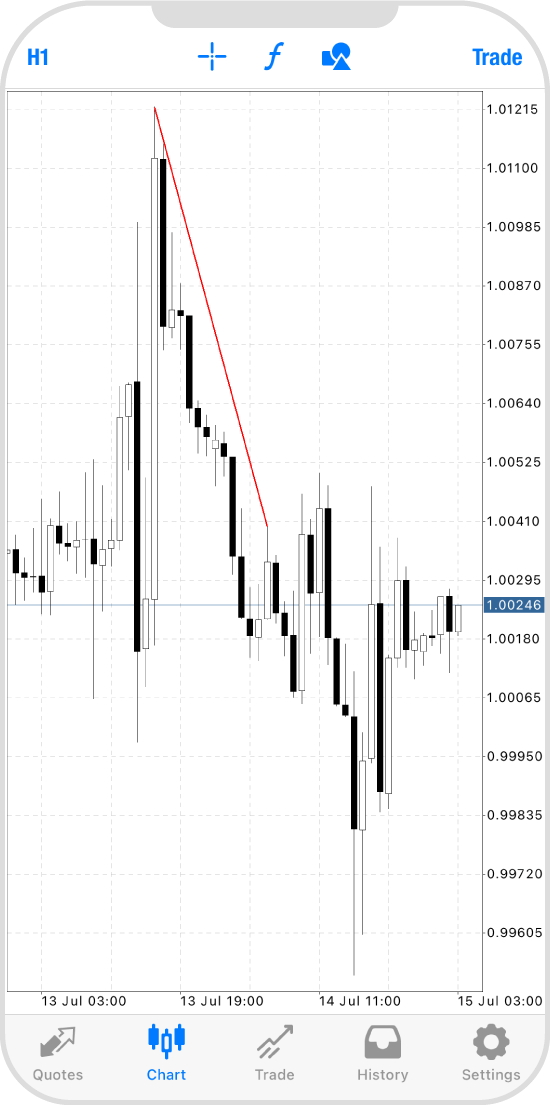
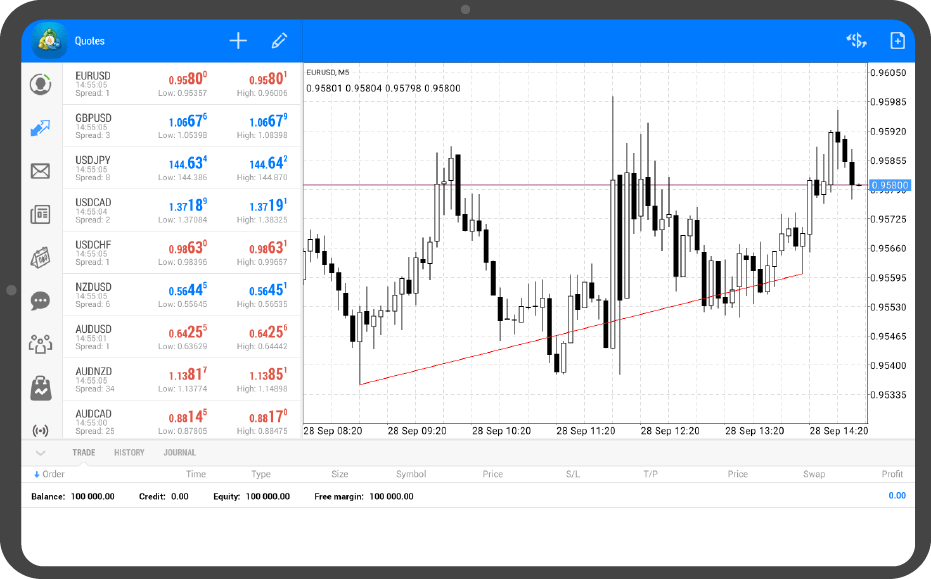
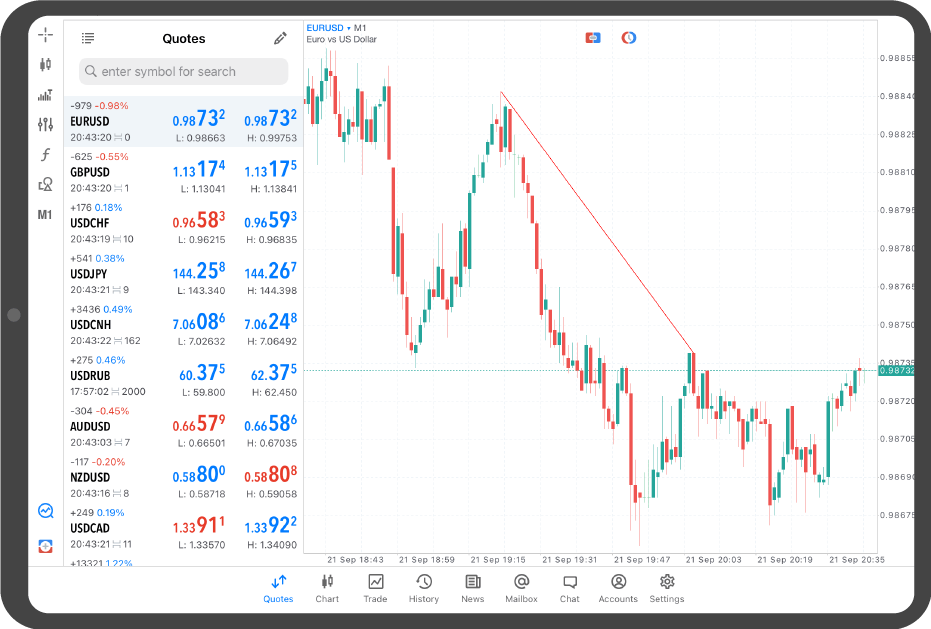
To fix the trendline, tap around it and hide the red dots.
Tap on the chart.
Tap the "Objects" icon.
The list of objects on the chart will be displayed. Tap "+" in the top right corner.
Tap at the starting point and drag to the end point.
Tap at the starting point of the trendline and drag to the end point.
To fix the trendline, tap around it and hide the black dots.
Tap "Chart" on the bottom navigation bar.
Tap the "Objects" icon at the top.
Tap "Add Object".
Tap "Trendline".
Tap at the starting point and drag to the end point.
In the menu that appears after swiping, you can also change the line's color, thickness, and style.
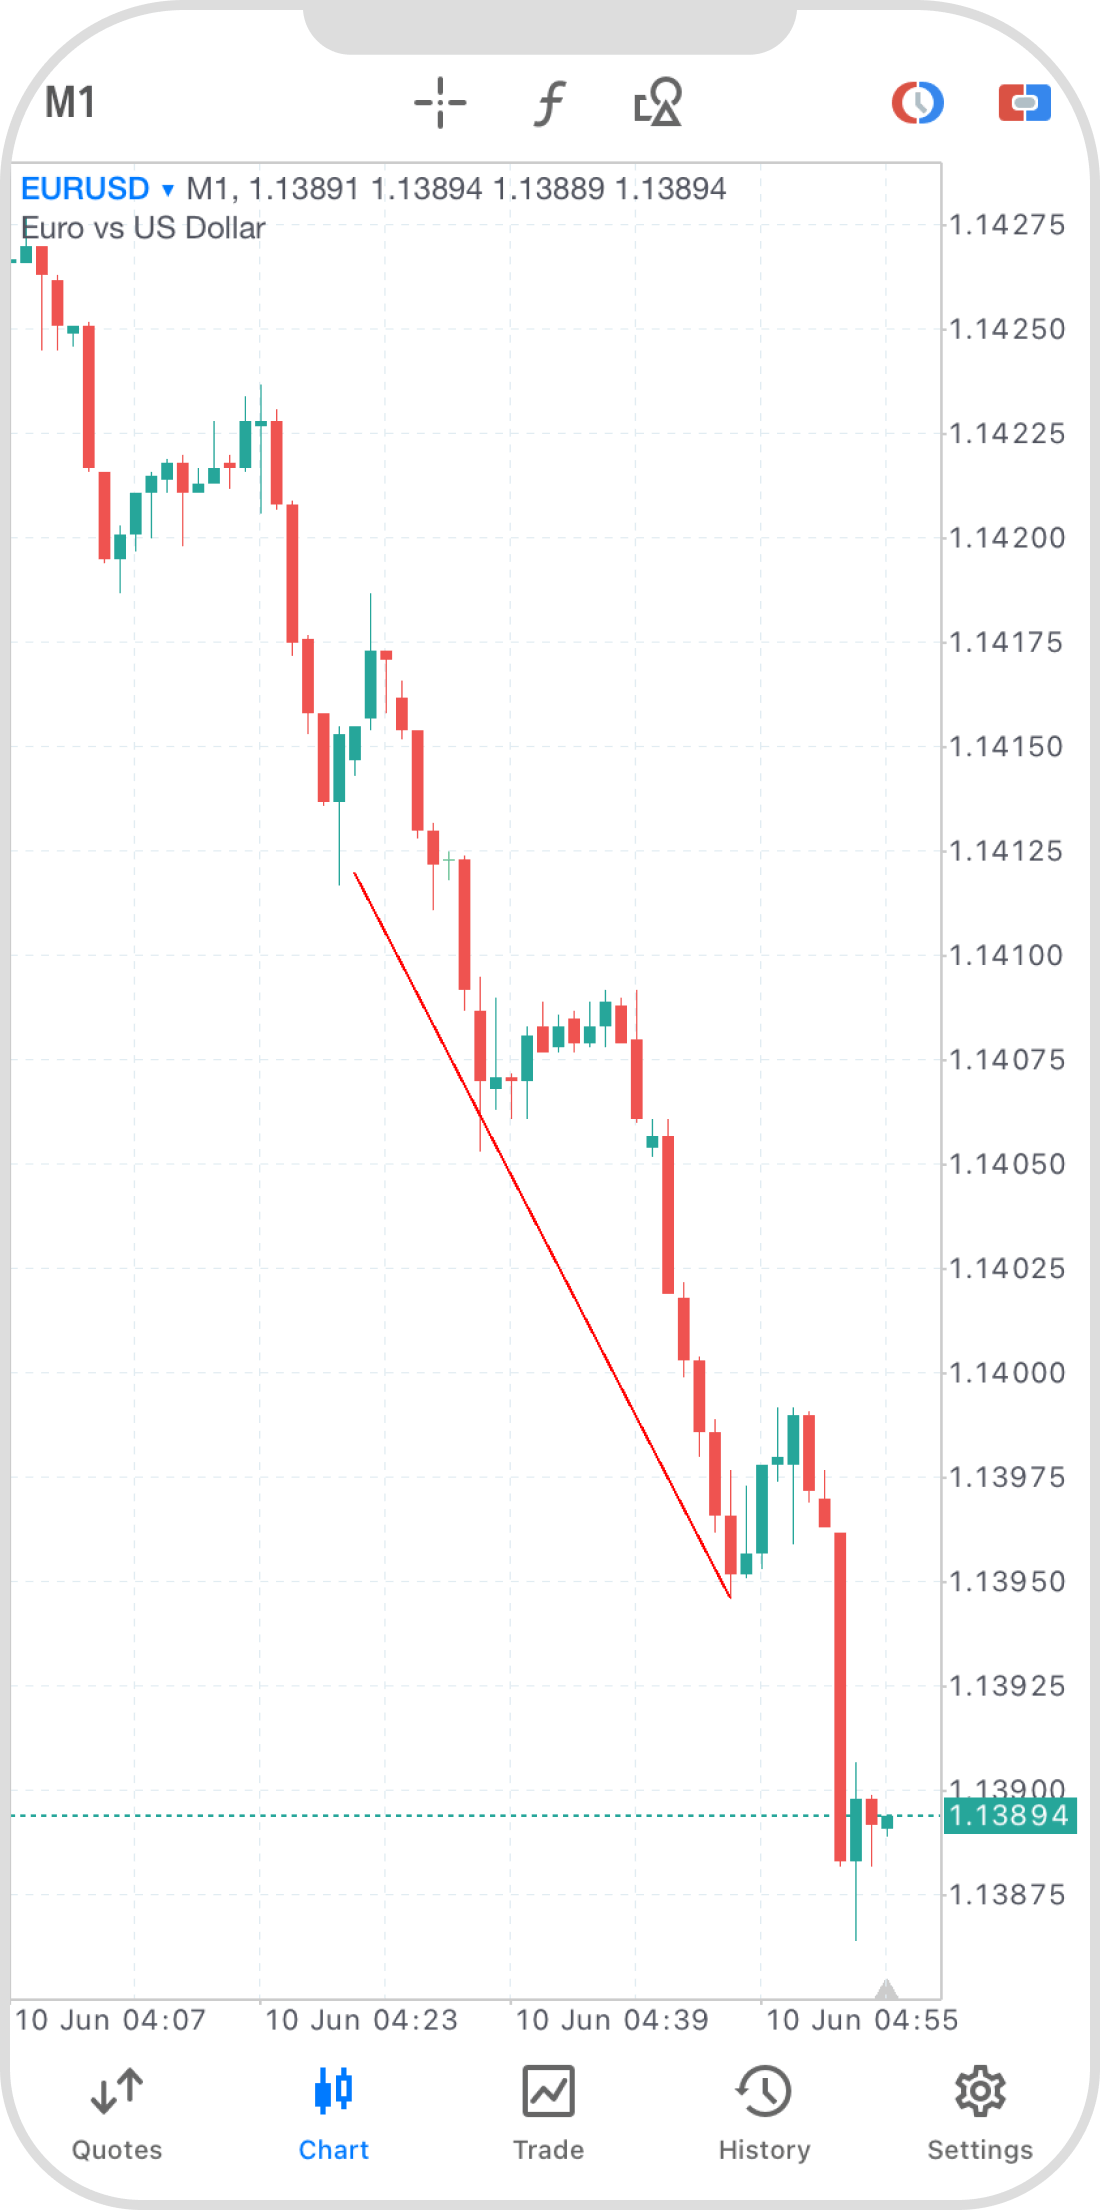
To fix the trendline, tap on the line to hide the dots.
Tap "Charts" on the bottom navigation bar.
Tap on the chart.
Tap the "Objects" icon.
Tap the "+" icon at the top.
Tap "Trendline".
Tap at the starting point of the trendline and drag to the end point.
To fix the trendline, tap around it and hide the black dots.
Tap the "Objects" icon on the left.
Tap "Add Object".
Tap "Trendline".
Tap at the starting point of the trendline and drag to the end point.
In the menu that appears after swiping, you can also change the line's color, thickness, and style.
To fix the trendline, tap around it and hide the red dots.
Tap on the chart.
Tap the "Objects" icon.
Tap the "+" icon at the top.
Tap "Trendline".
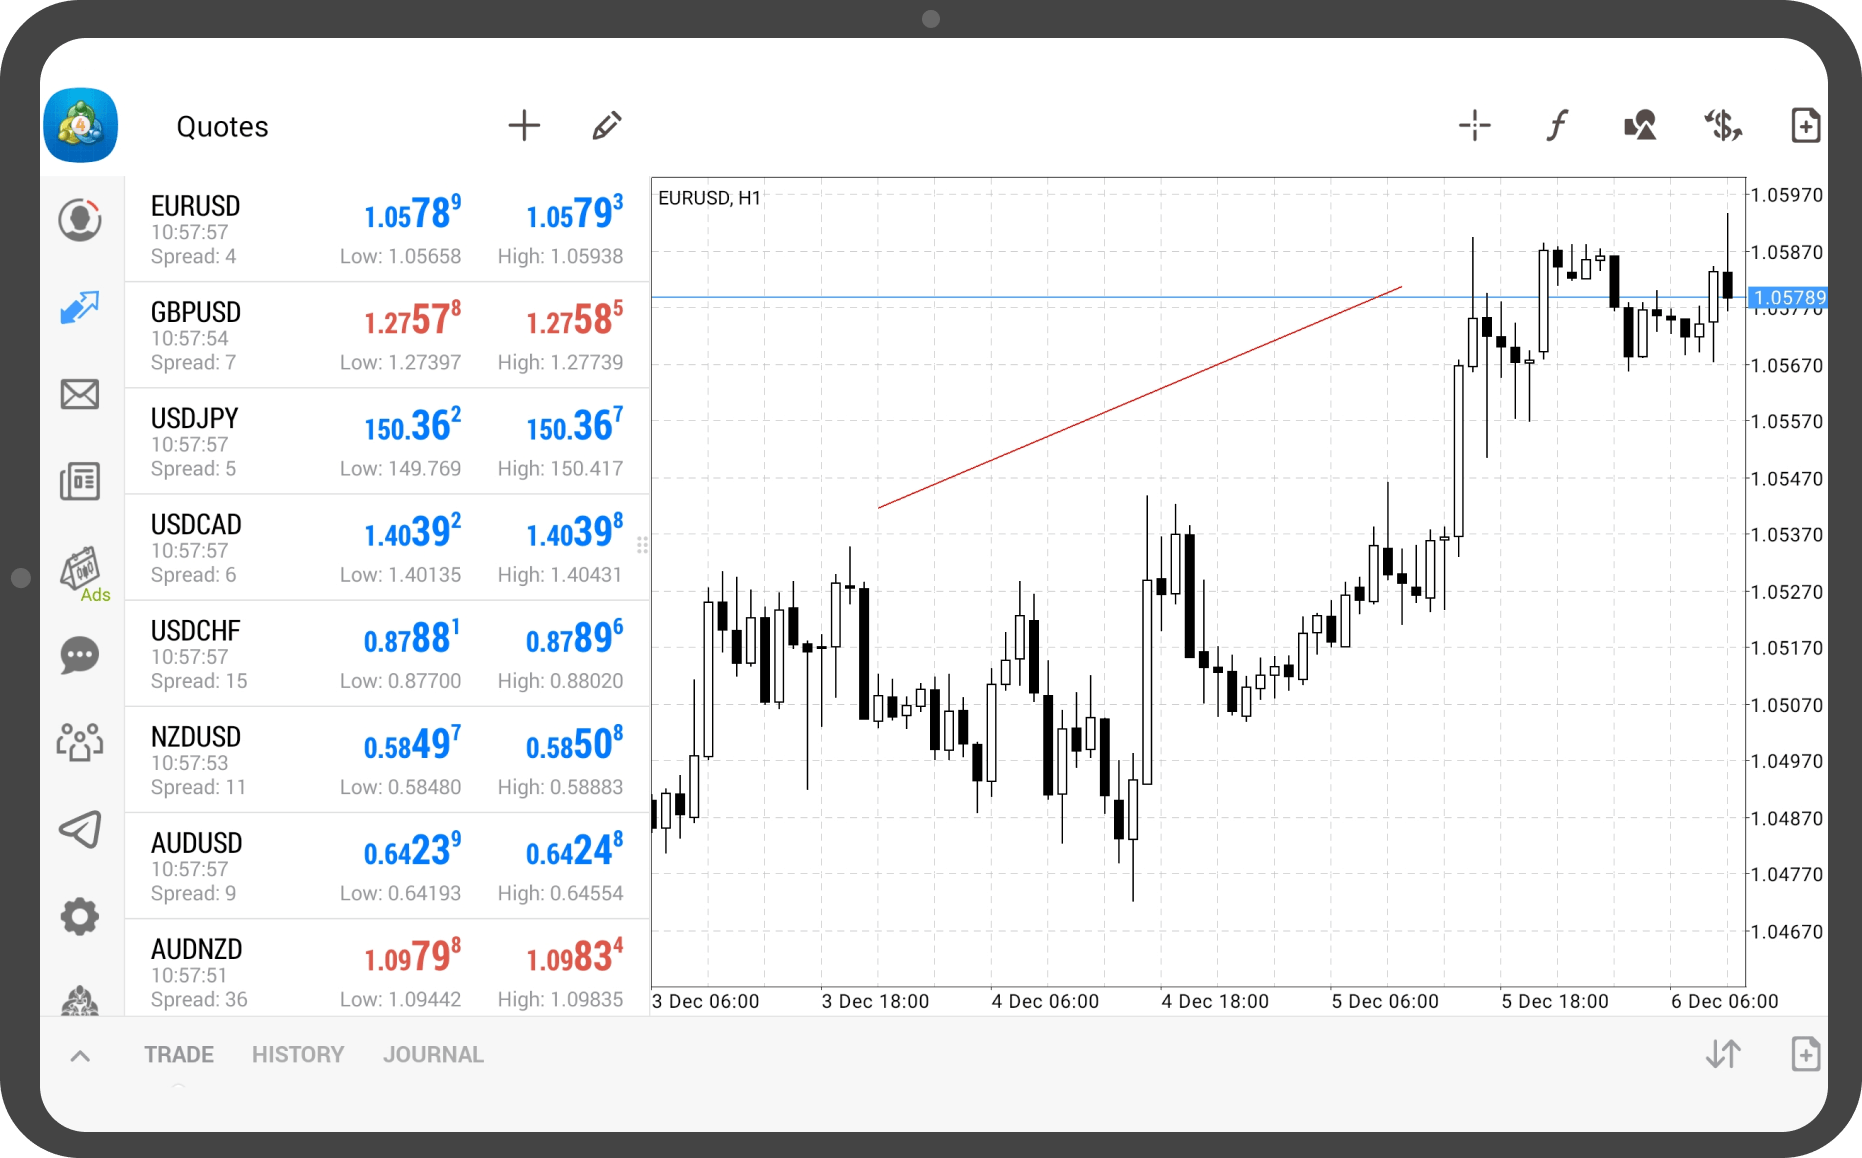
Tap at the starting point of the trendline and drag to the end point.
To fix the trendline, double-tap around it and hide the black dots.
Was this article helpful?
0 out of 0 people found this article helpful.
Thank you for your feedback.