


#technical
#mainchart
#technical
#mainchart
Downloaded:
0
times
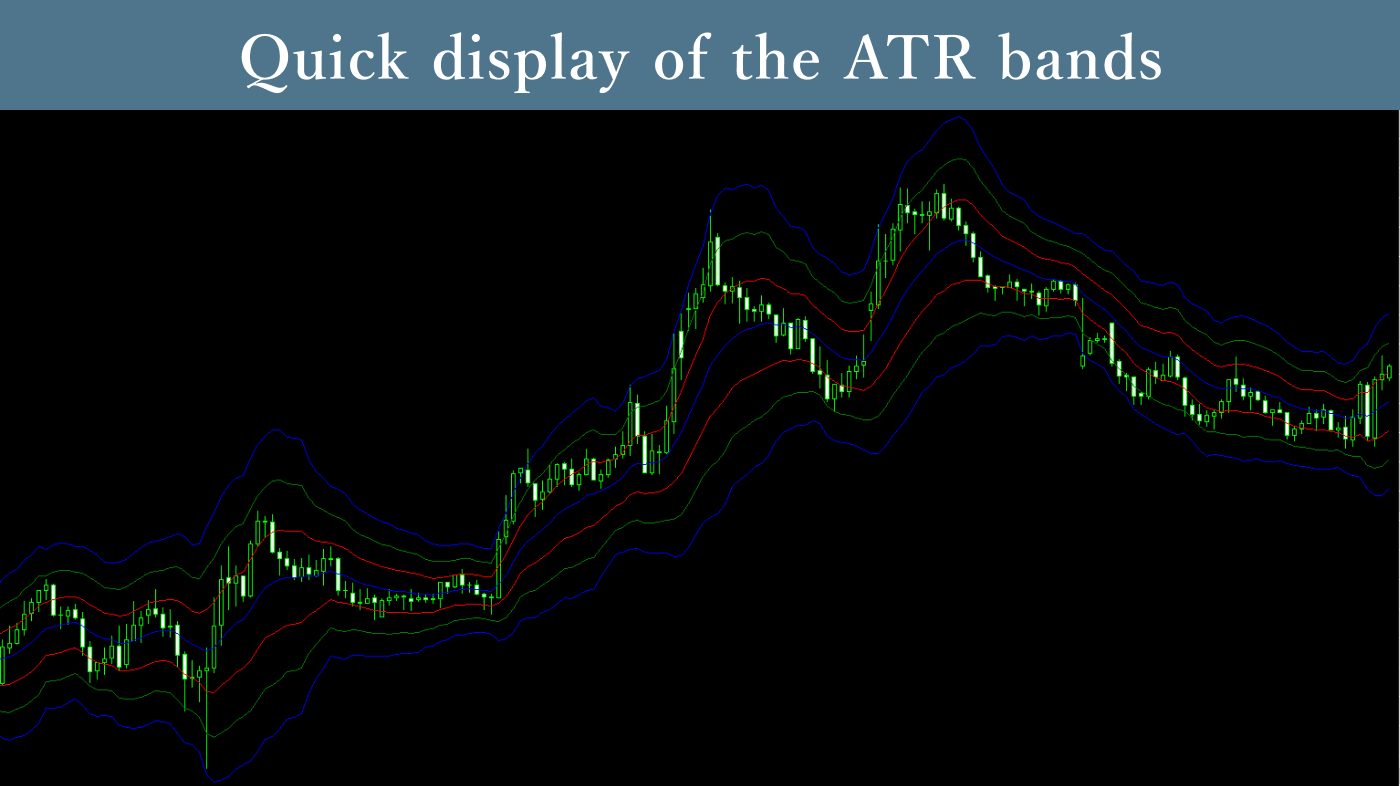
The ATR Bands Indicator adds and subtracts moving averages to ATR values for any set period and displays them as band-shaped graphs on the chart. By knowing the timing when prices cross ATR bands, you can use this as a guide for profit-taking or counter-trend entry.
Downloaded:
0
times
Usage scenarios
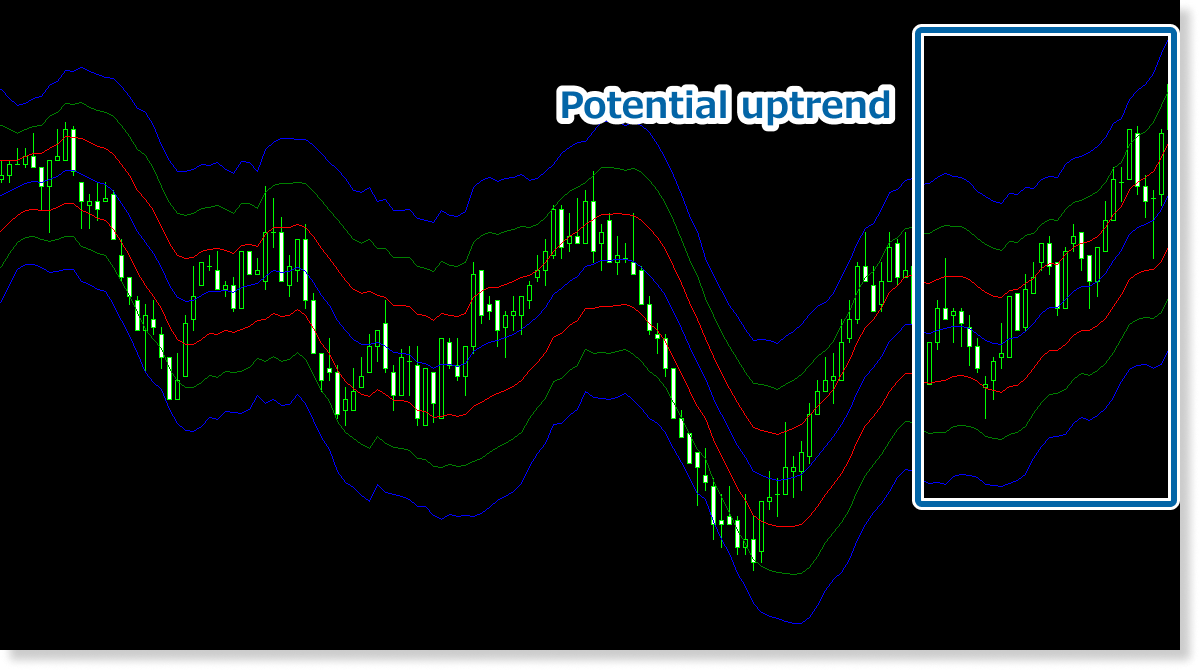
For initiating trend-following trades
With ATR bands, when the entire band is rising or when prices are positioned at the upper part of the band, it can be judged that buying pressure is strong and an upward trend is possible. It can be used as material for determining current trends along with other trend-based technical indicators such as RSI and MACD.
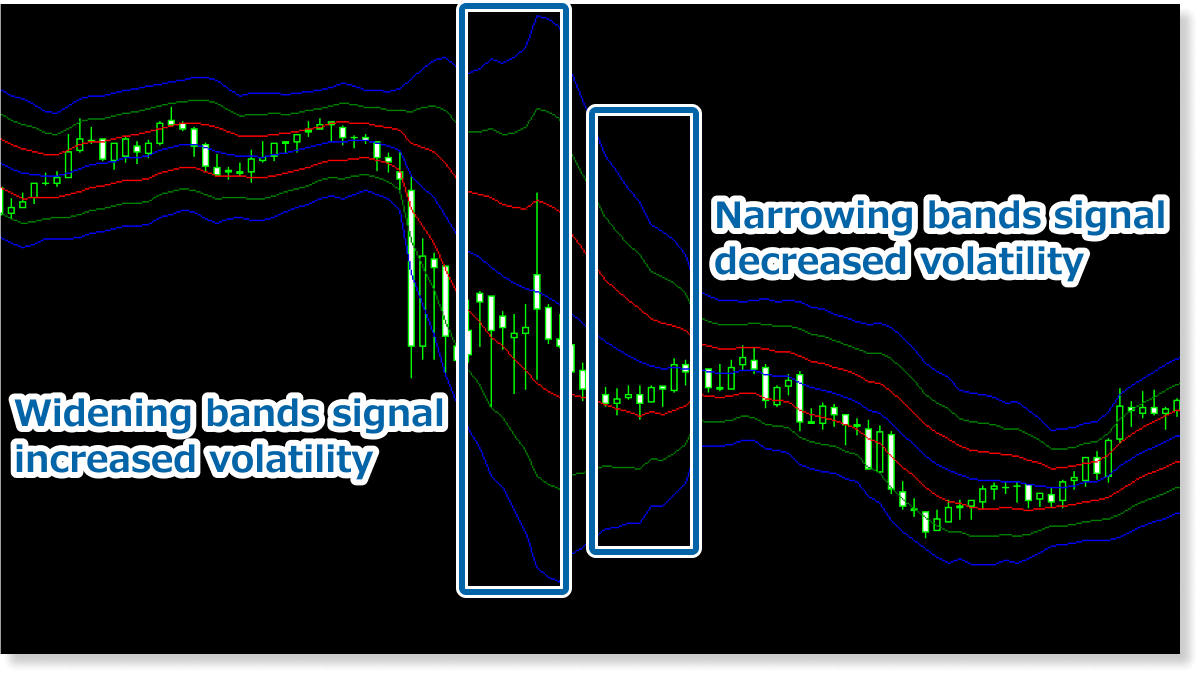
For exit decisions based on volatility decline
A situation where ATR bands are continuously narrowing means volatility is decreasing. As large price movements become less frequent and spreads may widen significantly depending on the broker, making trading unfavorable, this is a time to consider closing held positions while refraining from new entries.
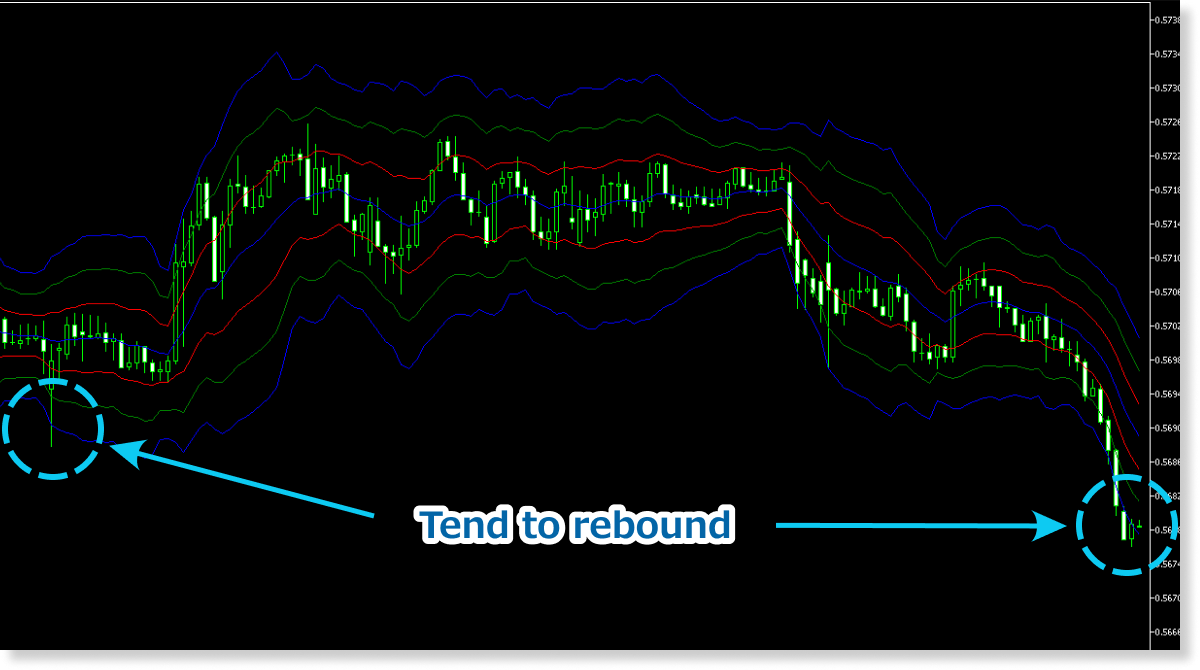
Aiming for rebounds from prices that deviate from bands
When prices deviate outside the ATR bands, they tend to show reactive movements trying to return inside the ATR bands. When such price movements are observed, one approach is to enter counter-trend trades aiming for profit, with the center of the band as the profit-taking line.
For selecting profit-taking and stop-loss lines
Entry decisions can be made using other technical indicators, while the ATR Bands Indicator can be utilized solely for exit decisions, such as using the outer edges of the ATR bands as profit-taking or stop-loss lines, or using the width of the ATR bands to determine the number of points for profit-taking or stop-loss levels.

Use with other indicators
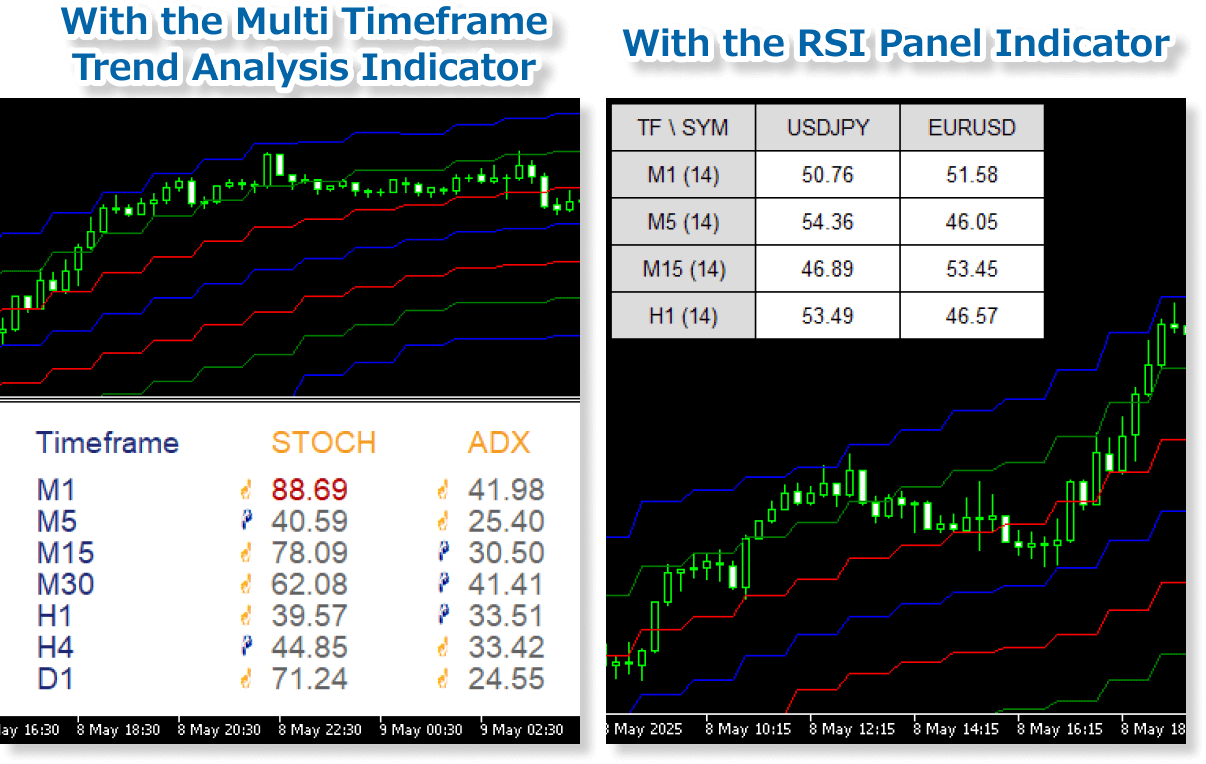
Pair this indicator with our Multi-Timeframe Trend Analysis Indicator to add technical signals across multiple timeframes to your chart for broader analysis. For RSI-focused strategies, the RSI Panel Indicator provides key data in a single view.
The strength of the ATR Bands Indicator is that it can display finely customized ATR bands at once using multi-timeframe settings, ATR multiplier settings, and alert settings. If you currently incorporate or are planning to incorporate ATR bands into your trading strategy, please give it a try.
How to install
To use the ATR Bands Indicator, follow the steps below to download and install it.
Step 1
Click the button below to download the indicator for MT4/MT5.
Step 2
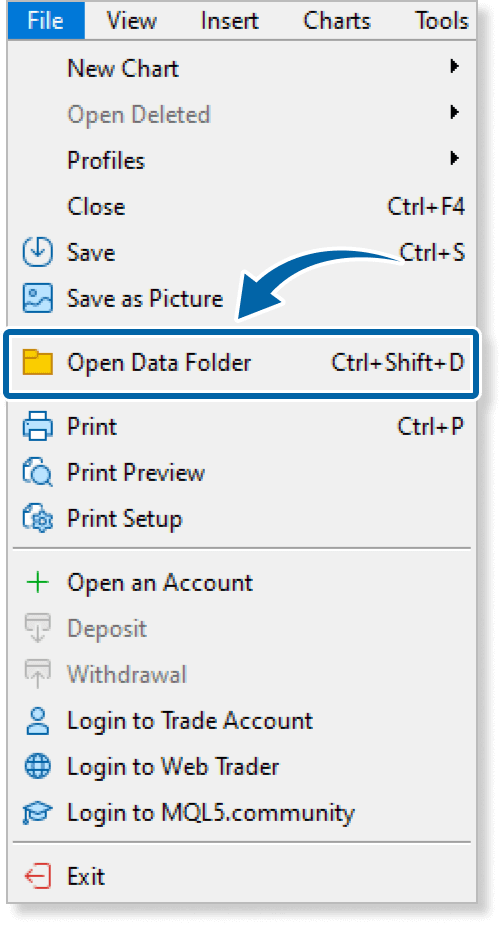
Click File > Open Data Folder in the top menu of MT4/MT5.
Step 3
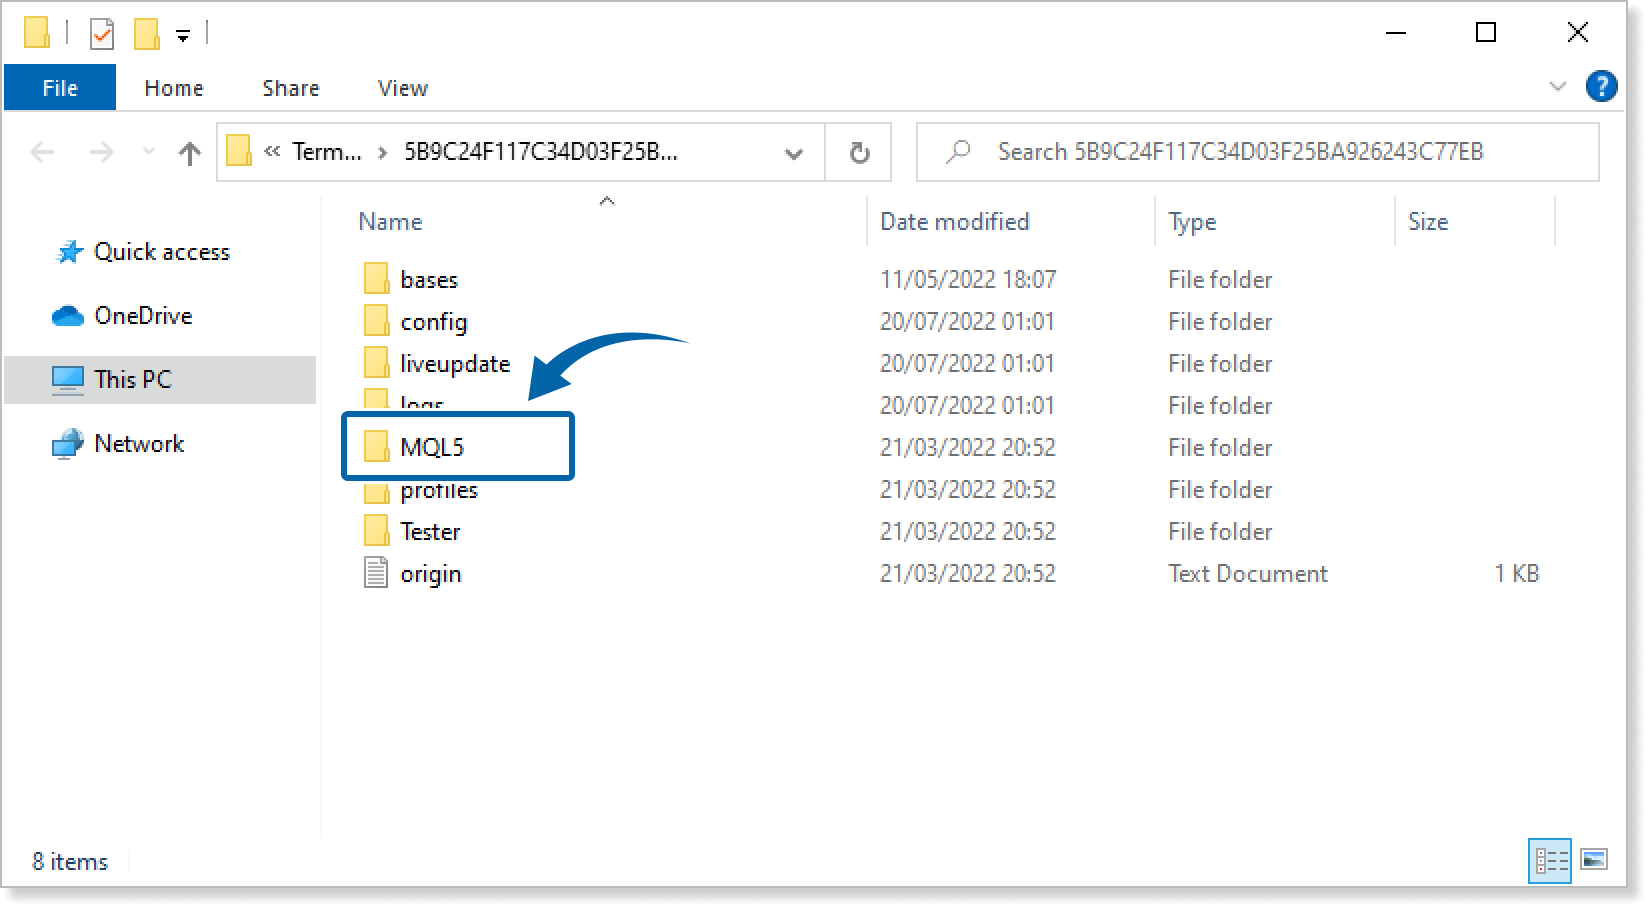
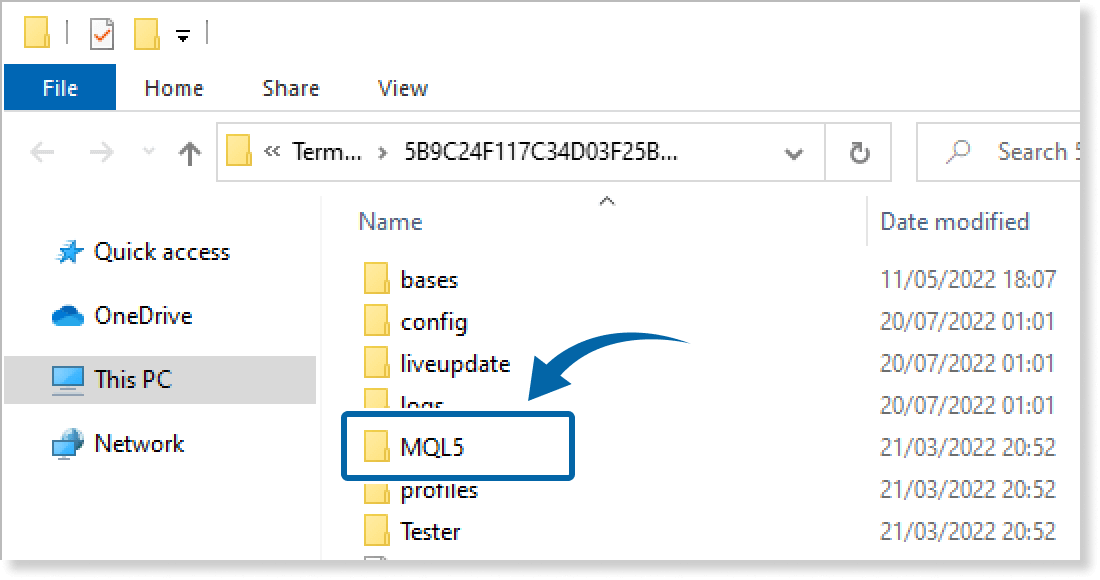
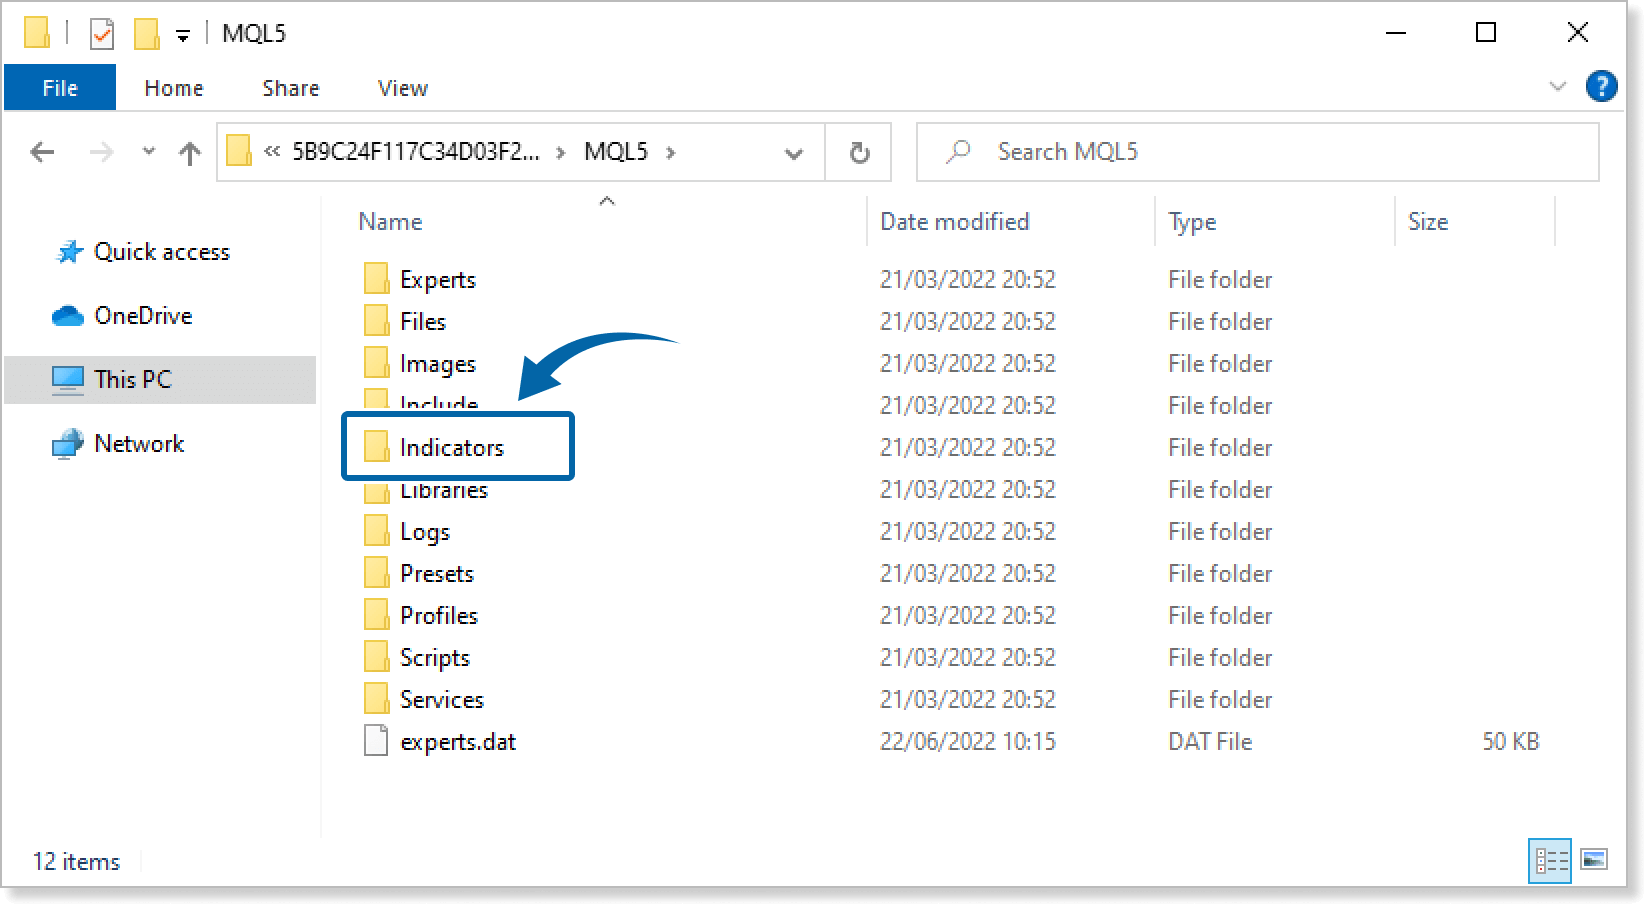
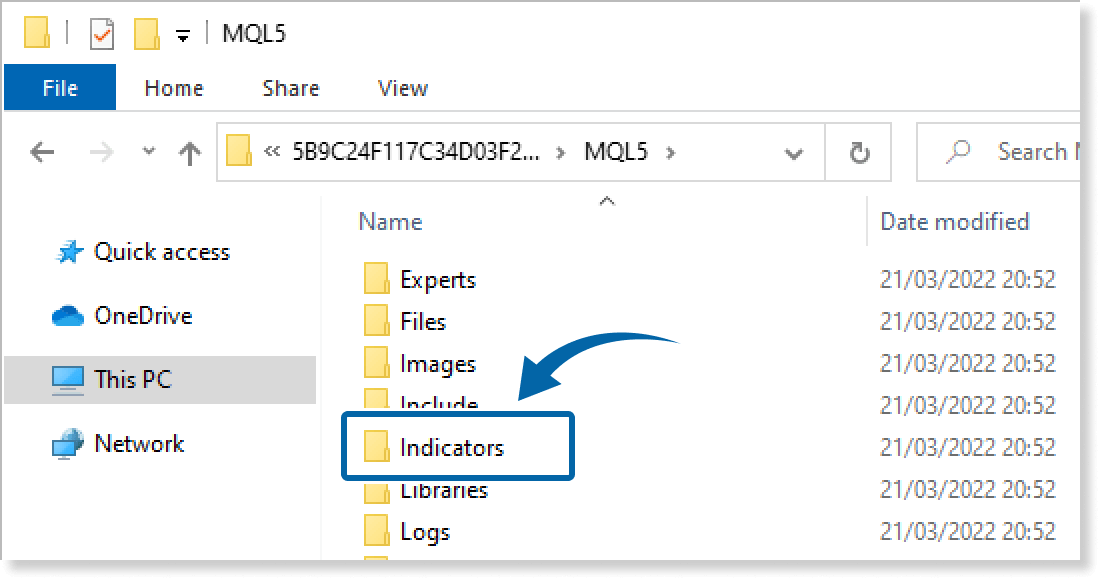
In the data folder, double-click the MQL4 or MQL5 folder.
Step 4
In the MQL4/MQL5 folder, double-click the Indicators folder.
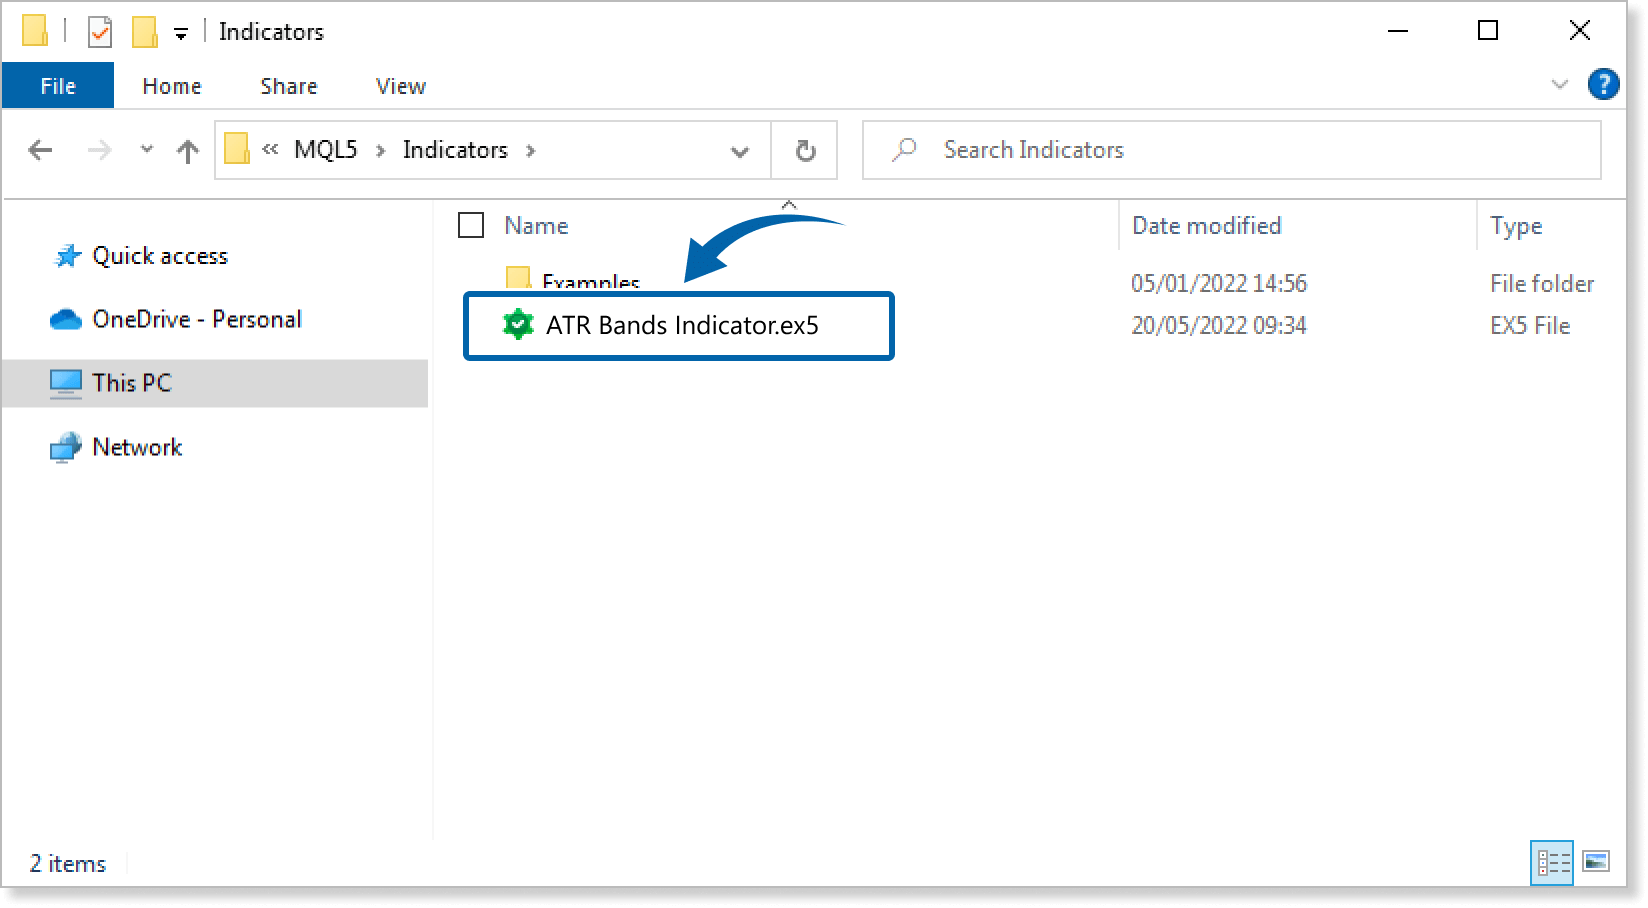
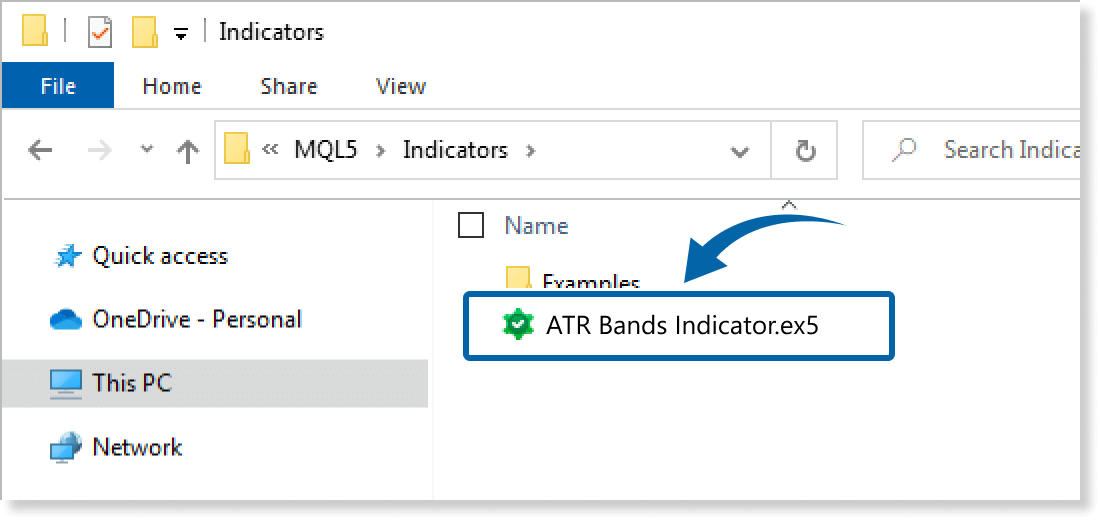
Step 5
Save the ATR Bands Indicator in the Indicators folder.
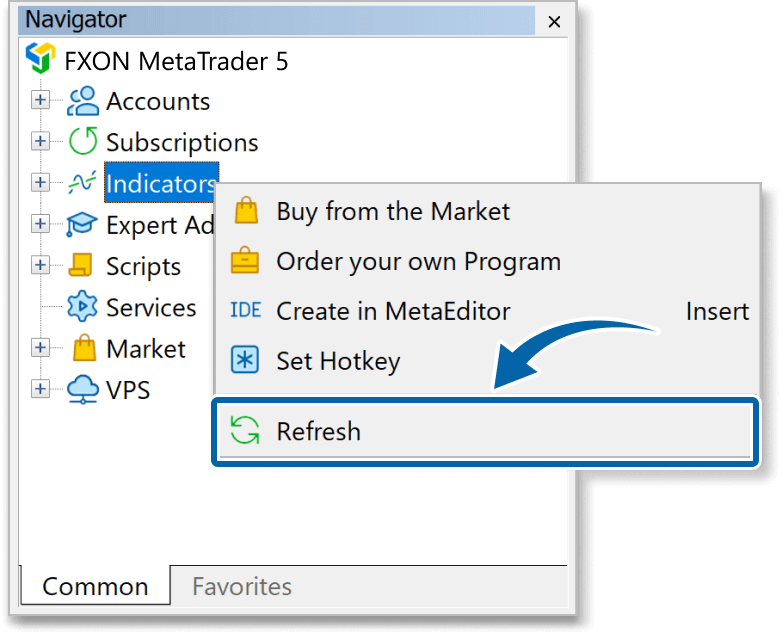
Step 6
Go back to the MT4/MT5. Right-click Indicators in the Navigator, and click Refresh.
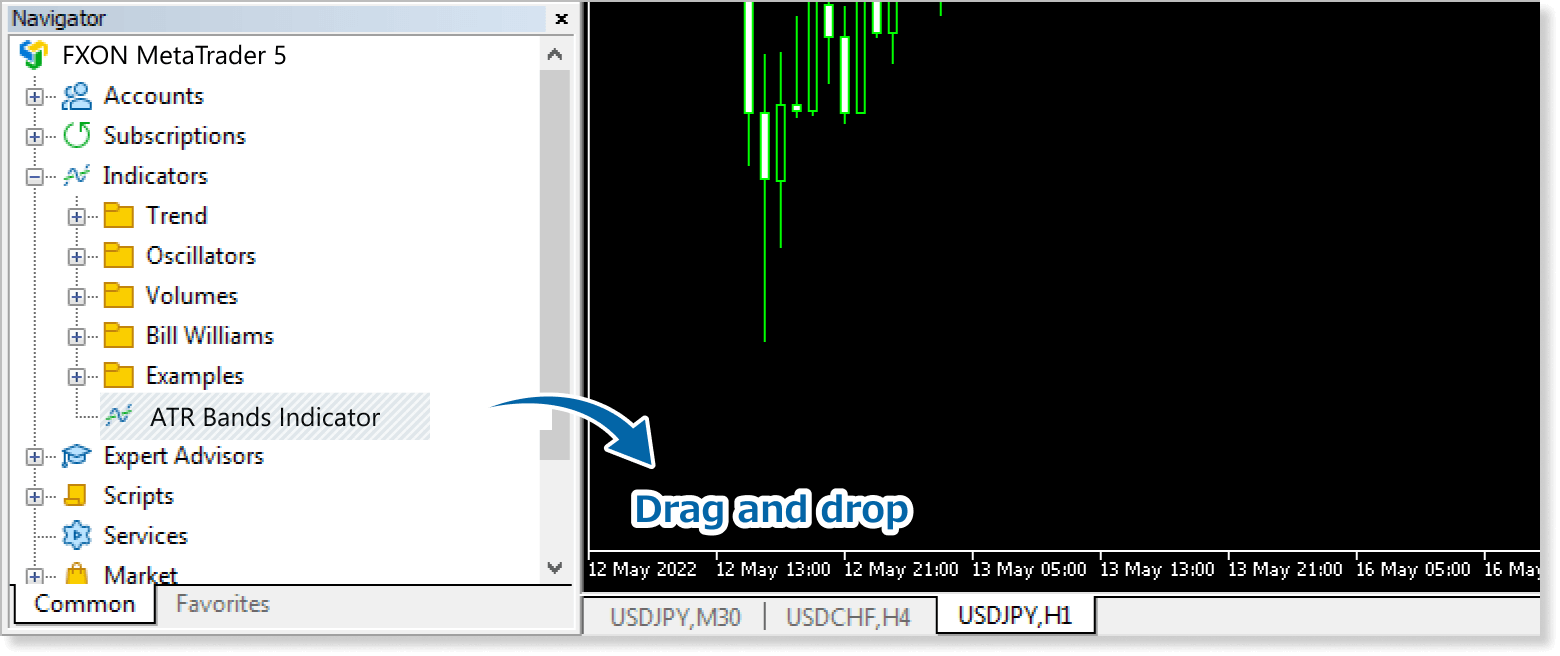
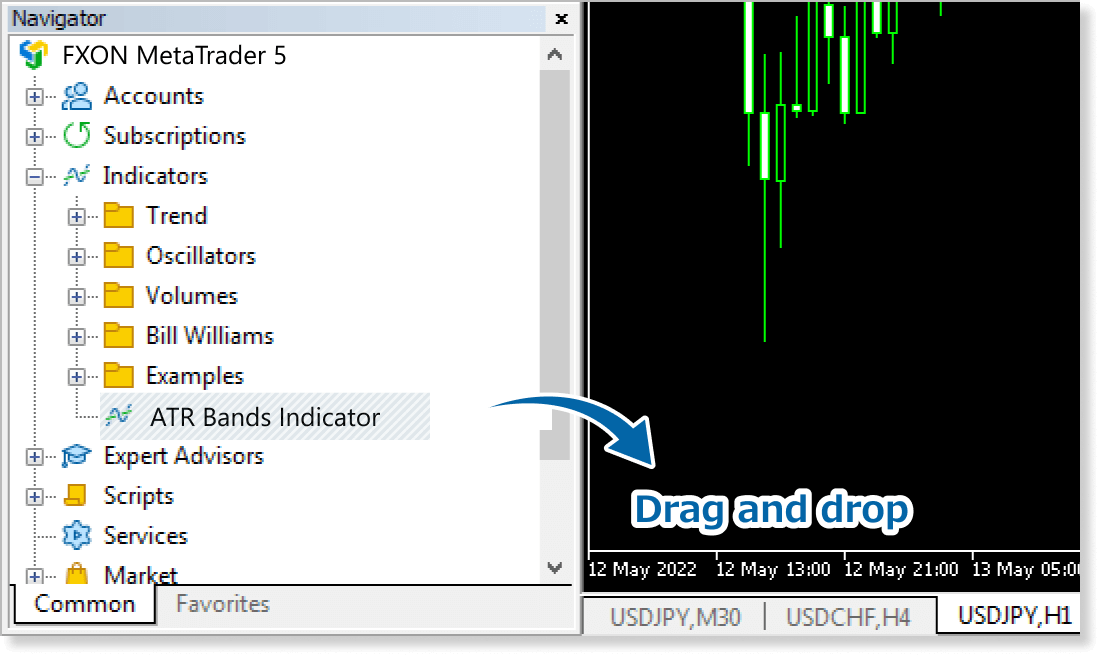
Step 7
In the Navigator, click the + icon next to Indicators. Find the ATR Bands Indicator, then either double-click it or drag it onto a chart.
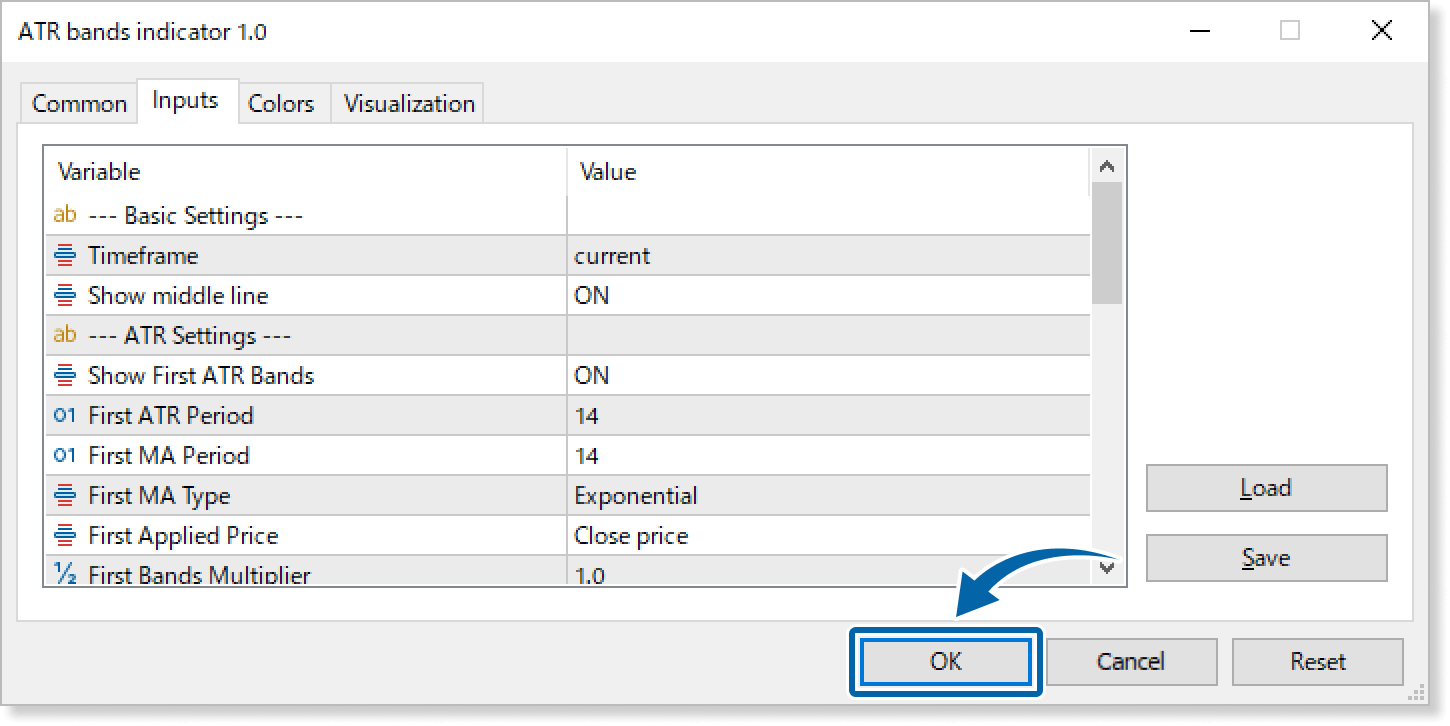
Step 8
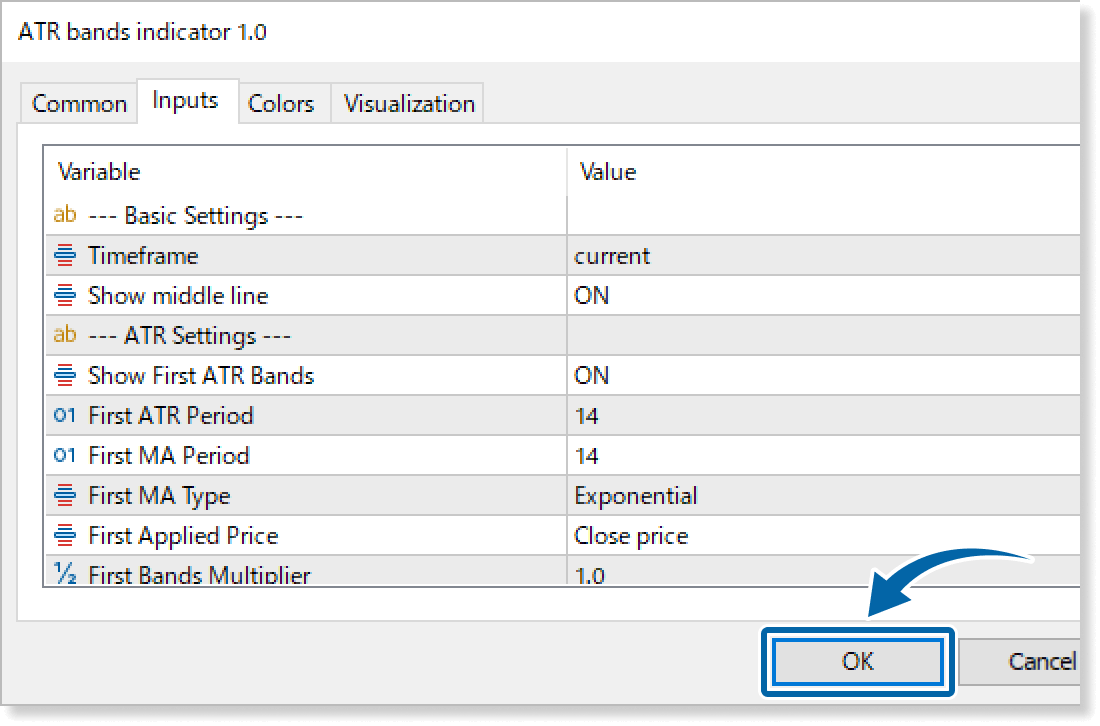
In the indicator settings window, customize the settings on the Inputs tab according to the How to set up page, then click OK.
Step 9
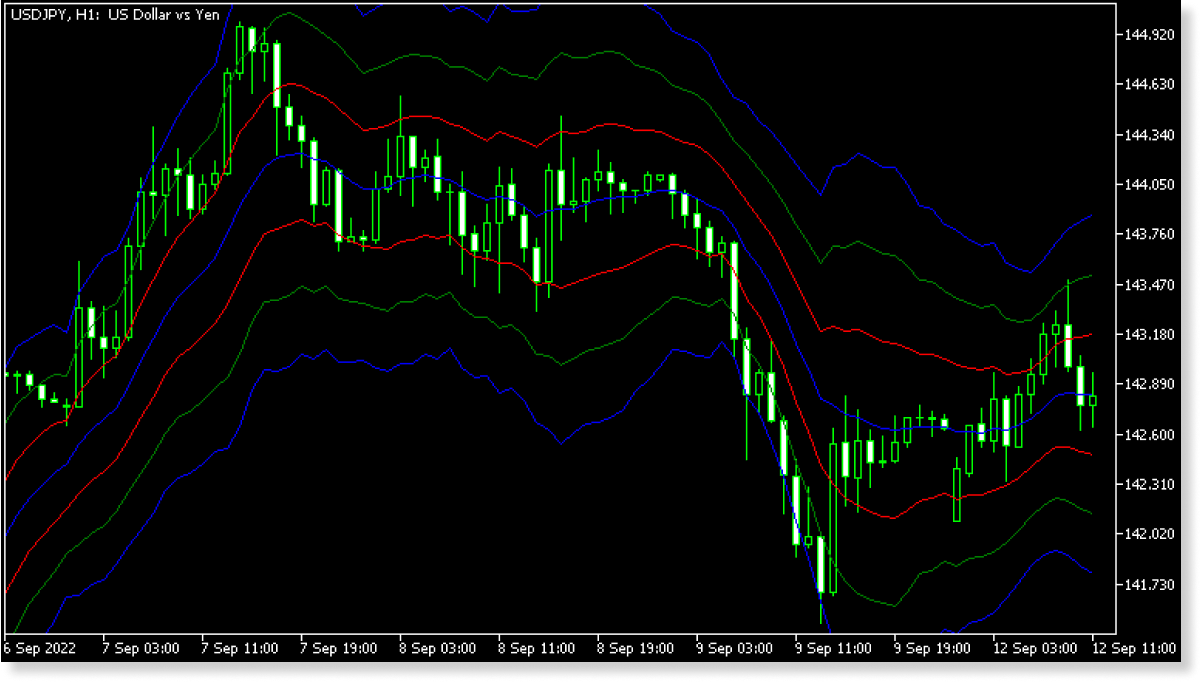
The ATR Bands Indicator is applied to the chart, showing bands on it.
How to set up
After applying the indicator to the chart, set the parameters according to your style.
Step 1
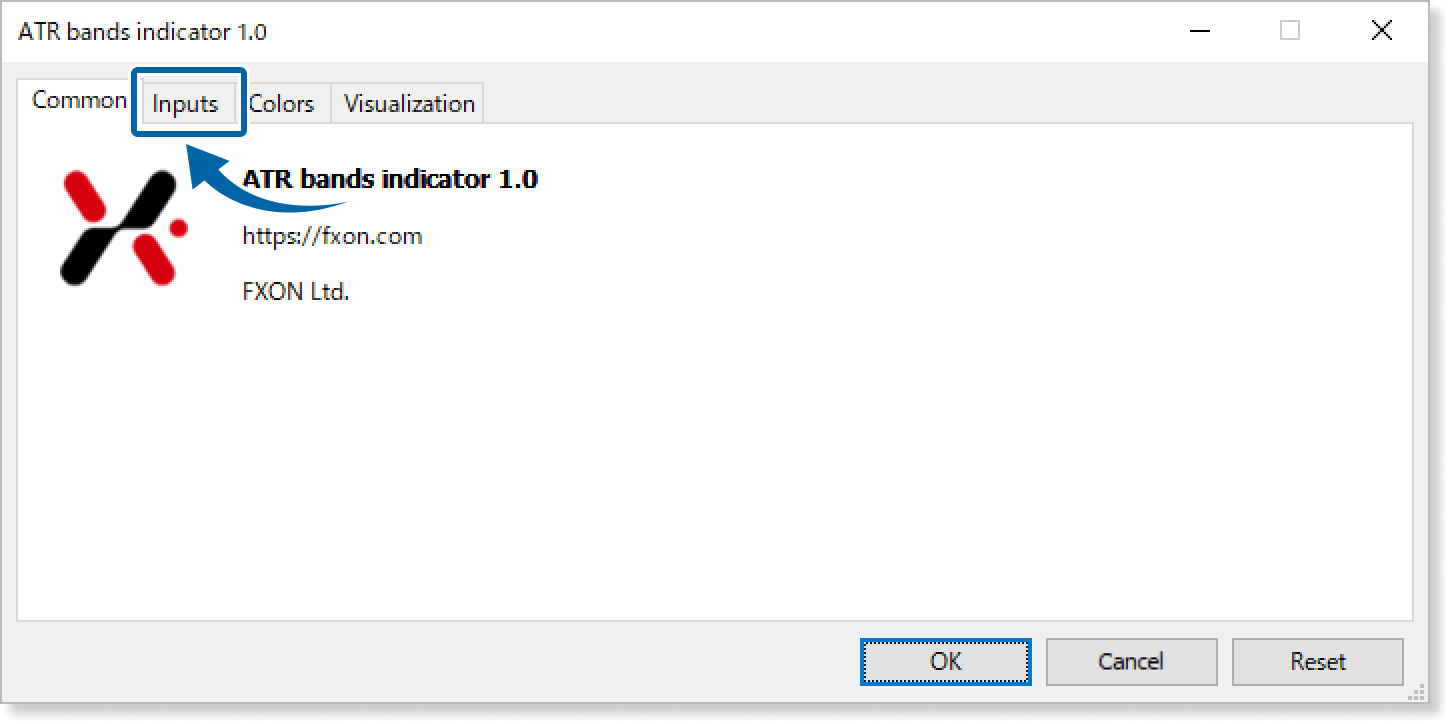
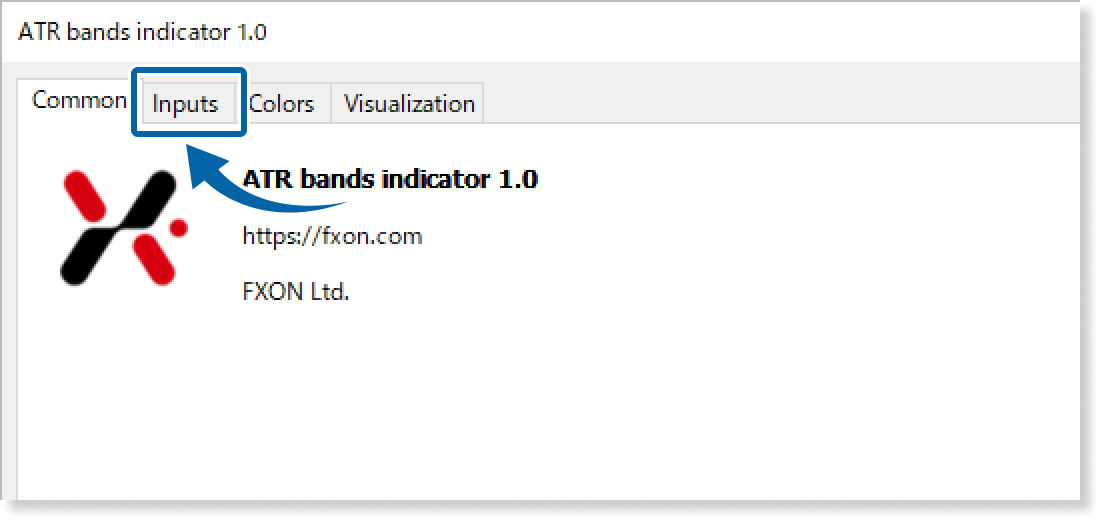
First, open the Inputs tab.
Step 2
Set the parameters as follows.
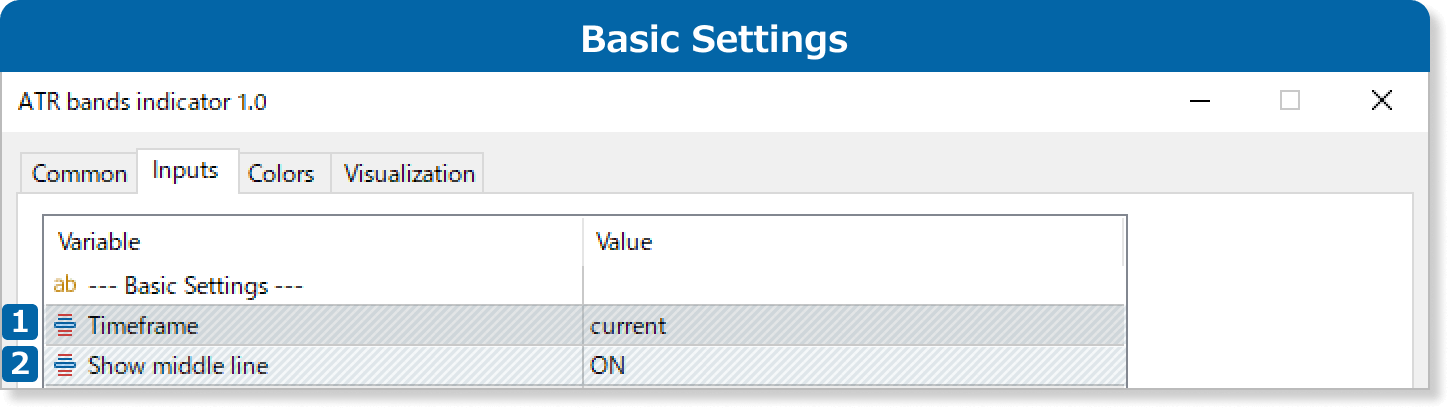
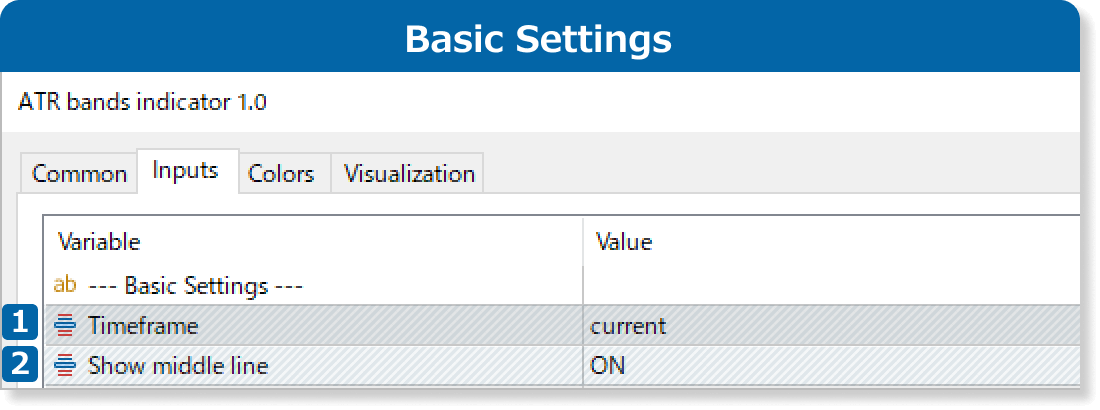
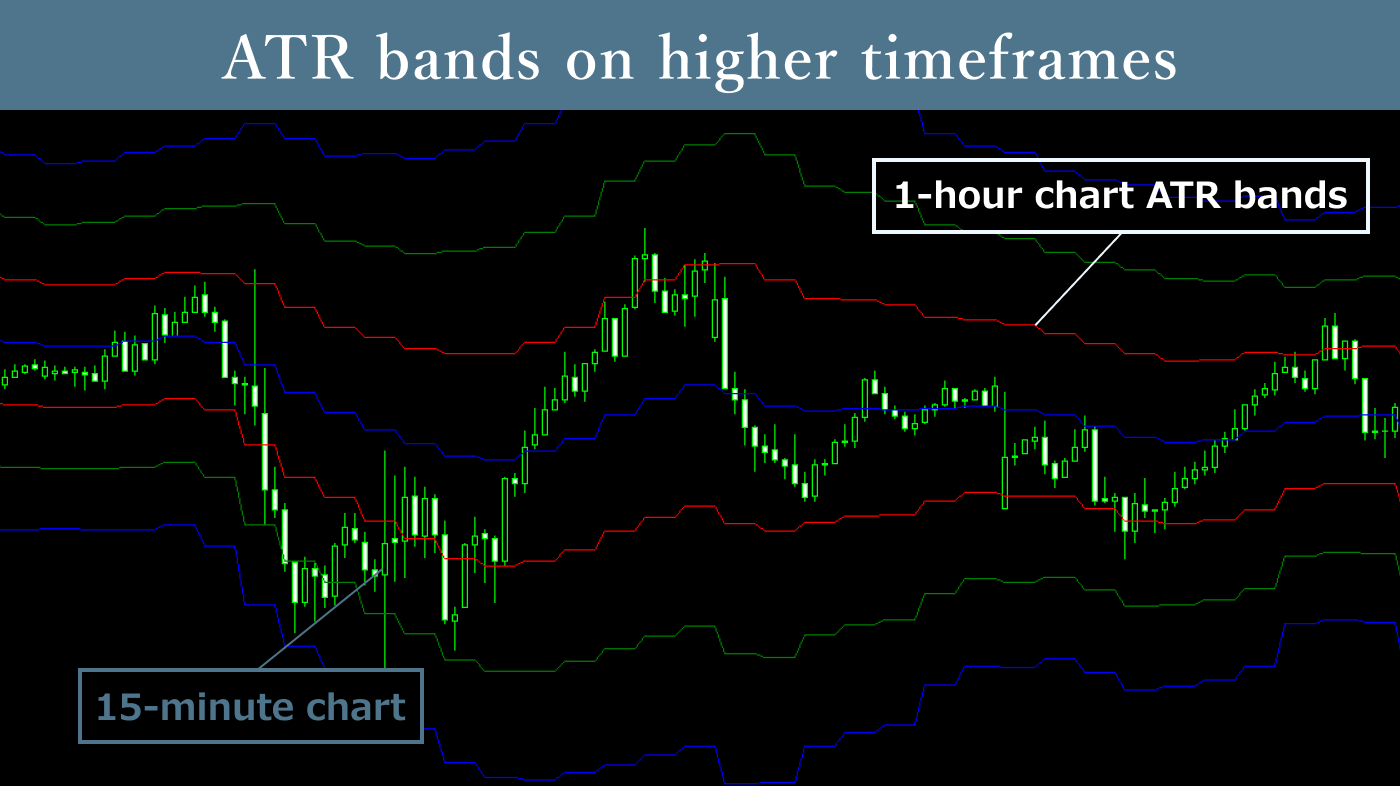
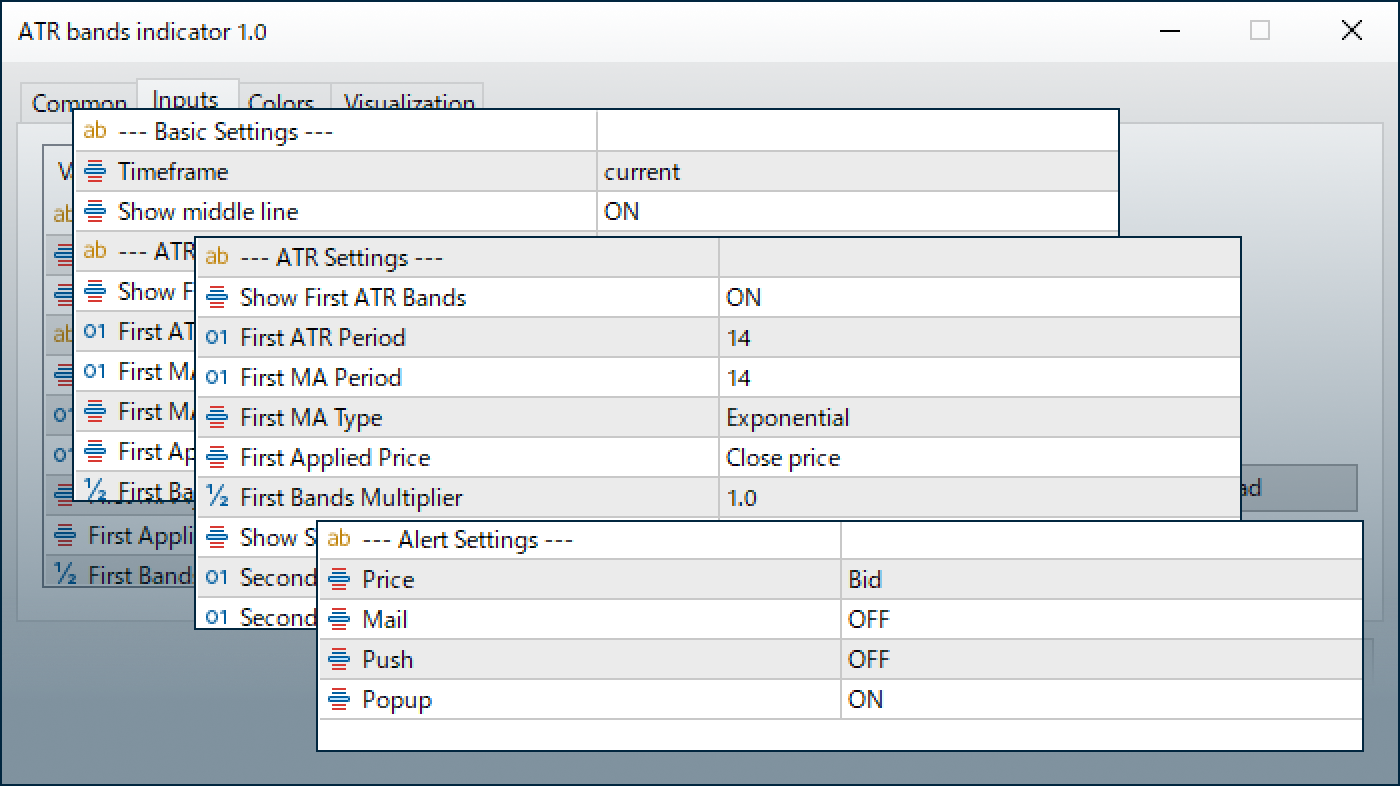
①Timeframe
Select the timeframe for the ATR bands. If 'Current' is chosen, the bands will match the chart's timeframe. If a specific timeframe is selected, the ATR bands will be displayed using that timeframe, independent of the chart's timeframe.
②Show middle line
Show or hide the middle line (moving average).
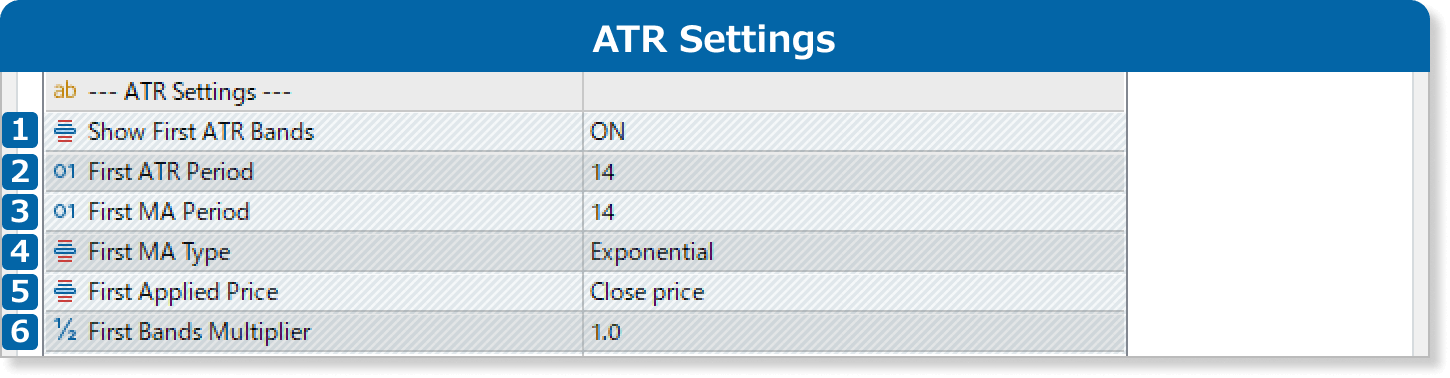
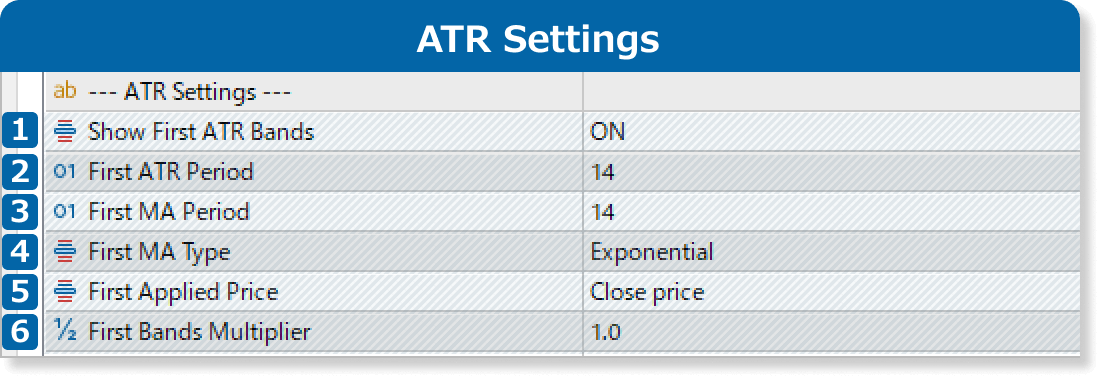
①Show First ATR Bands
Show or hide the ATR bands 1.
②First ATR Period
Specify the number of recent bars used to calculate the ATR for ATR bands. For example, if set to "14," the ATR is calculated from the last 14 bars.
③First MA Period
Specify the number of recent bars used to calculate the MA for ATR bands. For example, if set to "14," the MA is calculated from the last 14 bars.
④First MA Type
Select the MA used to calculate ATR bands.
・Simple: simple moving average
・Exponential: exponential moving average
・Smoothed: smoothed moving average
・Linear weighted: linear weighted moving average
⑤First Applied Price
Select the price used to calculate the ATR bands.
・Close price
・Open price
・High price
・Low price
・Median price: (high price + low price) ÷2
・Typical price: (high price + low price + close price) ÷3
・Weighted price: (high price + low price + close price×2) ÷4
⑥First Bands Multiplier
Specify the multiplier applied to the MA added to/subtracted from the ATR. For example, if set to "2.0," the ATR bands will be twice as wide as when set to "1.0."
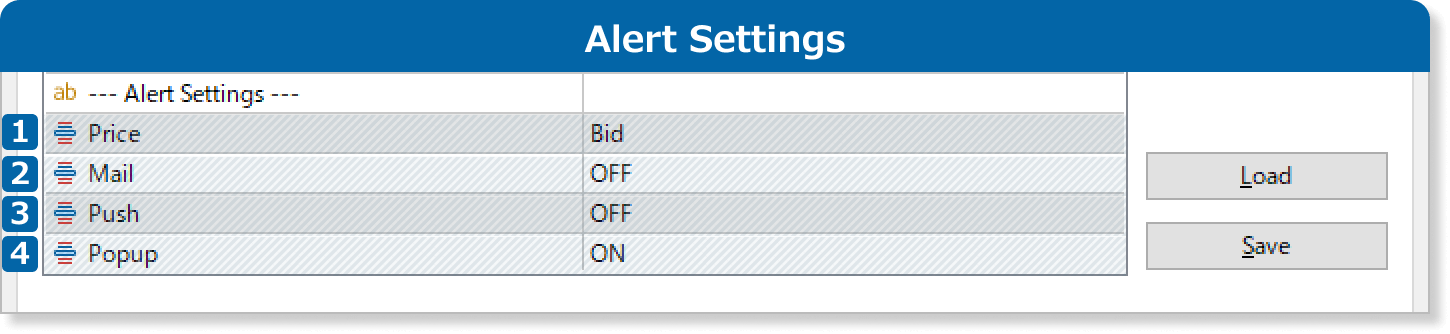
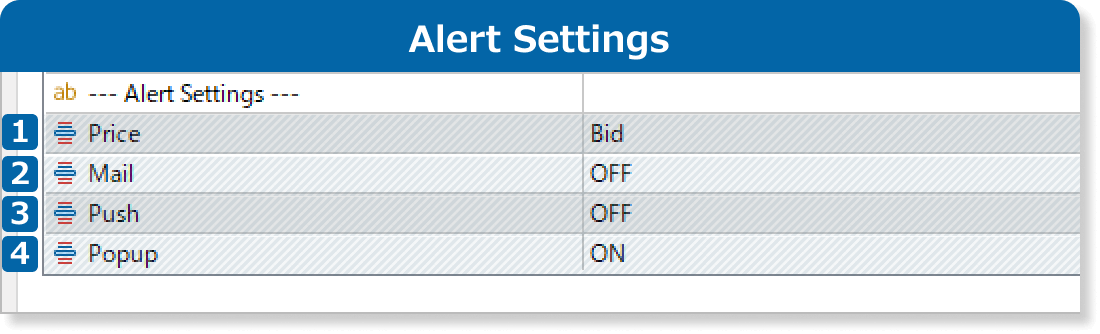
①Price
Select the price used for ATR band alerts. If set to "Bid," alerts trigger when the real-time bid price crosses the bands. If set to "Close price," alerts trigger when the close price crosses the bands.
②Mail
Enable or disable email notifications. When ON, alerts are sent to the specified email when the price crosses the bands.
③Push
Enable or disable push notifications. When ON, alerts are sent via the MT4/MT5 mobile app when the price crosses the bands.
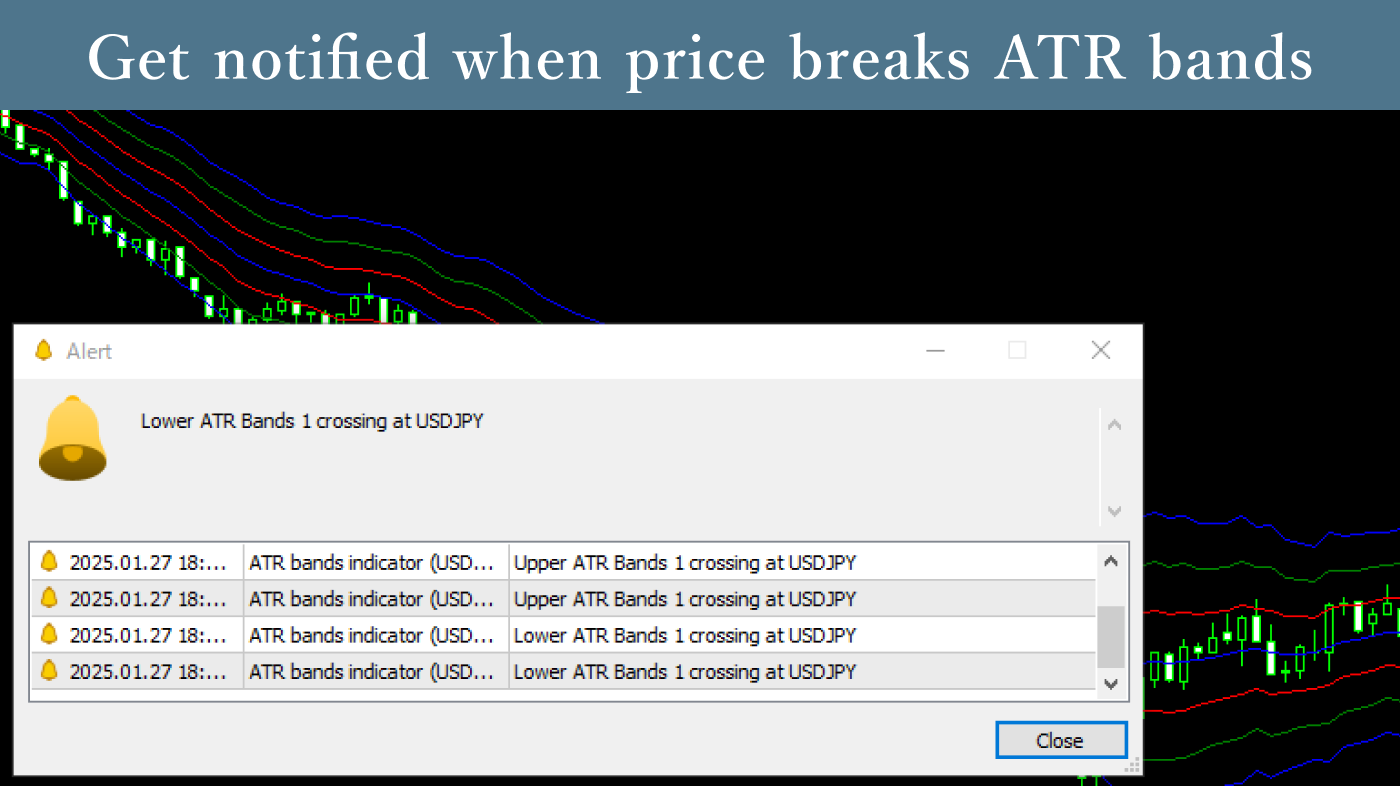
④Popup
Enable or disable popup notifications. When ON, alerts appear in the MT4/MT5 desktop platform when the price crosses the bands.