#supportive
#mainchart
#supportive
#mainchart
Downloaded:
0
times
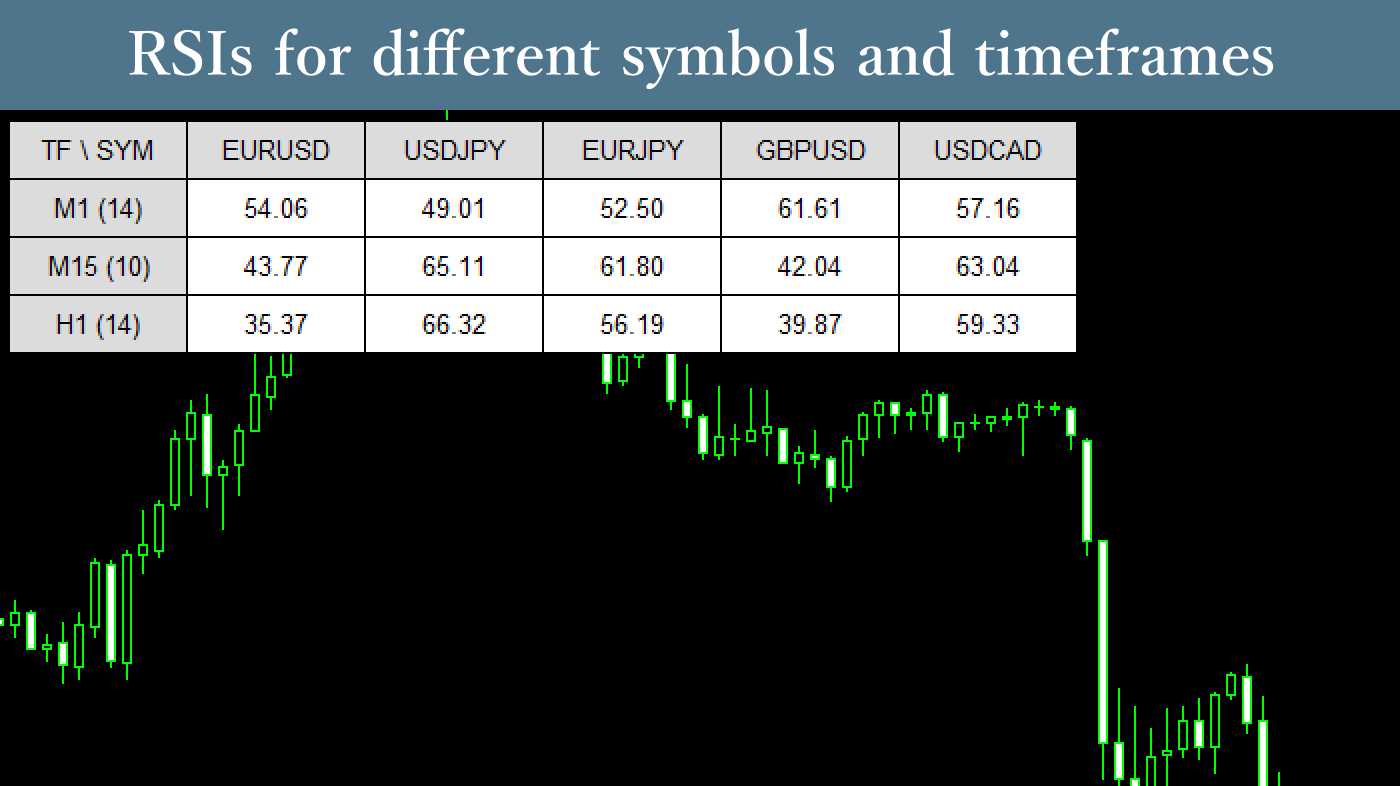
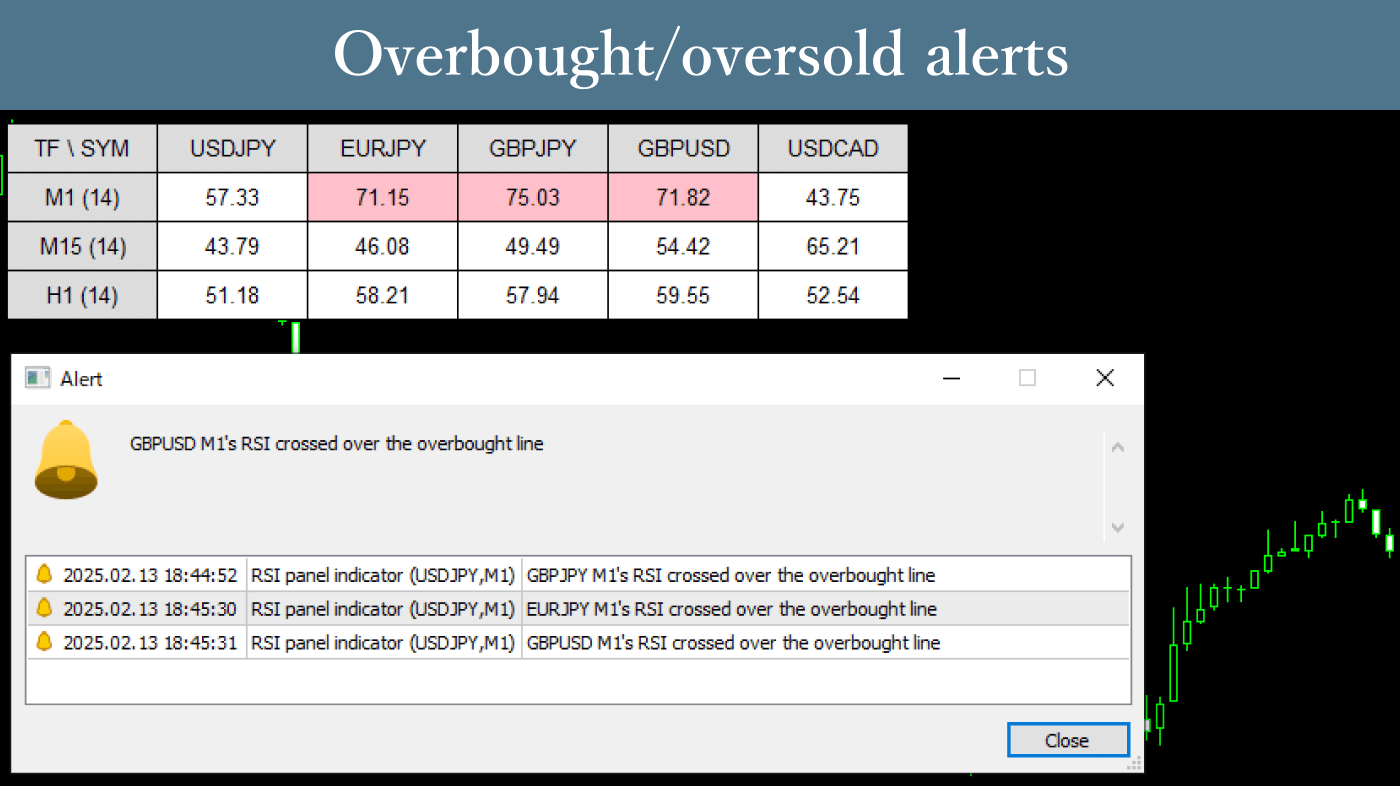
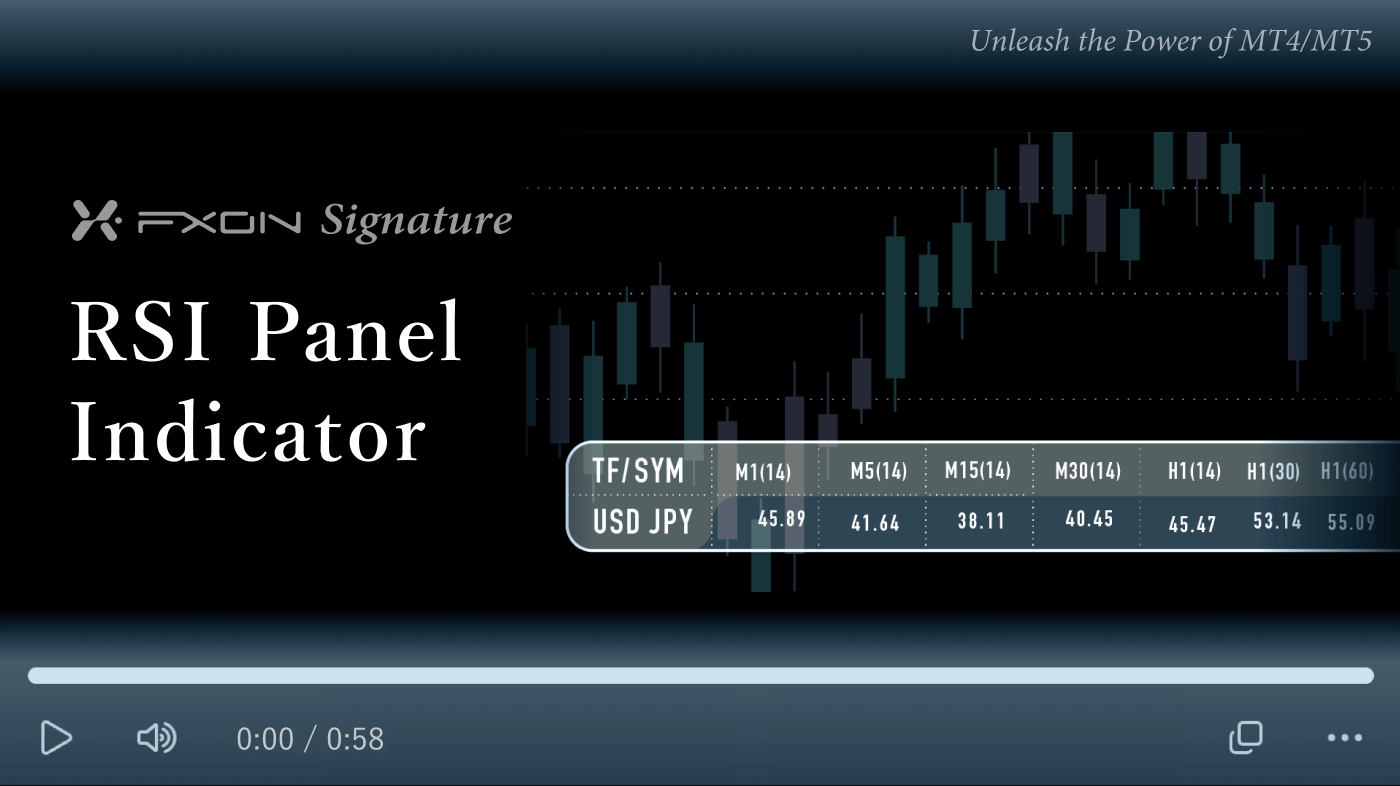
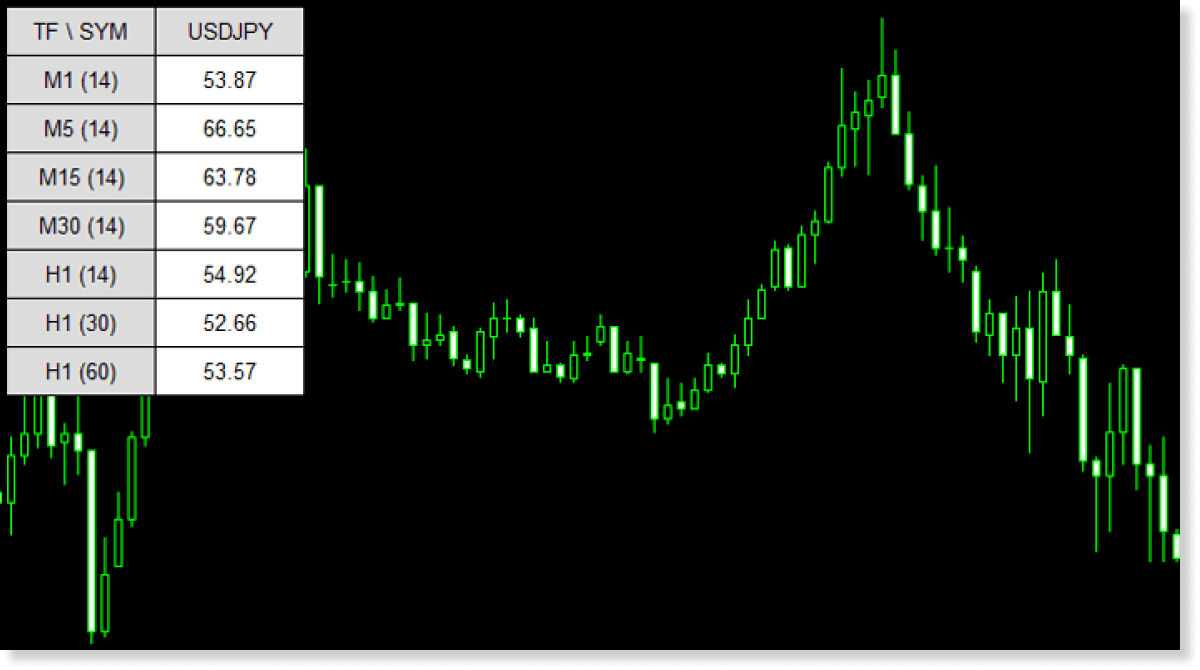
The RSI Panel Indicator is an indicator that displays RSI for any instrument, timeframe, and period in a panel format on the chart. It has a function to notify you through panel color changes and alerts when specific RSI levels are reached, allowing you to avoid missing trading opportunities using RSI.
Downloaded:
0
times
Usage scenarios
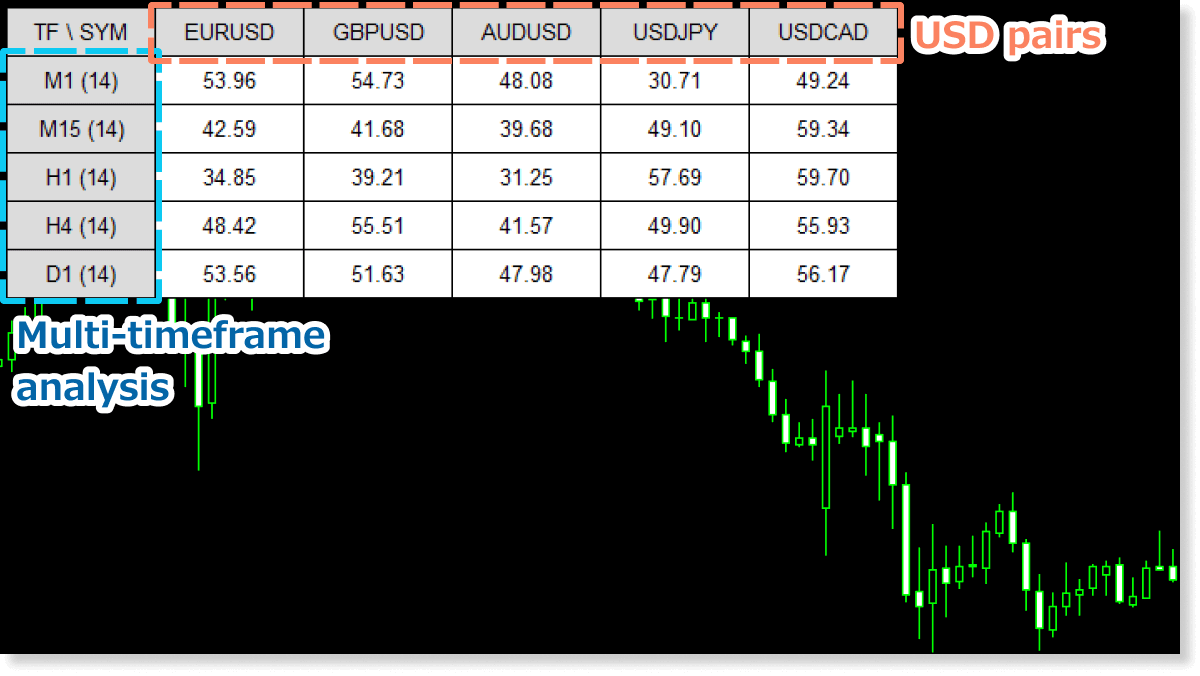
For analyzing specific currencies and multi-timeframe analysis
It makes it easier to conduct a wide range of market analysis related to RSI, such as analyzing multiple instruments involving the US dollar simultaneously to grasp USD trends (like EURUSD and AUDUSD), or displaying RSI across multiple timeframes for multi-timeframe analysis.
You can apply the indicator settings above by downloading the settings file from the button below and importing it.
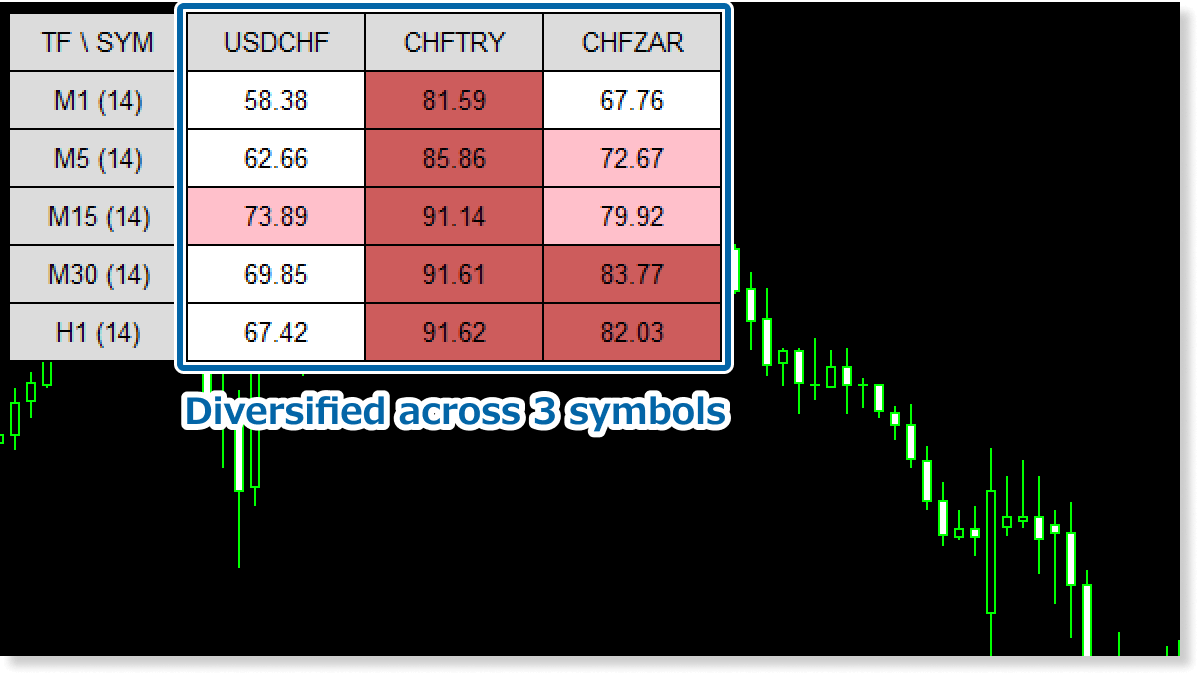
DownloadDiversifying investment in instruments showing the same trend to reduce risk
If you have a strategy to enter short positions when RSI exceeds 70, when multiple instruments show RSI above 70, trading across all these instruments can help limit losses even if unexpected rapid rises or falls occur due to major news. Using the RSI Panel Indicator can make such trading methods easier to implement.
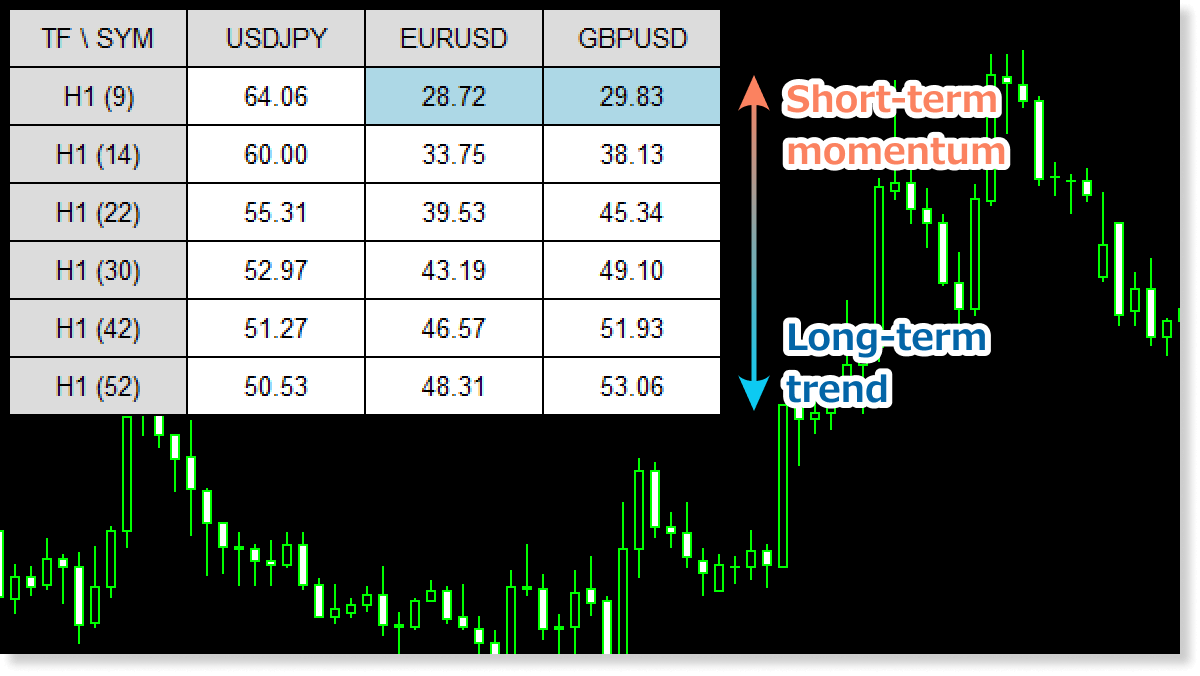
Simultaneously confirming momentum and trend
The RSI Panel Indicator can display RSIs with different periods simultaneously. By grasping trends through medium to long-term RSI while simultaneously understanding momentum through short-term RSI, you can more accurately judge trend sustainability and strength.
Using the RSI Panel Indicator, which allows you to check RSI for various instruments, timeframes, and periods at once, further expands the scope of RSI-based trading strategies. If you normally build your trading around RSI, please make use of the RSI Panel Indicator.
The RSI panel on MT4 may take longer to retrieve data for symbols and timeframes that differ from the chart it's applied to. If the panel doesn't appear quickly or freezes, please allow some time for it to load.
How to install
To use the RSI Panel Indicator, follow the steps below to download and install it.
Step 1
Click the button below to download the indicator for MT4/MT5.
Step 2
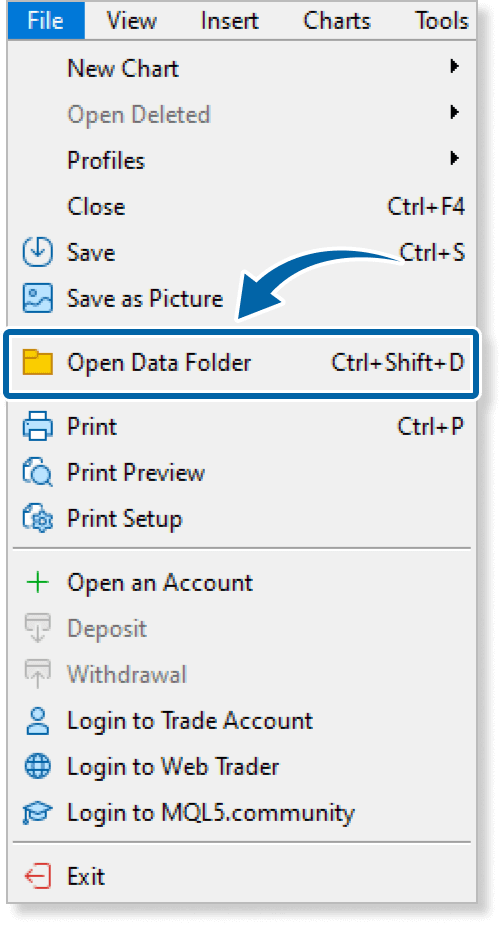
Click File > Open Data Folder in the top menu of MT4/MT5.
Step 3
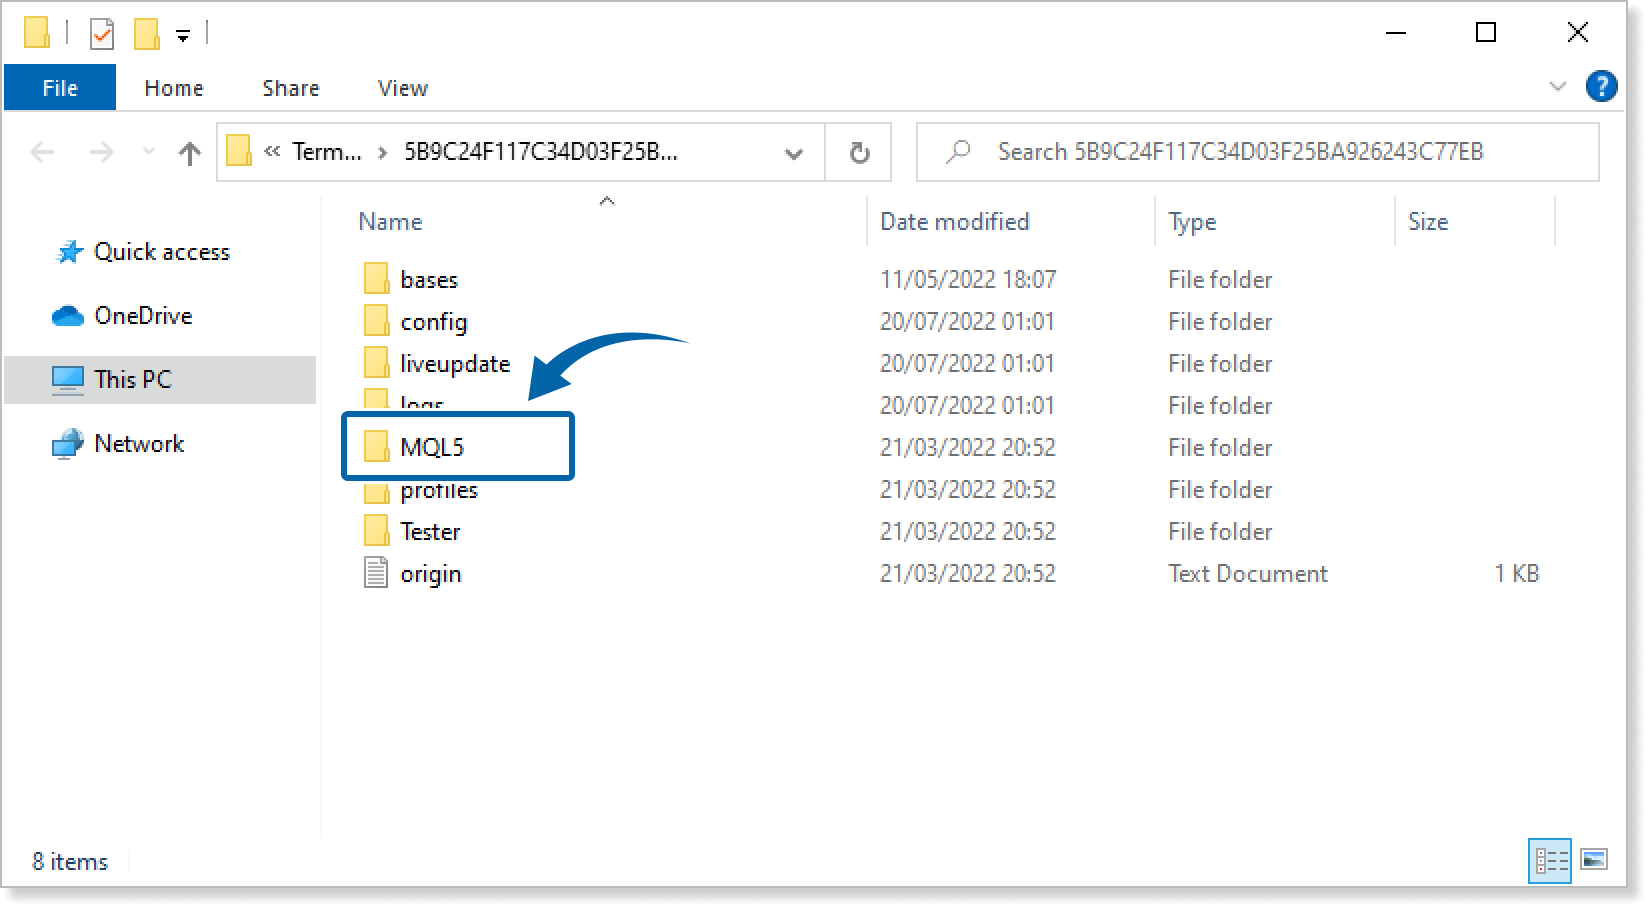
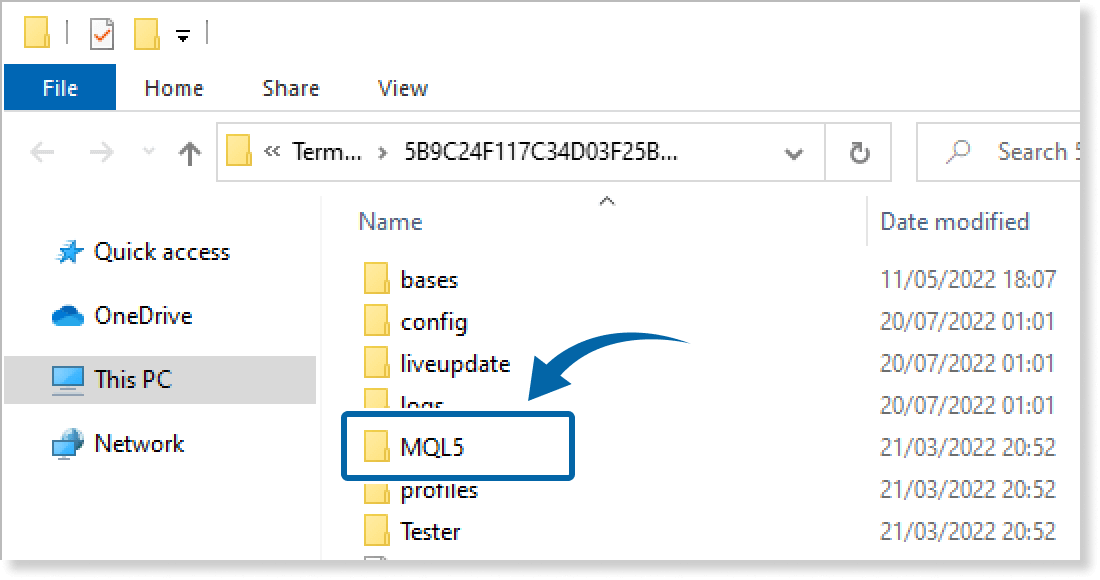
In the data folder, double-click the MQL4 or MQL5 folder.
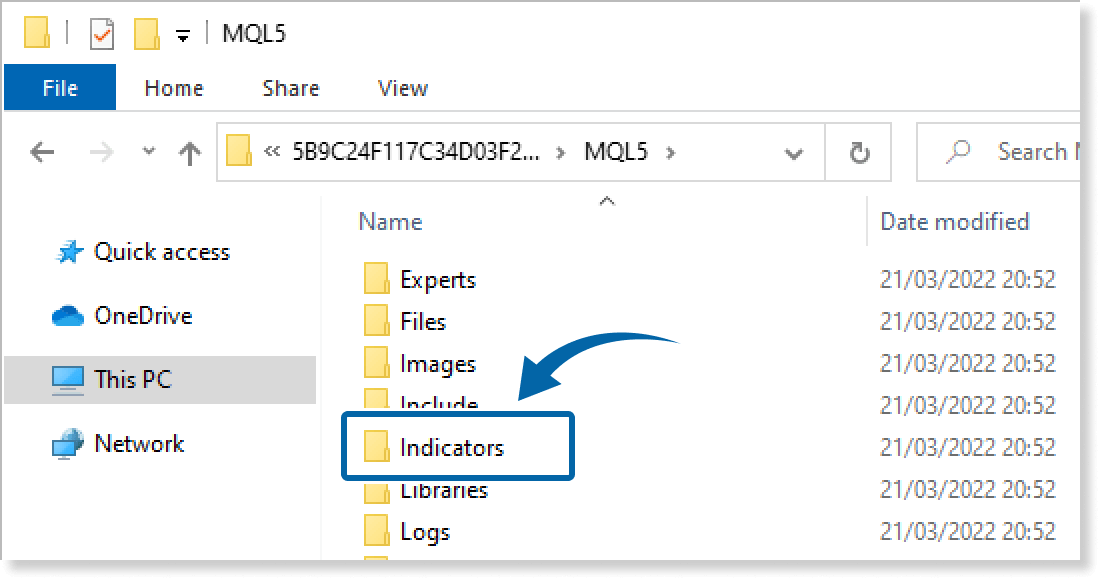
Step 4
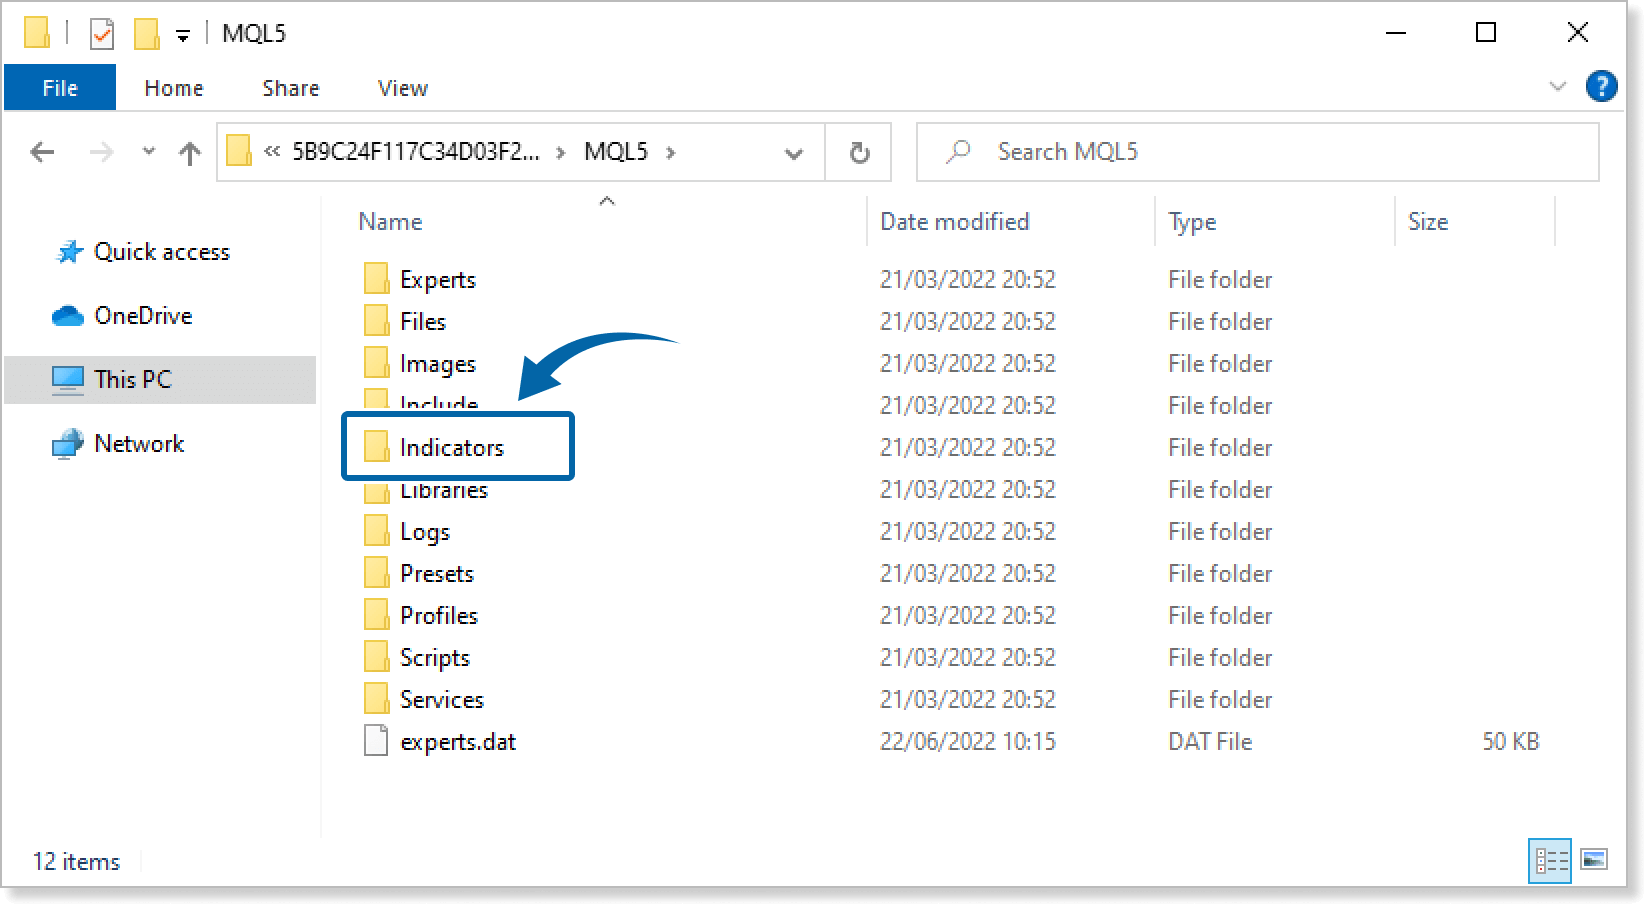
In the MQL4/MQL5 folder, double-click the Indicators folder.
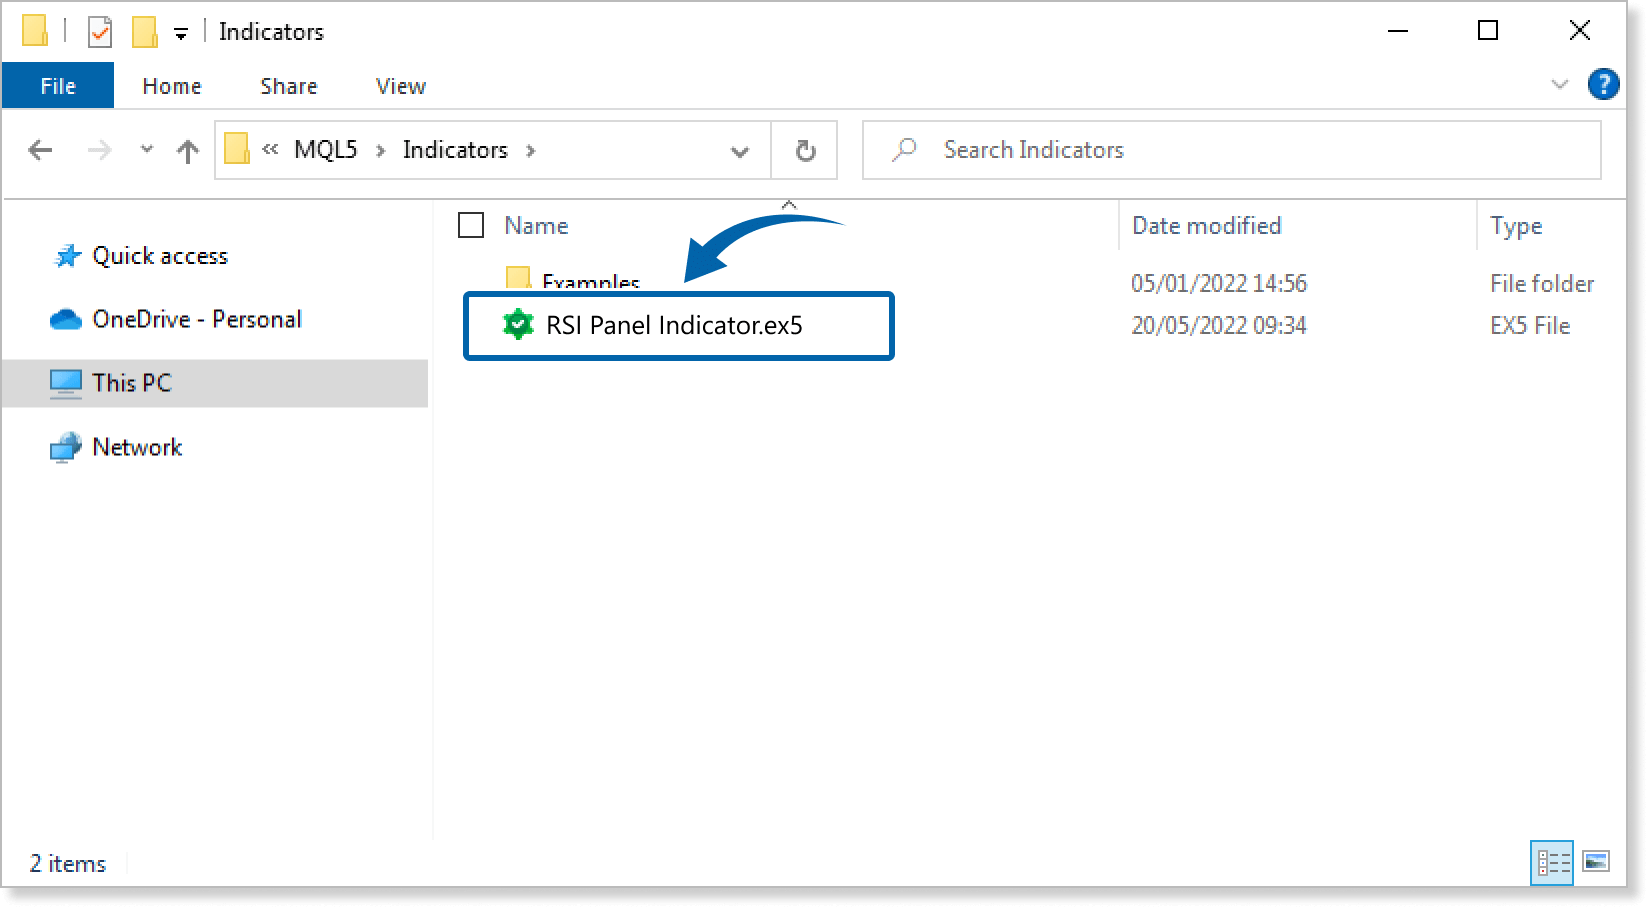
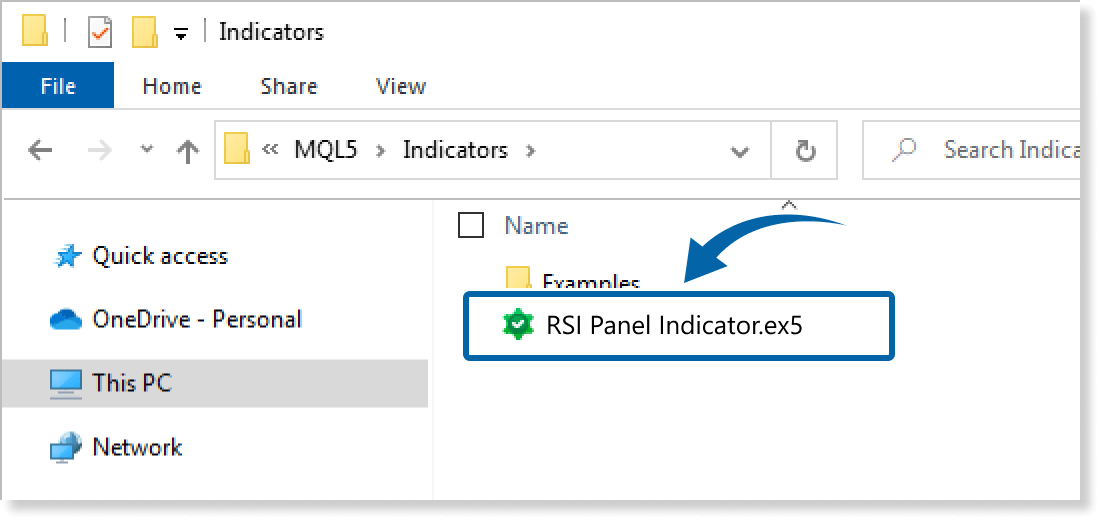
Step 5
Save the RSI Panel Indicator in the Indicators folder.
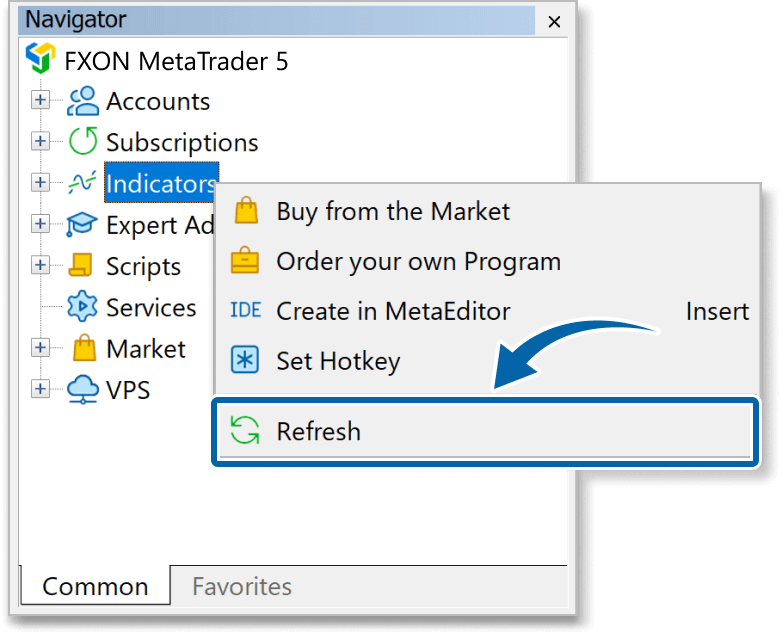
Step 6
Go back to the MT4/MT5. Right-click Indicators in the Navigator, and click Refresh.
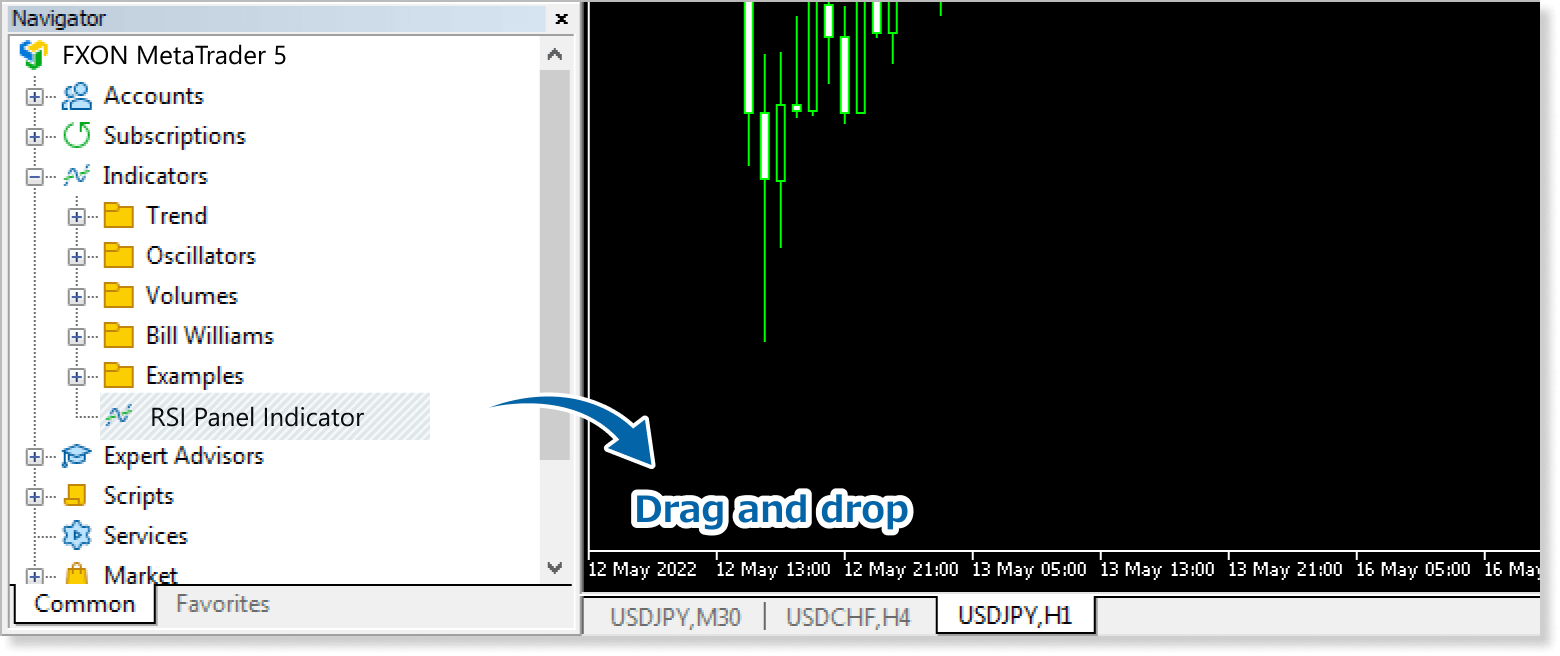
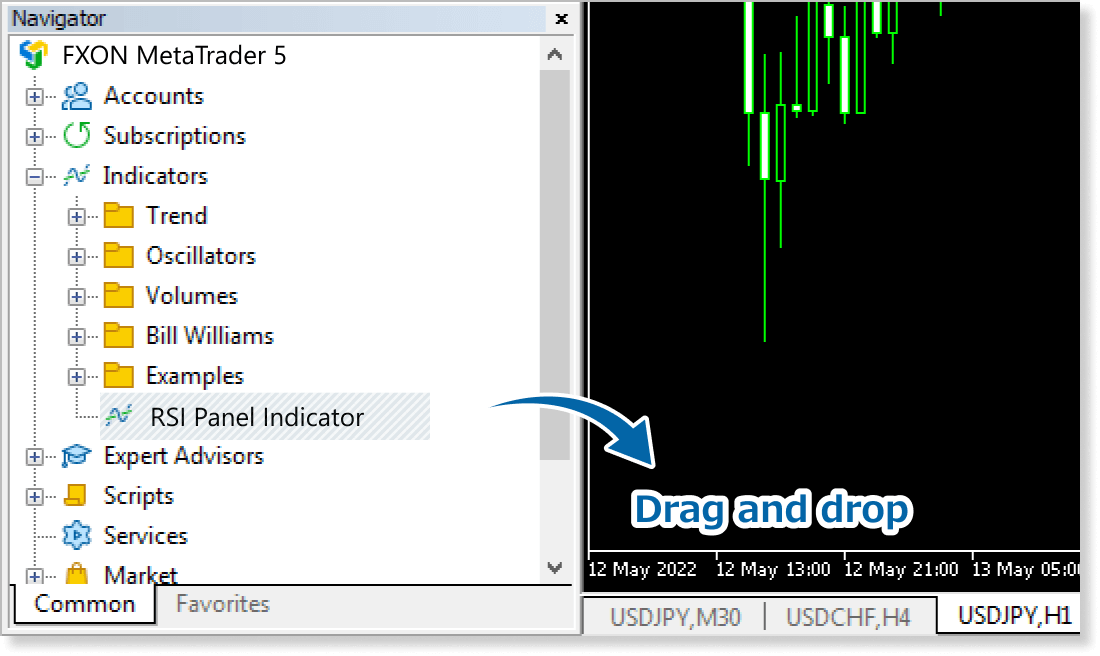
Step 7
In the Navigator, click the + icon next to Indicators. Find the RSI Panel Indicator, then either double-click it or drag it onto a chart.
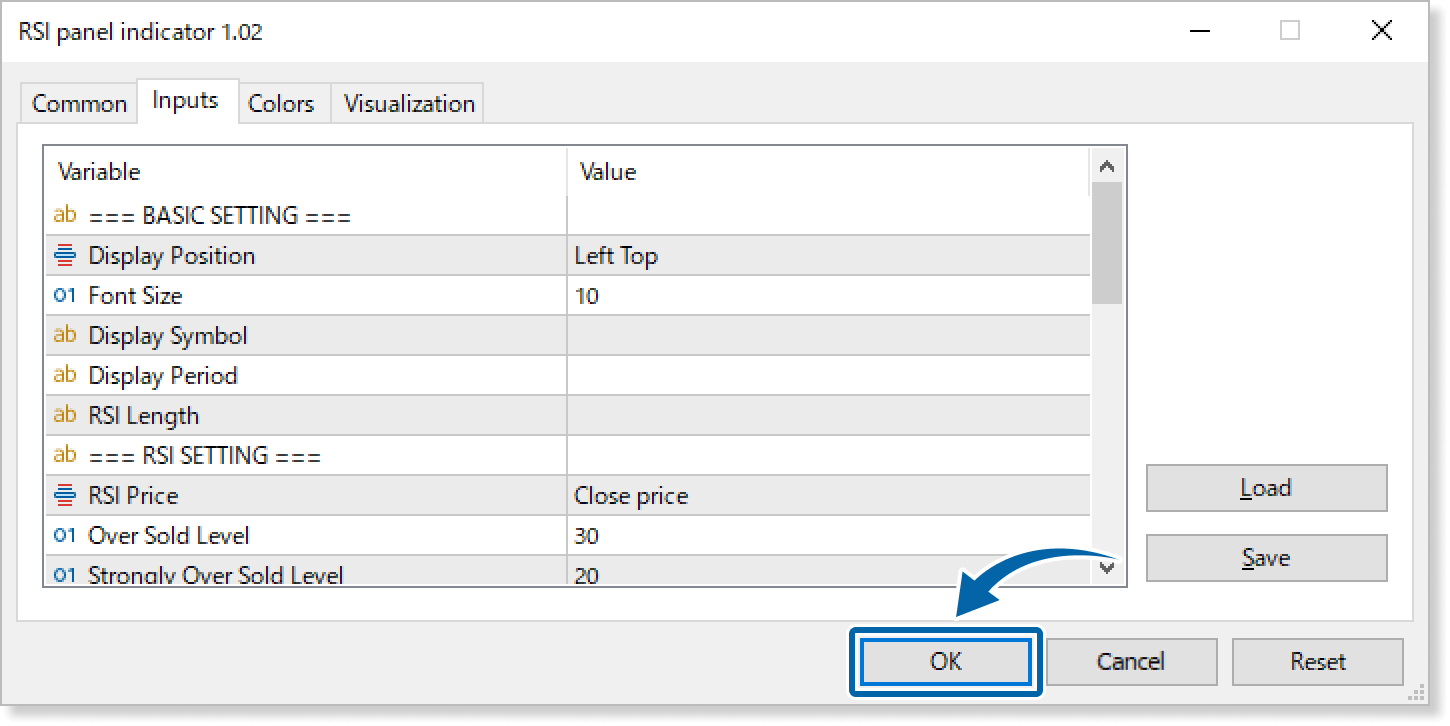
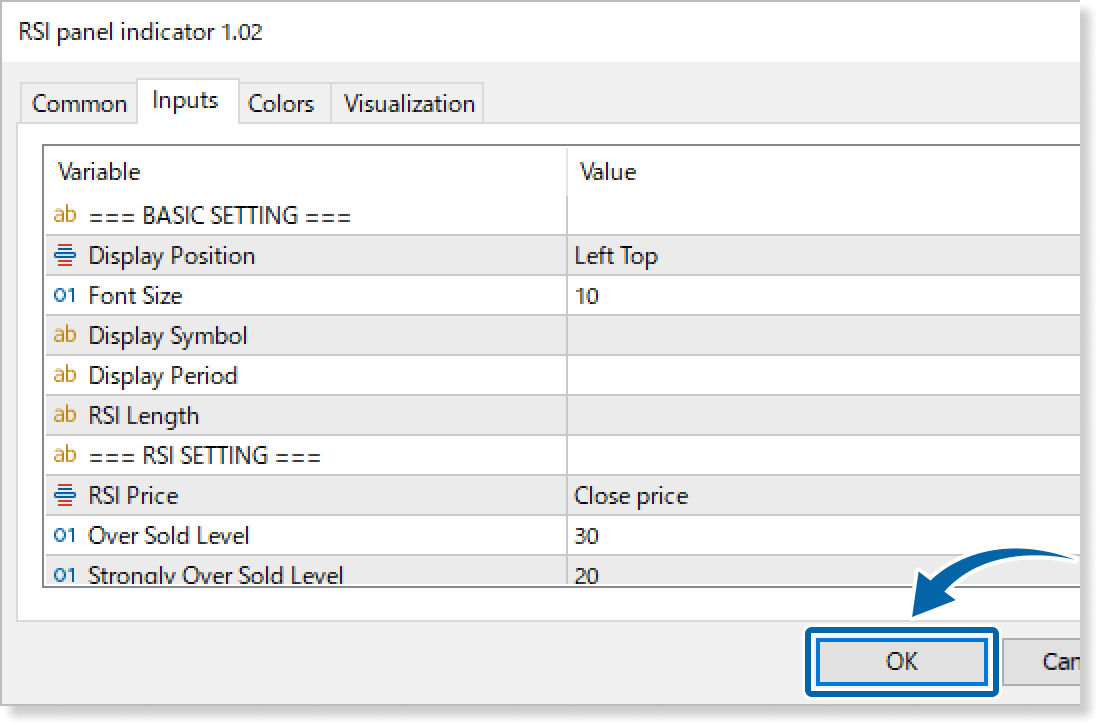
Step 8
In the indicator settings window, customize the settings on the Inputs tab according to the How to set up page, then click OK.
Step 9
The RSI Panel Indicator is applied, displaying the data on the chart.
How to set up
After applying the indicator to the chart, set the parameters according to your style.
Step 1
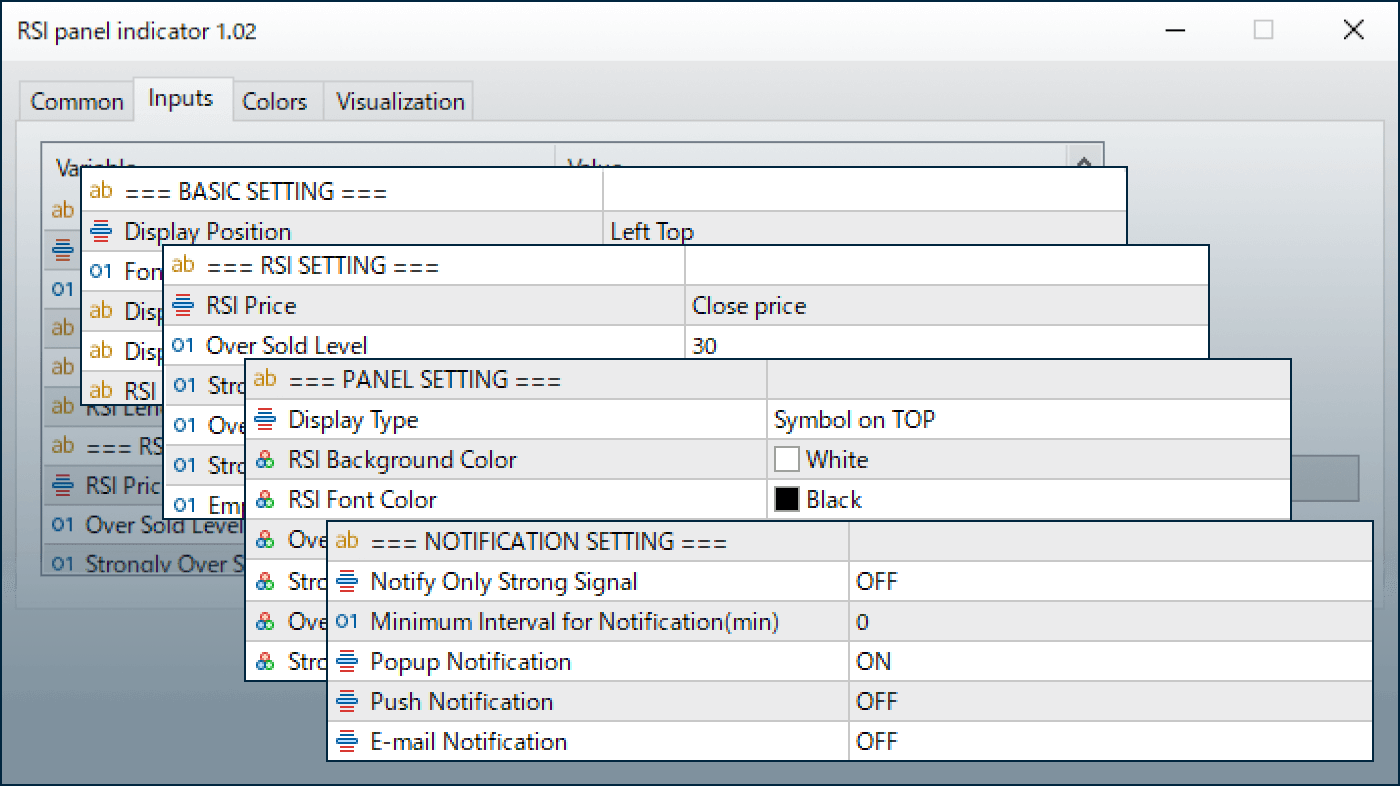
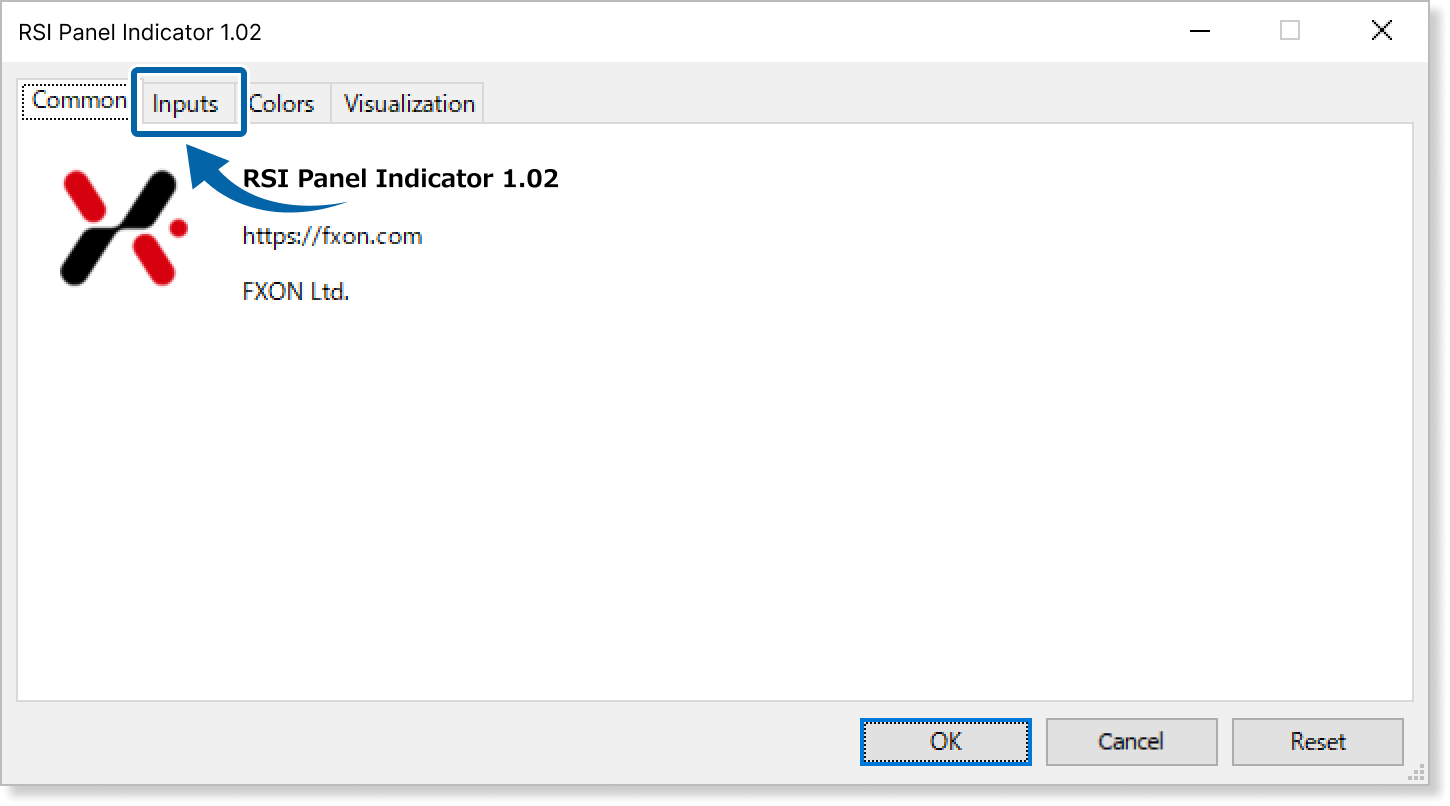
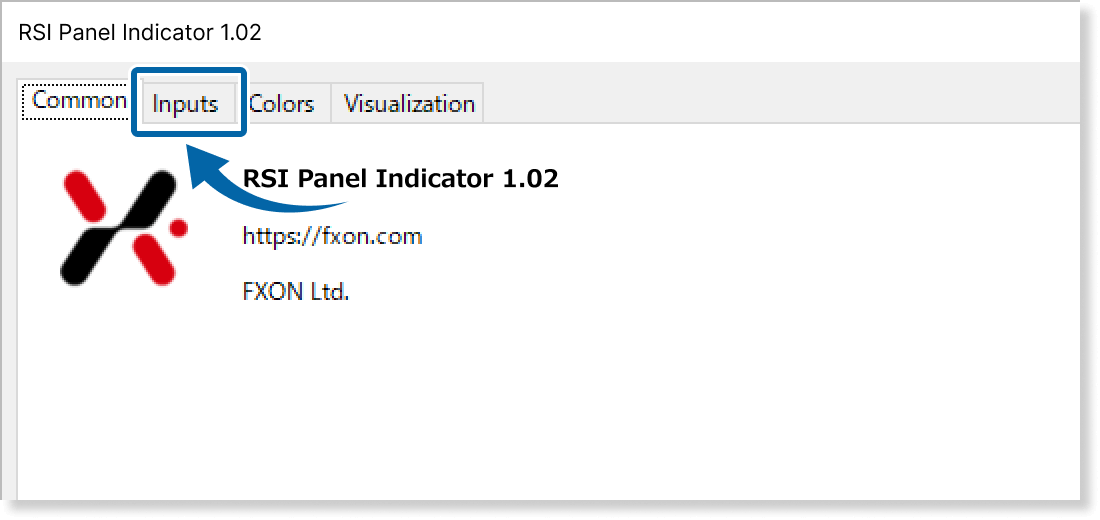
First, open the Inputs tab.
Step 2
Set the parameters as follows.
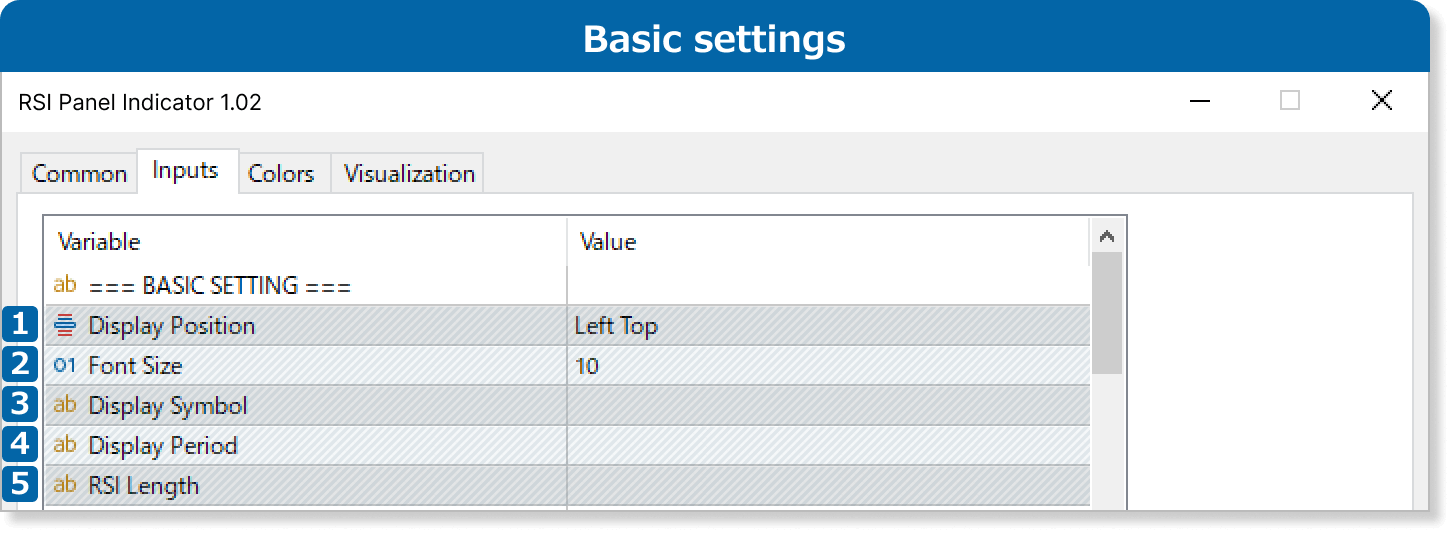
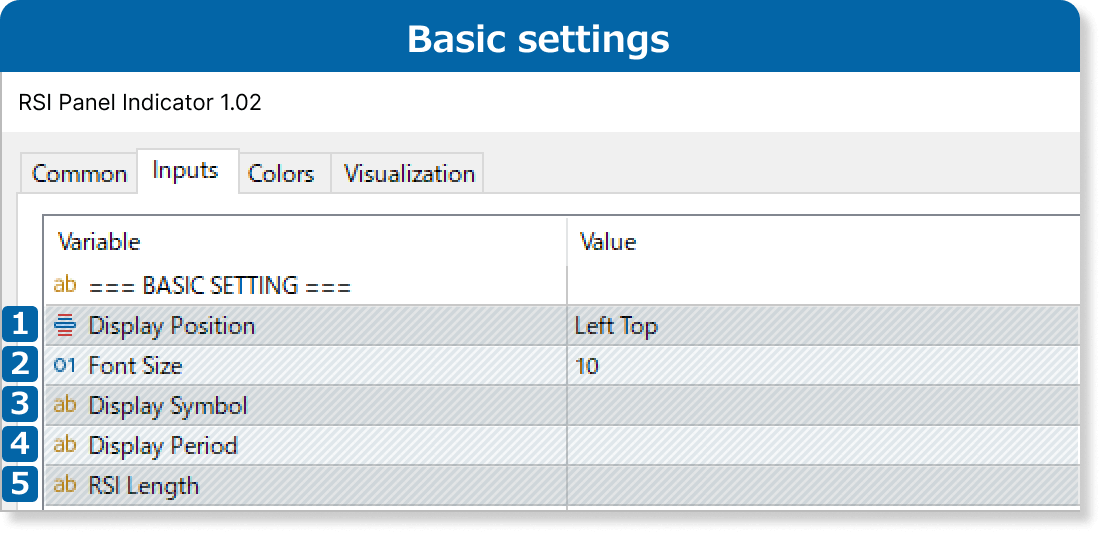
①Display Position
Choose the panel's display location: Left Top, Left Bottom, Right Top, or Right Bottom.
②Font Size
Set the font size for the RSI panel.
③Display Symbol
Enter the symbols to display on the RSI panel, separated by commas (e.g., USDJPY, EURUSD, BTCUSD).
Include the suffix if applicable, such as USDJPY.m, EURUSD.m, or BTCUSD.m.
④Display Period
Enter the timeframes to display on the RSI panel, separated by commas (e.g., M1, M15, H12).
Please enter the timeframes as follows:
Minute: M1, M2, M3, M4, M5, M6, M10, M12, M15, M20, and M30
Hour: H1, H2, H3, H4, H6, H8, and H12
Day: D1
Week: W1
Month: MN
For MT4, only M1, M5, M15, M30, H1, H4, D1, W1, and MN are available.
⑤RSI Length
Enter the periods for calculating the RSIs on the panel, separated by commas (e.g., 14, 21, 30, 14, 14).
This parameter is linked to the Display Period. For example, if you set the parameters as follows, 5-minute RSIs for the period of 14, 21, and 30, and 15-minute RSIs for the period of 14 and 30 will be calculated.
・Display Period: M5, M5, M5, M15, M15
・RSI Length: 14, 21, 30, 14, 30
Errors may occur and the RSI Panel may not display if invalid settings are made, such as entering non-existent instruments in the “Display Symbol” field or having mismatched numbers of entries for “Display Period” and “RSI Length.” Please check the error content displayed in the “Experts” tab of MT4/MT5 and correct the settings.
Also, if the RSI Panel displays differently from what you expected even without errors, please check again for any setting deficiencies.
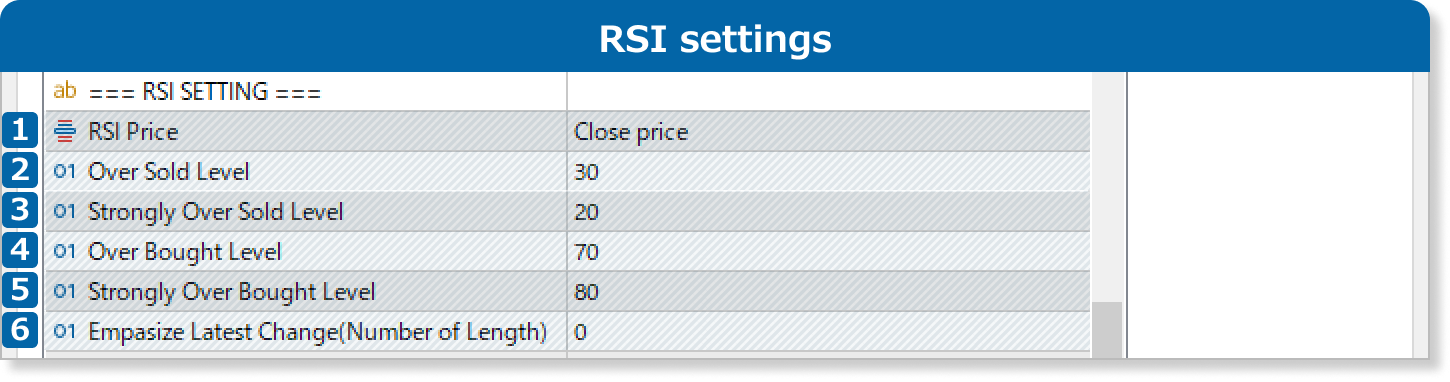
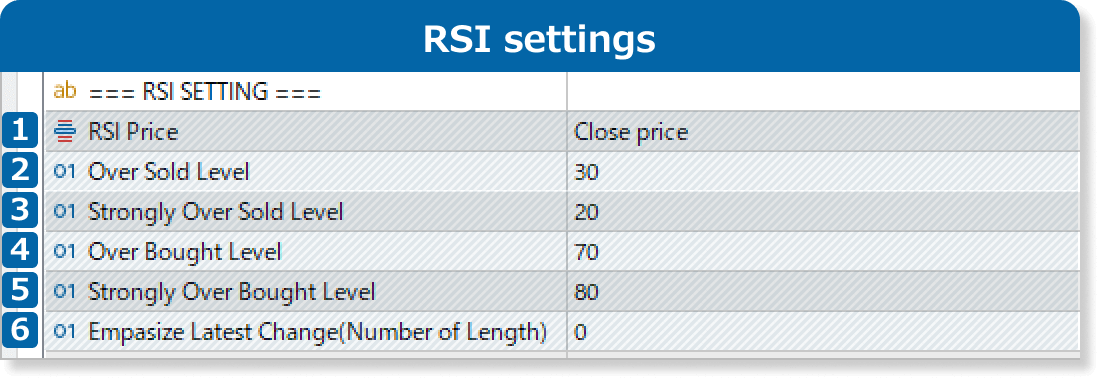
①RSI Price
Select the price to use for calculating RSI values.
・Close price
・Open price
・High price
・Low price
・Median price: (high price + low price) ÷2
・Typical price: (high price + low price + close price) ÷3
・Weighted price: (high price + low price + close price×2) ÷4
②Over Sold Level
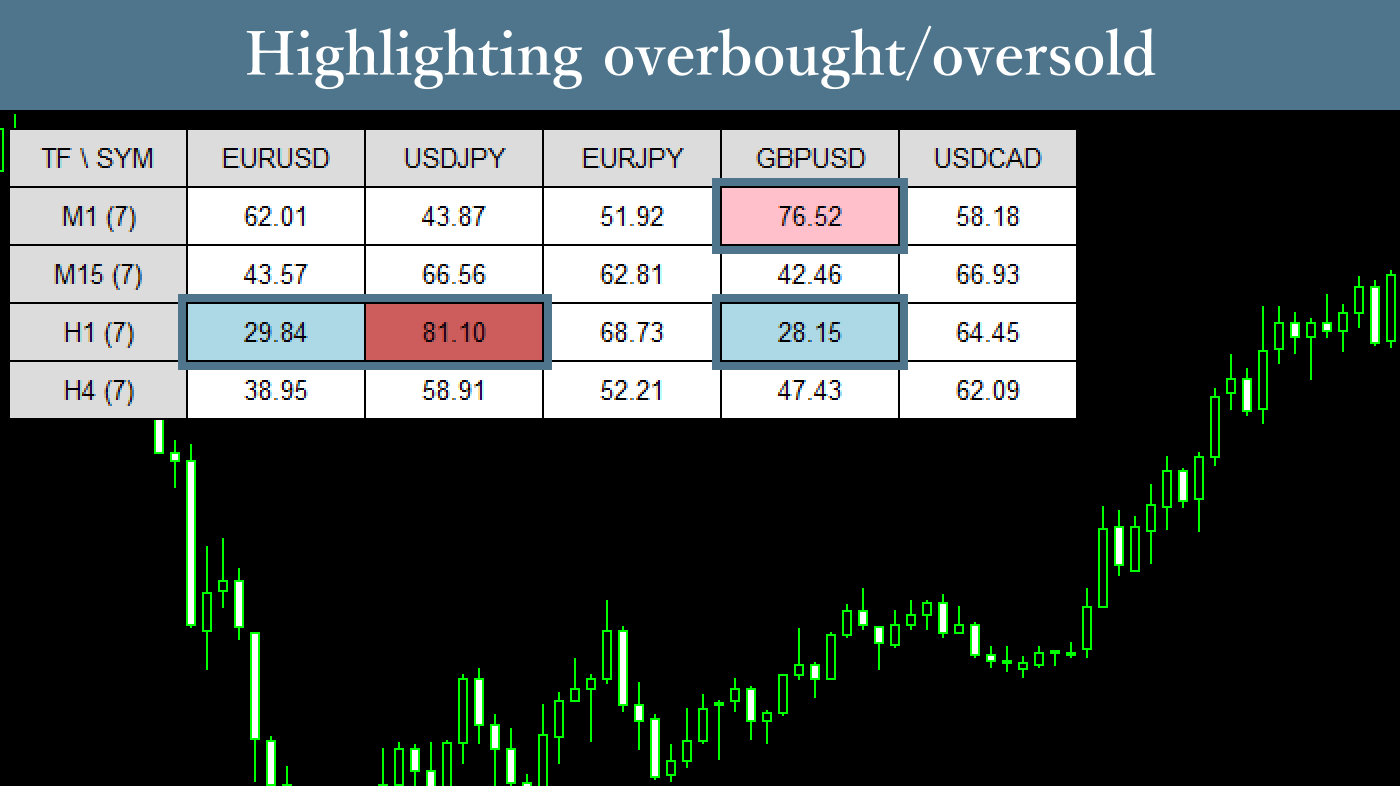
Set the minimum RSI value to define an oversold condition. For example, if set to 30, symbol and timeframe combinations with an RSI of 30 or lower will be highlighted.
③Strongly Over Sold Level
Set the minimum RSI value to define a strongly oversold condition. For example, if set to 20, symbol and timeframe combinations with an RSI of 20 or lower will be highlighted.
④Over Bought Level
Set the maximum RSI value to define an overbought condition. For example, if set to 70, symbol and timeframe combinations with an RSI of 70 or higher will be highlighted.
⑤Strongly Over Bought Level
Set the maximum RSI value to define a strongly overbought condition. For example, if set to 80, symbol and timeframe combinations with an RSI of 80 or higher will be highlighted.
⑥Emphasize Latest Change(Number of Length)
Bold the text for a specified number of bars when RSI crosses an overbought or oversold level.
For example, if set to 3 for a symbol in M5, the text will remain highlighted for 3 bars (15 minutes) after RSI crosses a condition level.
To disable this feature, set it to 0 or lower.

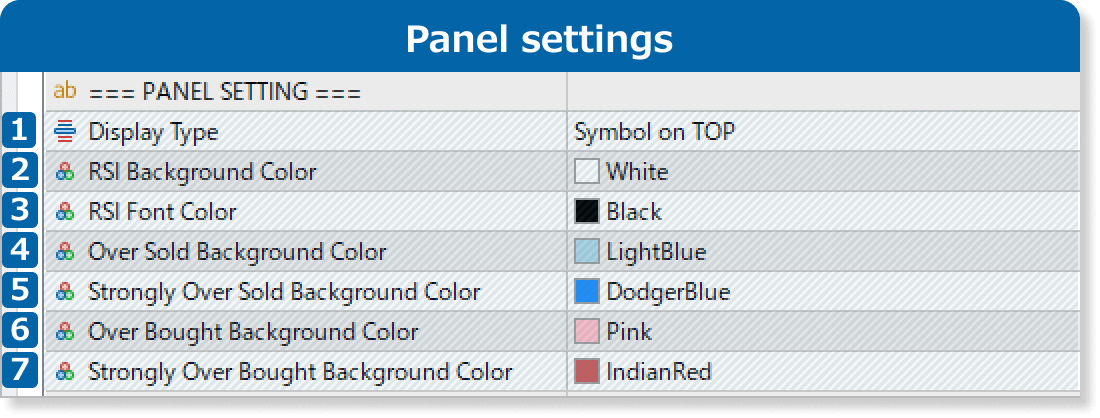
①Display Type
Select a panel layout: 'Symbol on top' or 'Timeframe on top'.
②RSI Background Color
Select a background color for RSI.
③RSI Font Color
Select a text color for RSI.
④Over Sold Background Color
Select a background color for the oversold condition.
⑤Strongly Over Sold Background Color
Select a background color for the strongly oversold condition.
⑥Over Bought Background Color
Select a background color for the overbought condition.
⑦Strongly Over Bought Background Color
Select a background color for the strongly overbought condition.

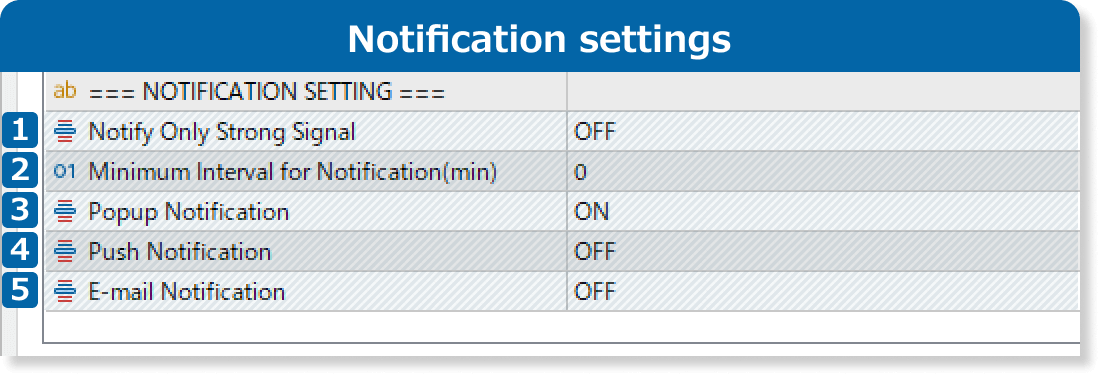
①Notify Only Strong Signal
If enabled, alerts will be triggered only for strongly overbought/oversold conditions, not for regular overbought/oversold conditions.
②Minimum Interval for Notification(min)
Once a notification is triggered, another for the same symbol will not be sent until the specified time has passed. If set to 0 or lower, there will be no minimum interval between notifications.
③Popup Notification
When set to ON, you'll receive popup notifications on MT4/MT5 for PC.
④Push Notification
When set to ON, you'll receive popup notifications on the MT4/MT5 mobile app.
⑤E-mail Notification
When set to ON, you'll receive email notifications.
Updates