#technical
#subchart
#technical
#subchart
Downloaded:
0
times
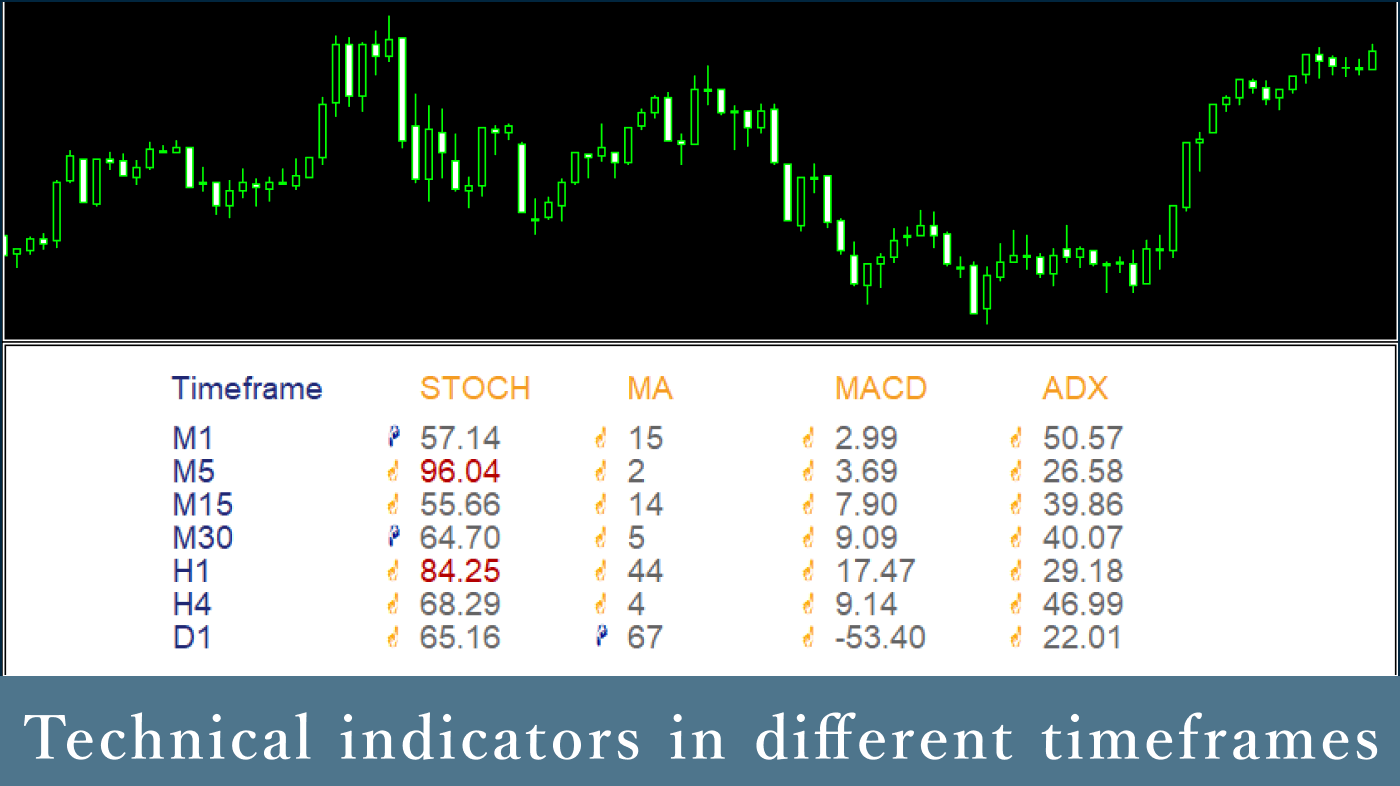
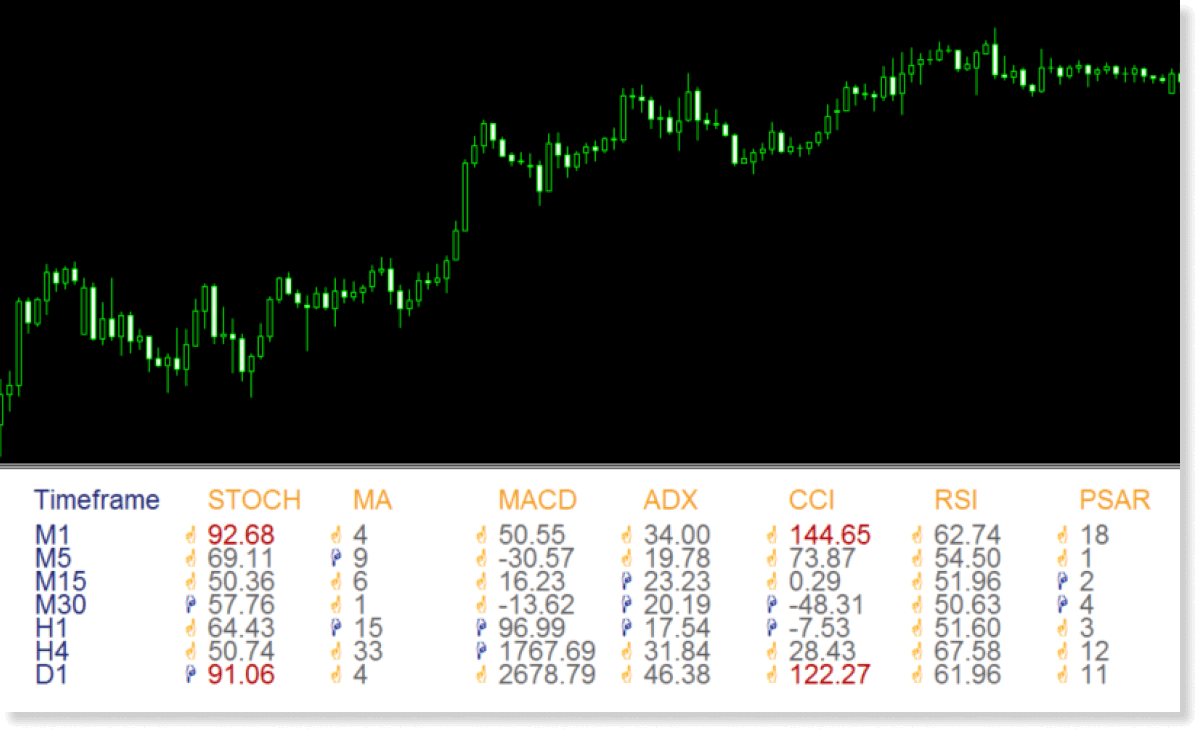
The Multi-Timeframe Trend Analysis Indicator is a tool that allows you to display technical indicators from different timeframes and symbols on a single chart, supporting up to seven indicators. You can easily monitor trends from various timeframes or symbols, including Stochastics and MACD, all at a glance. Additionally, the upward or downward movements of each indicator are displayed with finger icons, making it easier to grasp the overall market trend.
Downloaded:
0
times
Usage scenarios
Market analysis combining technical indicators across multiple timeframes
By using the Multi-Timeframe Trend Analysis Indicator, you can display technical indicators from multiple timeframes simultaneously. This enables you to make trading decisions, such as executing trades only when the lower timeframe aligns with the trend direction of the higher timeframe. It can be effectively utilized for determining trading timing and conducting market analysis.
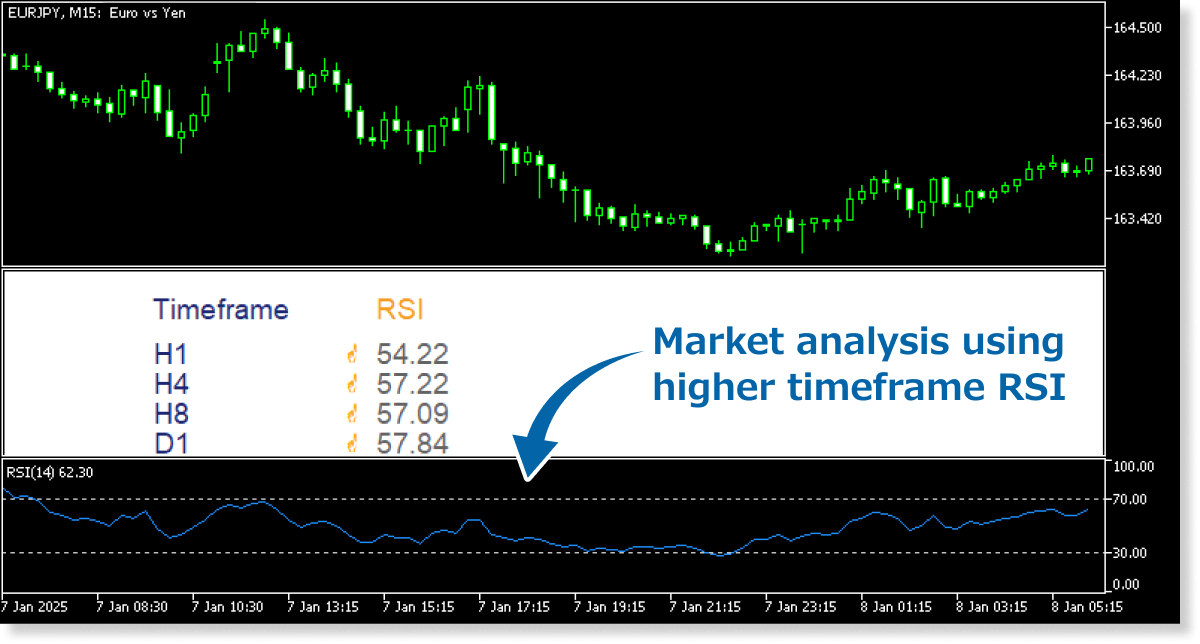
You can apply the indicator settings above by downloading the settings file from the button below and importing it.
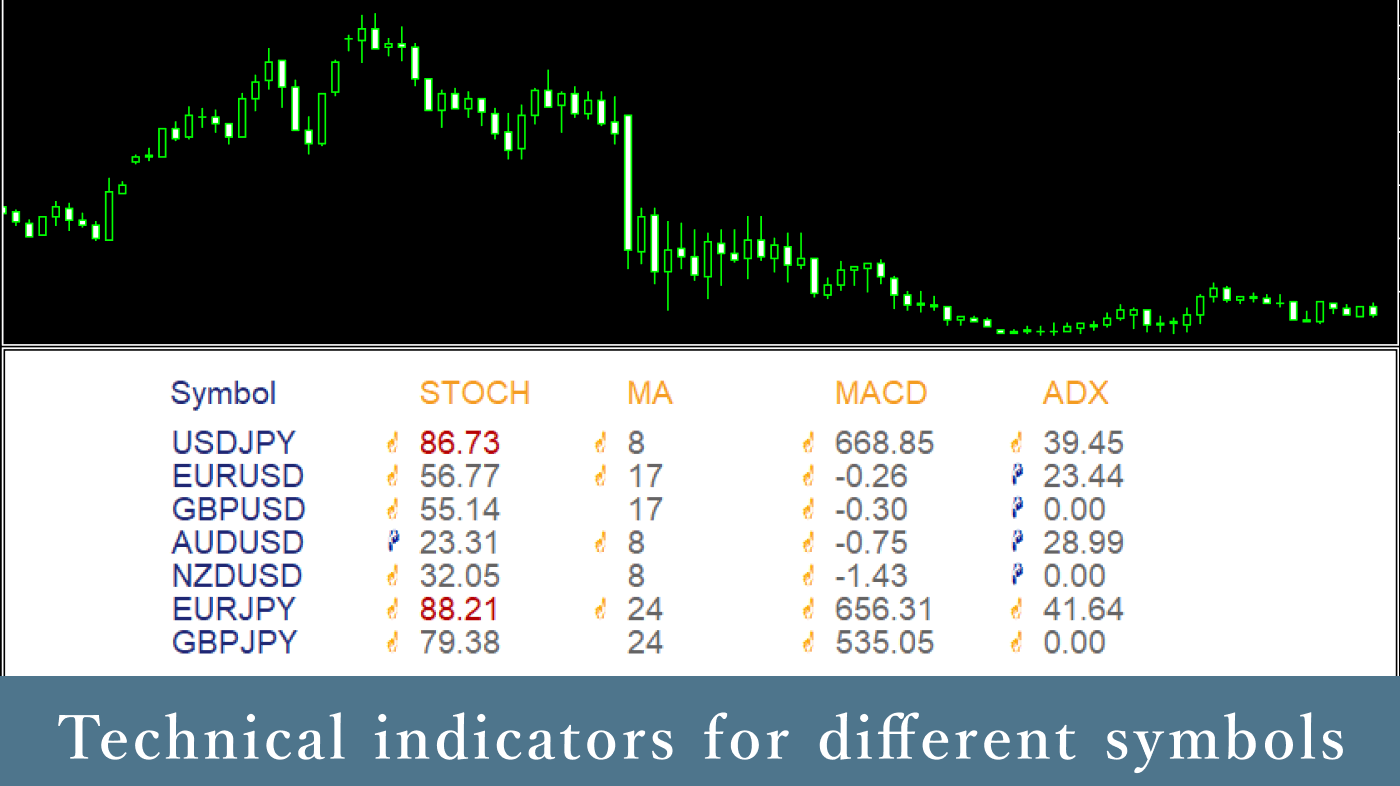
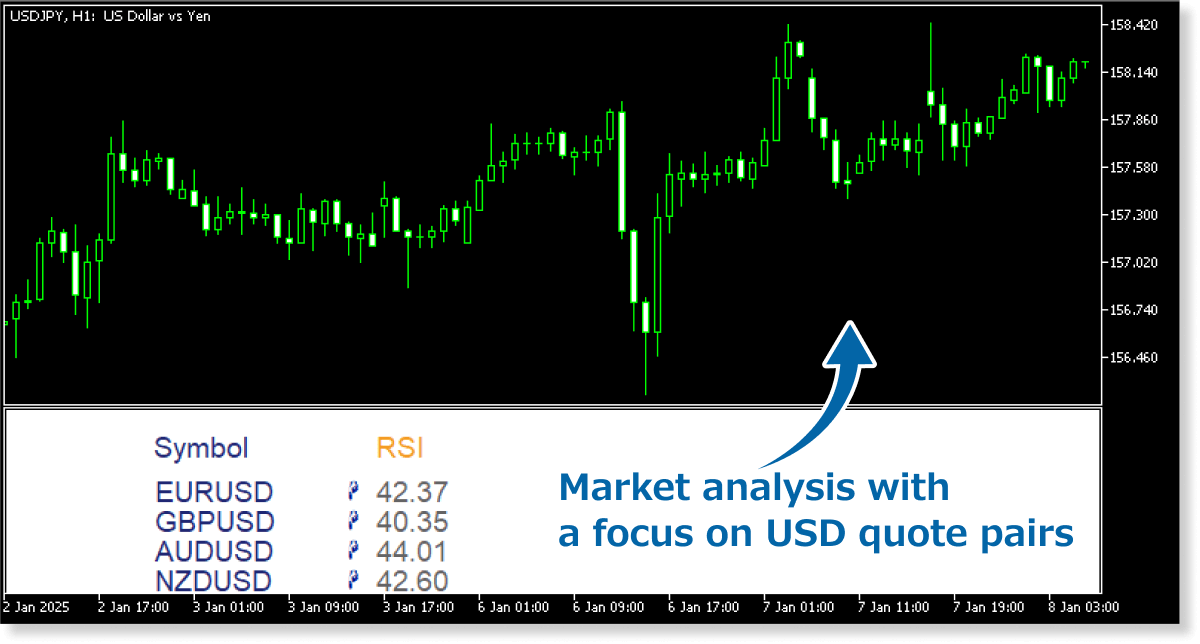
DownloadMarket analysis with an awareness of correlations between instruments
The indicator can be used for market analysis and trading decisions with a focus on correlated instruments. For example, you might consider a buy entry for instruments where USD is the quote currency when the US Dollar Index (DXY) enters a downtrend. By analyzing the correlations between instruments, you can make informed decisions on trading timing and market strategies.
 Download
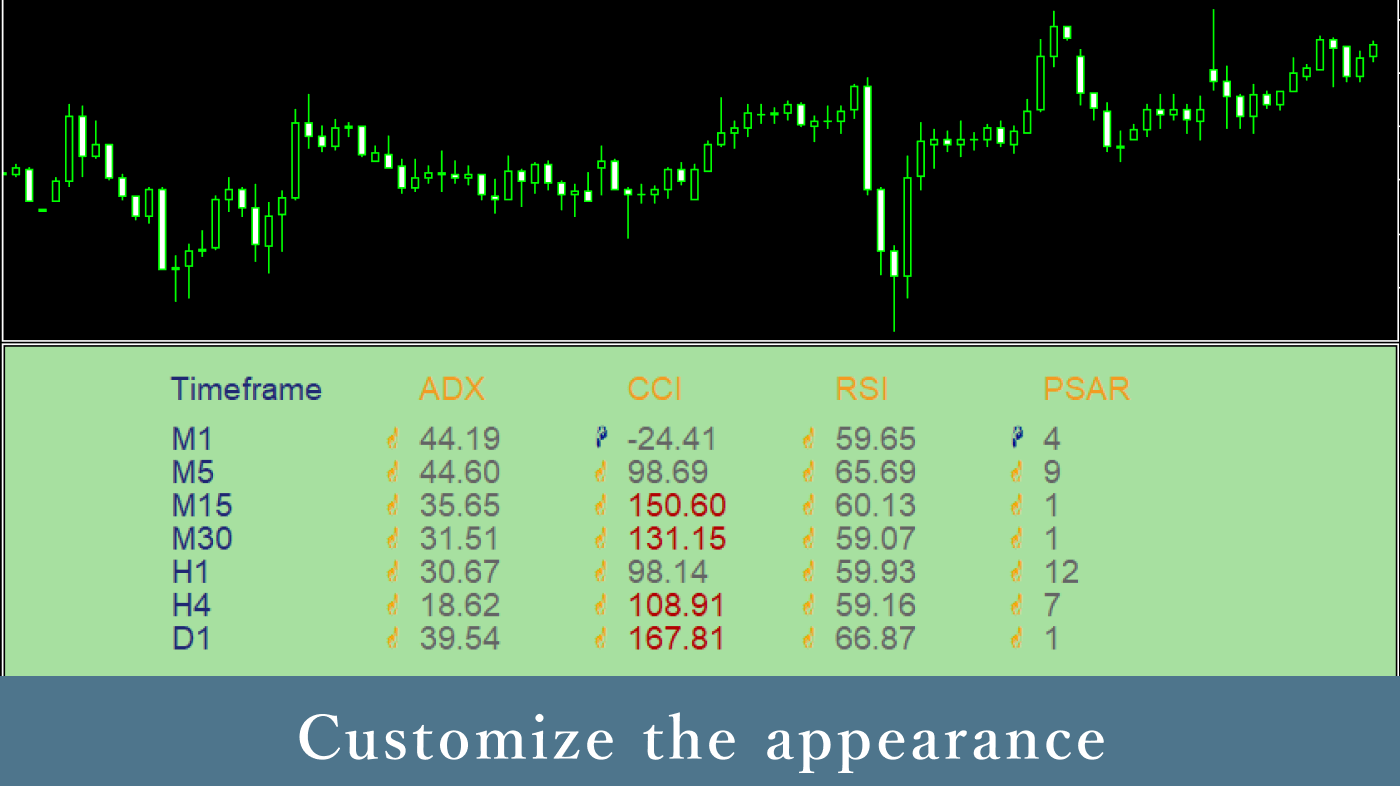
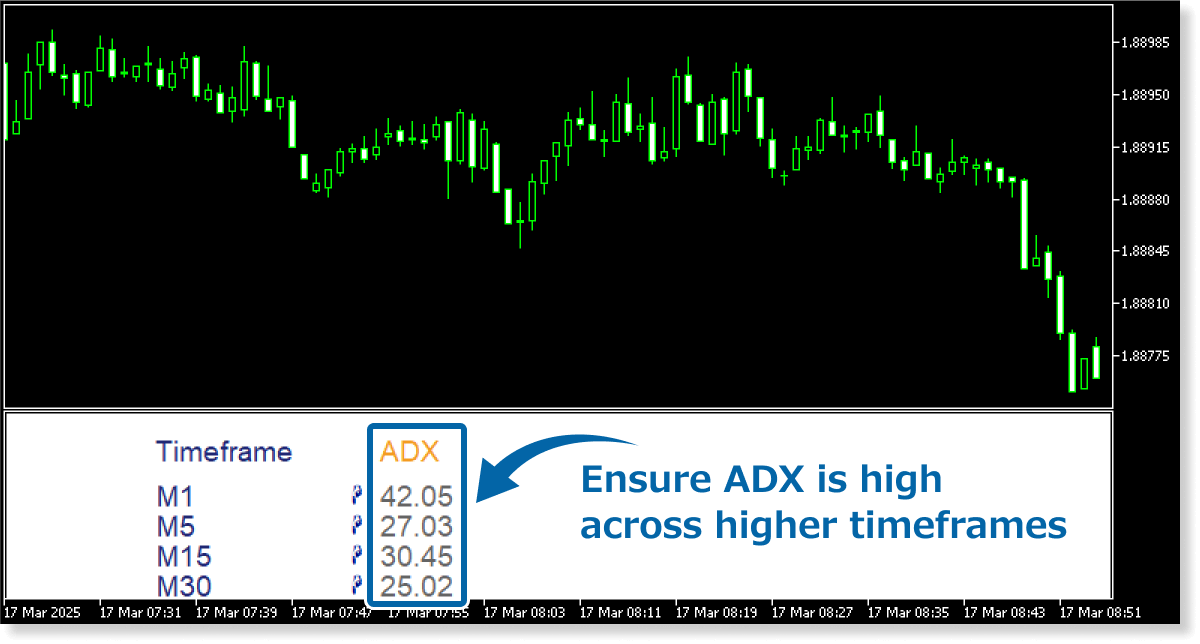
Judge trend strength with higher accuracy
Compare technical indicators, such as ADX, across multiple timeframes to assess trend strength from a broader perspective.
For instance, if the ADX is high across several timeframes, it signals a strong trend that is likely to persist for a longer duration, making it a good opportunity to follow the trend. On the other hand, if higher timeframes show low ADX values, maybe it’s better to avoid following the current trend, even if the ADX is high on the shorter timeframe.
Combine with the ATR Bands Indicator
Combine this indicator with FXON’s ATR Bands Indicator to display ATR levels across any timeframe and gain deeper multi-timeframe insights.
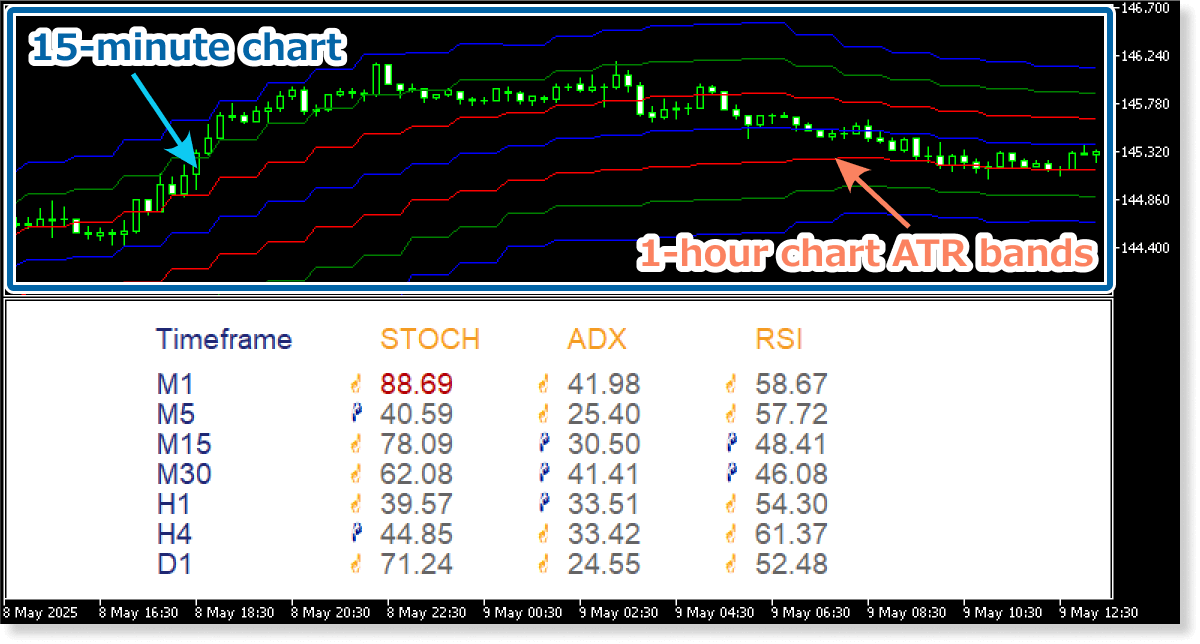
With this single indicator, you can view the technical indicator values across multiple timeframes and instruments in one list. It serves as a comprehensive support tool for conducting advanced trend analysis. We encourage you to make the most of it!
How to install
To use the Multi-Timeframe Trend Analysis Indicator, follow the steps below to download and install it.
Step 1
Click the button below to download the indicator for MT4/MT5.
Step 2
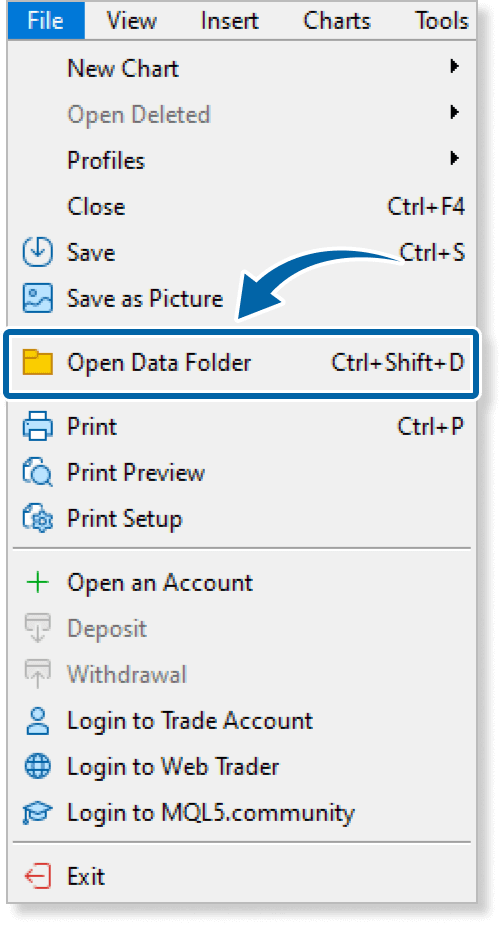
Click File > Open Data Folder in the top menu of MT4/MT5.
Step 3
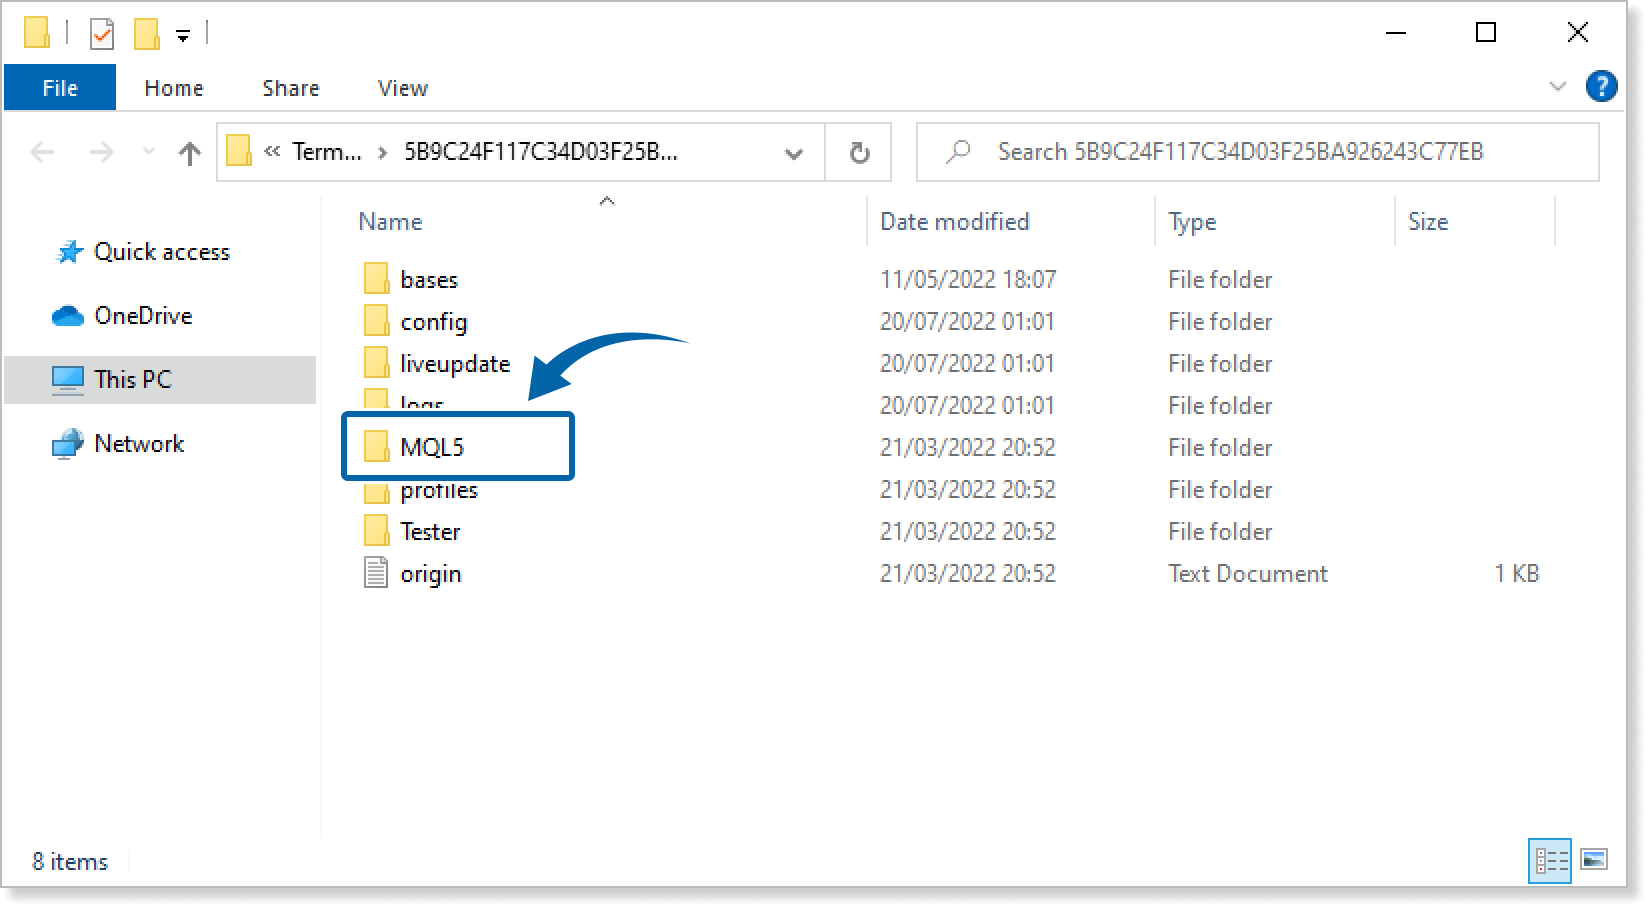
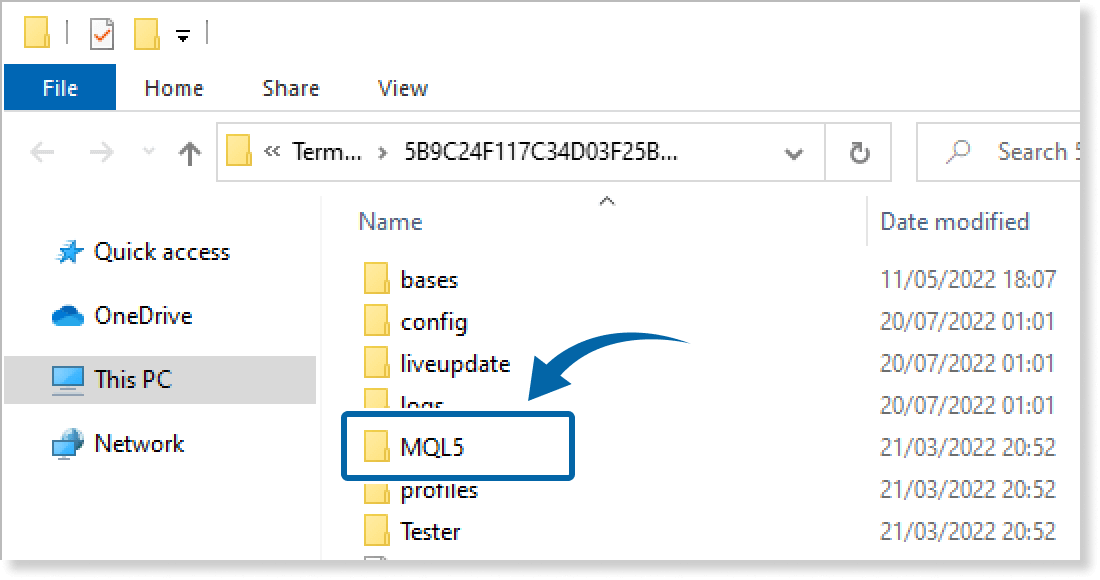
In the data folder, double-click the MQL4 or MQL5 folder.
Step 4
In the MQL4/MQL5 folder, double-click the Indicators folder.
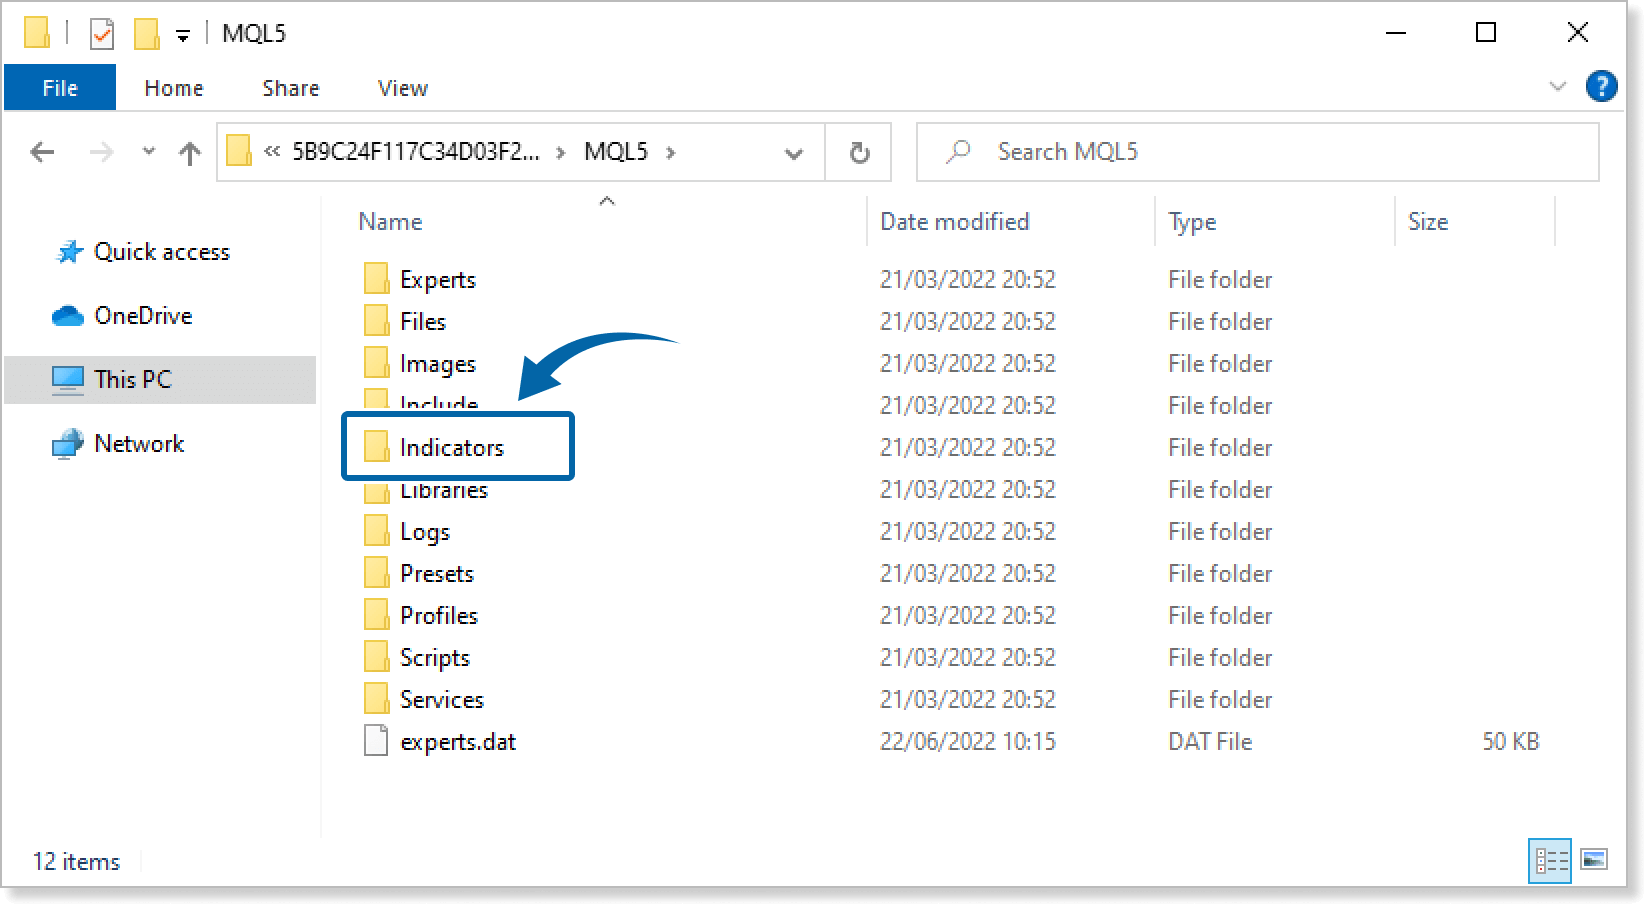
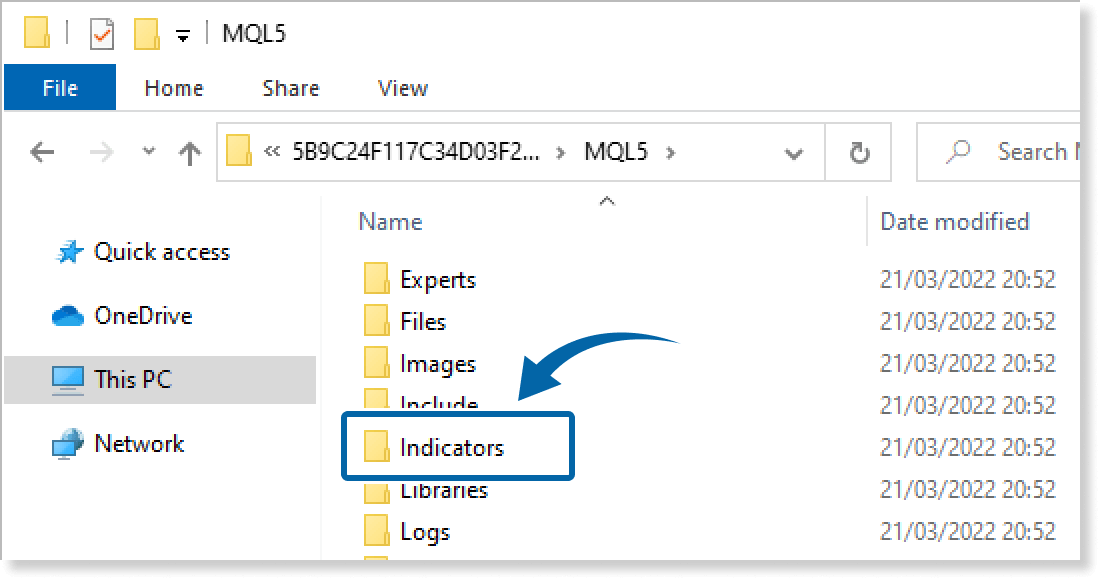
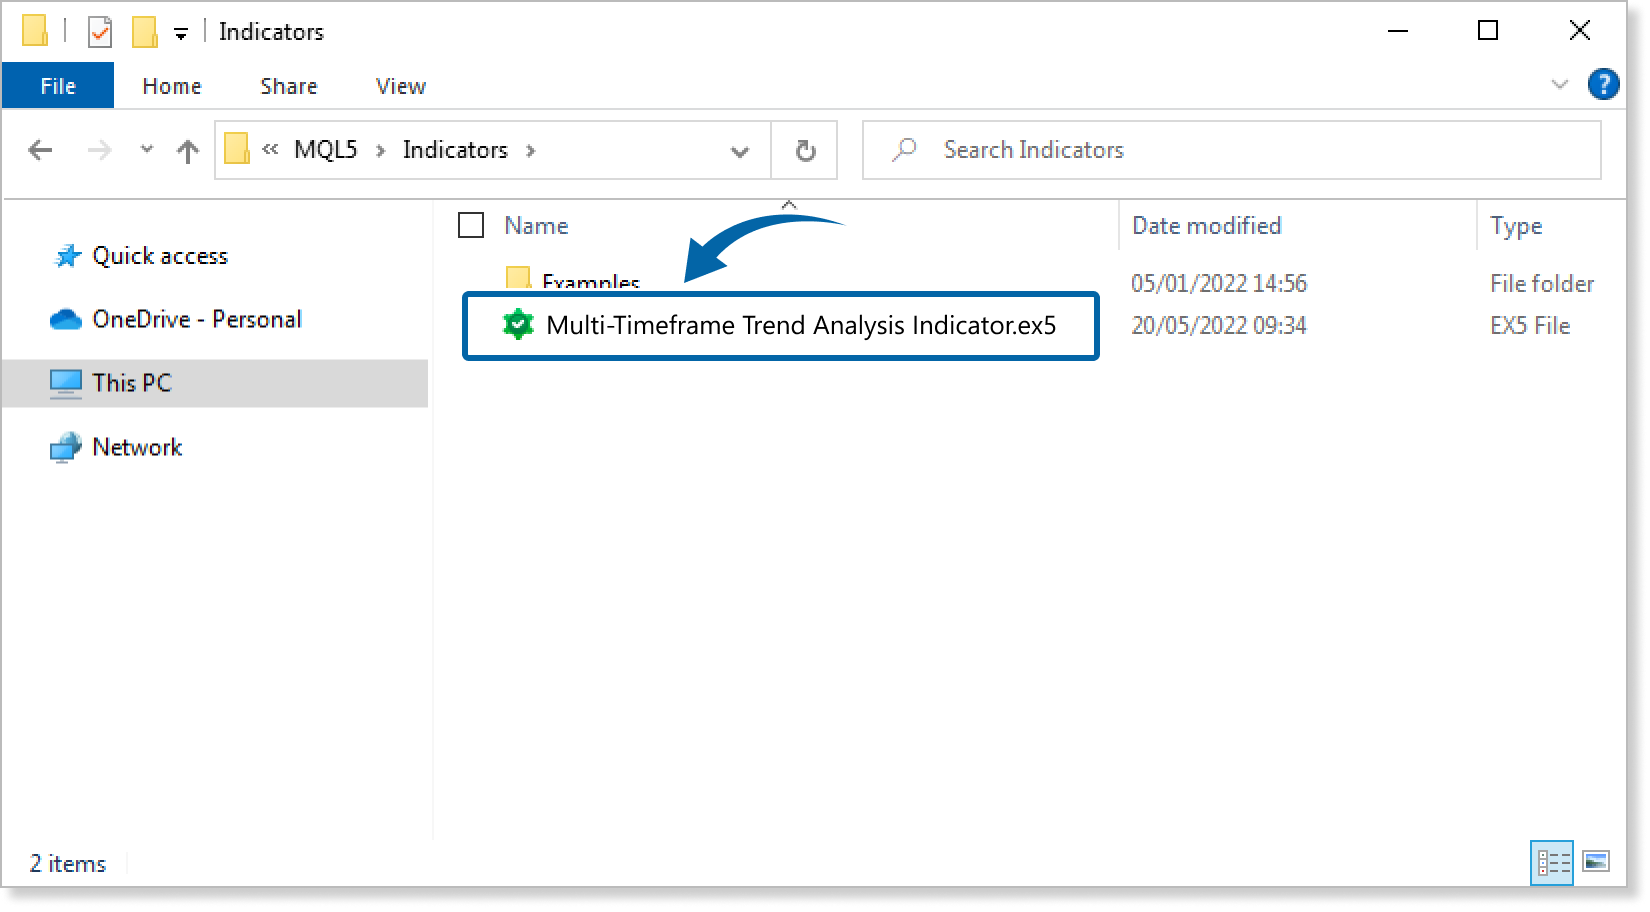
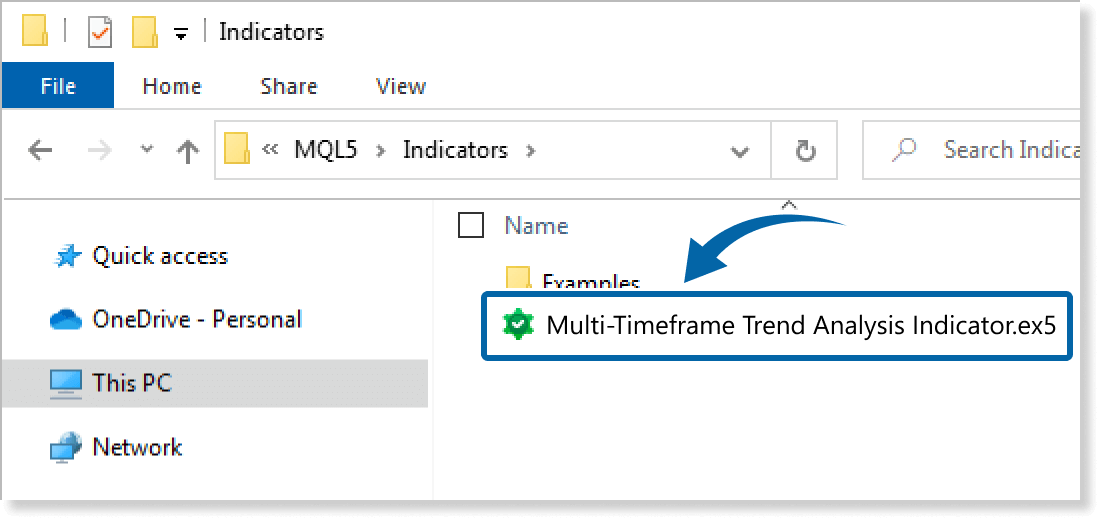
Step 5
Save the Multi-Timeframe Trend Analysis Indicator in the Indicators folder.
Step 6
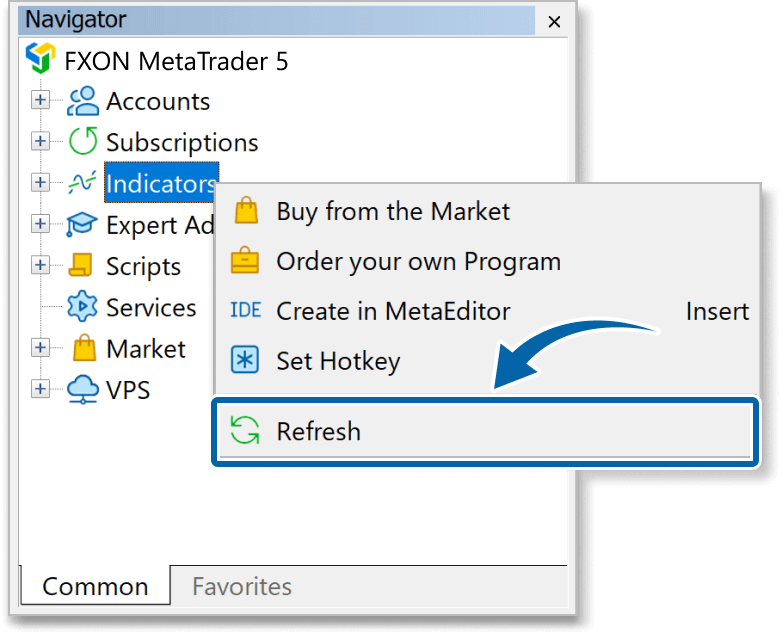
Go back to the MT4/MT5. Right-click Indicators in the Navigator, and click Refresh.
Step 7
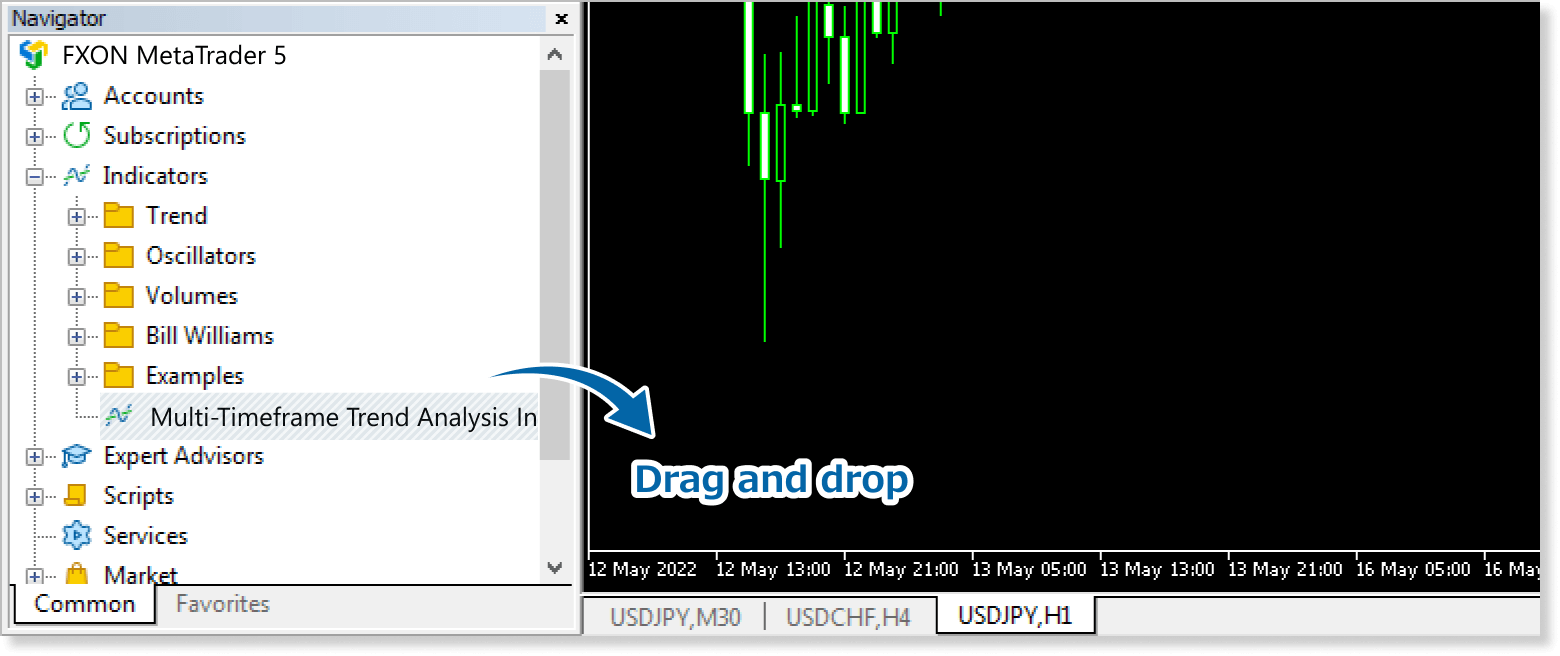
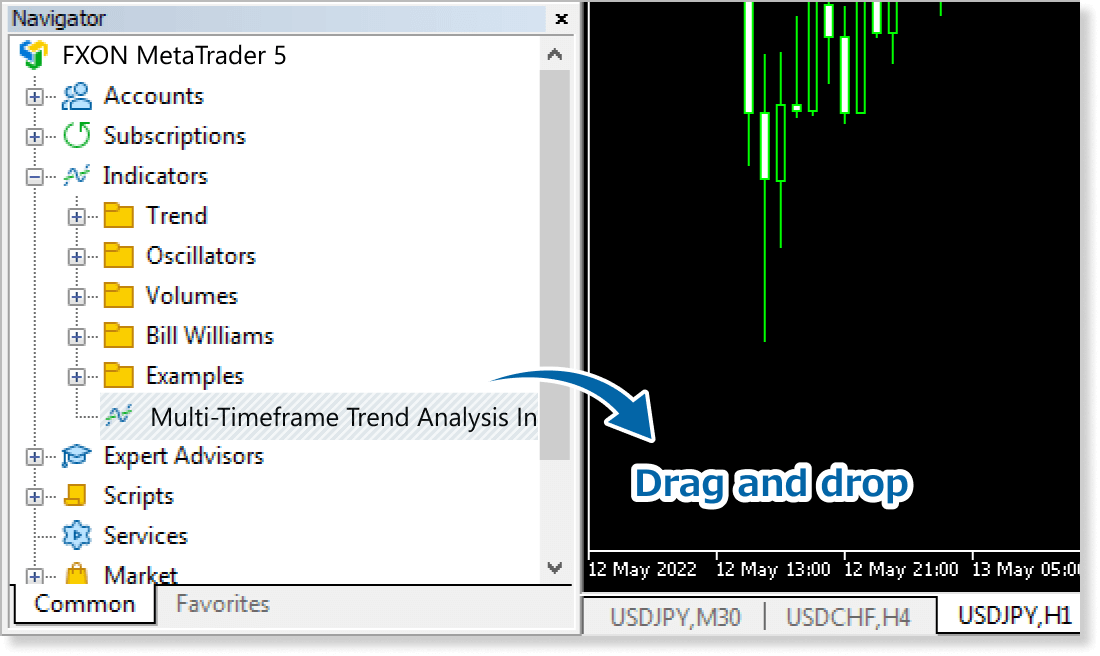
In the Navigator, click the + icon next to Indicators. Find the Multi-Timeframe Trend Analysis Indicator, then either double-click it or drag it onto a chart.
Step 8
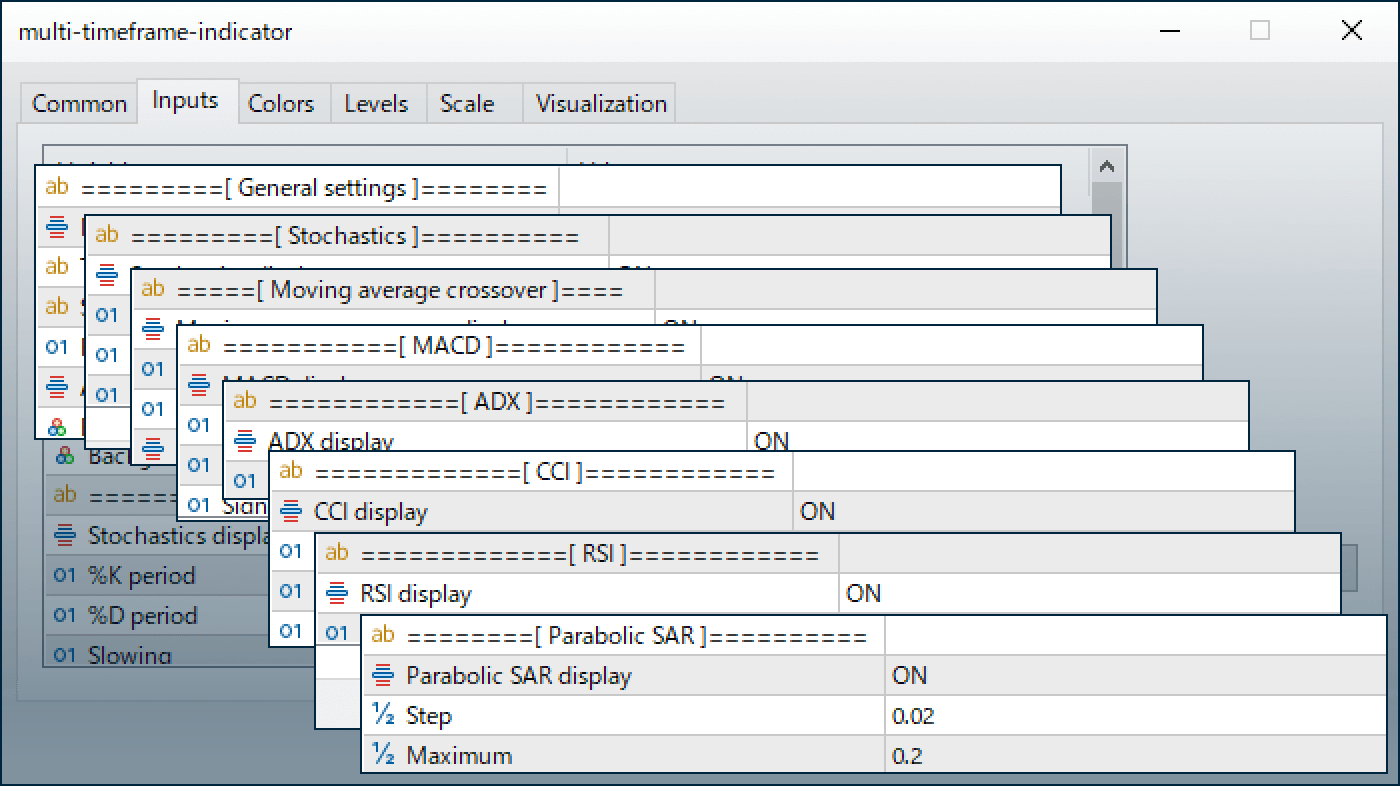
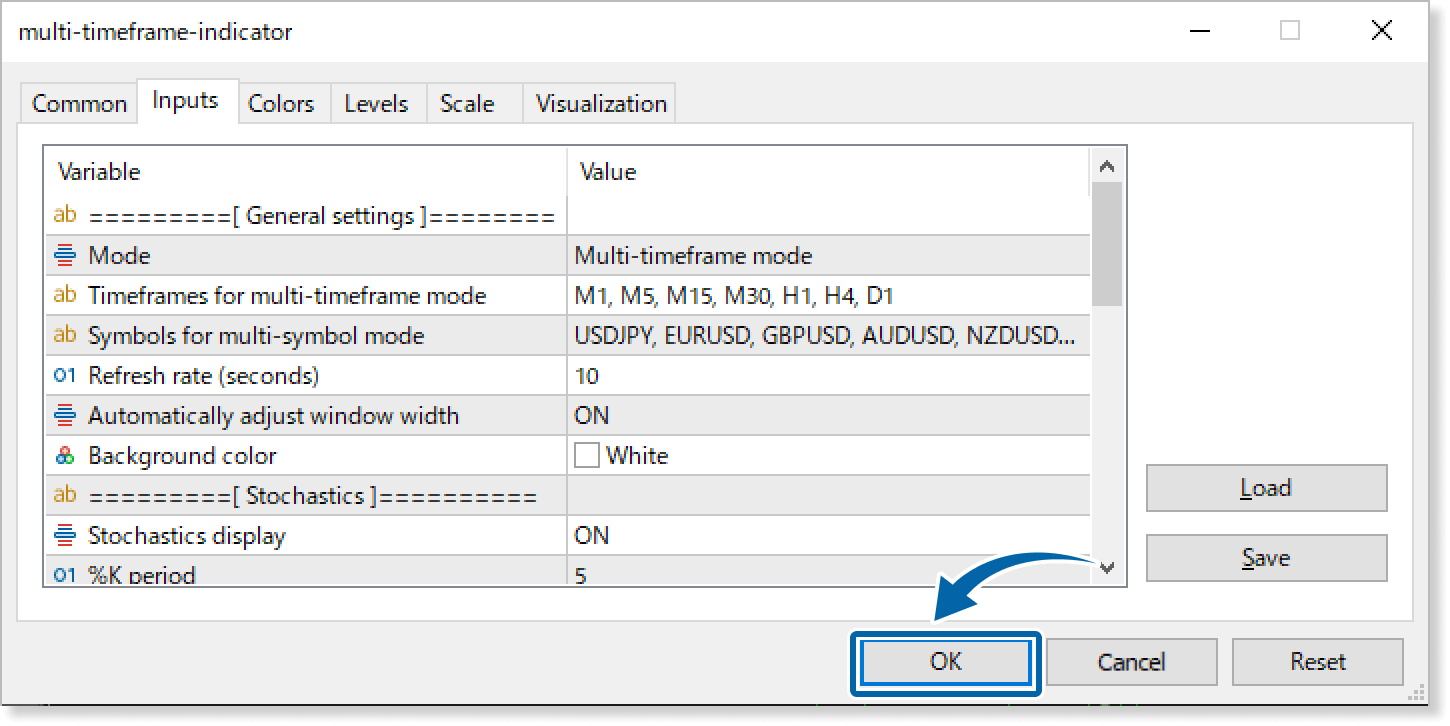
In the indicator settings window, customize the settings on the Inputs tab according to the How to set up page, then click OK.
Step 9
The Multi-Timeframe Trend Analysis Indicator is applied to the chart and the technical indicators for different timeframes and symbols will be displayed.
How to set up
After applying the indicator to the chart, set the parameters according to your style.
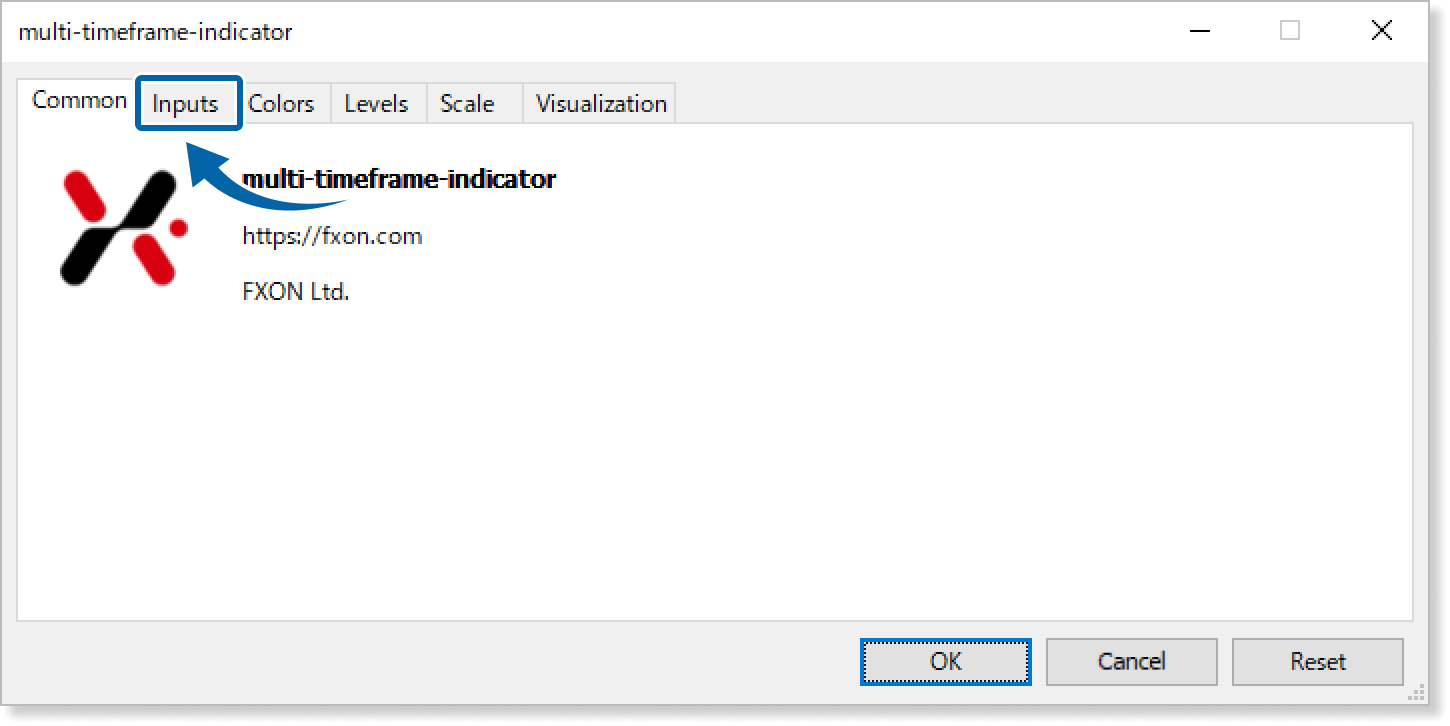
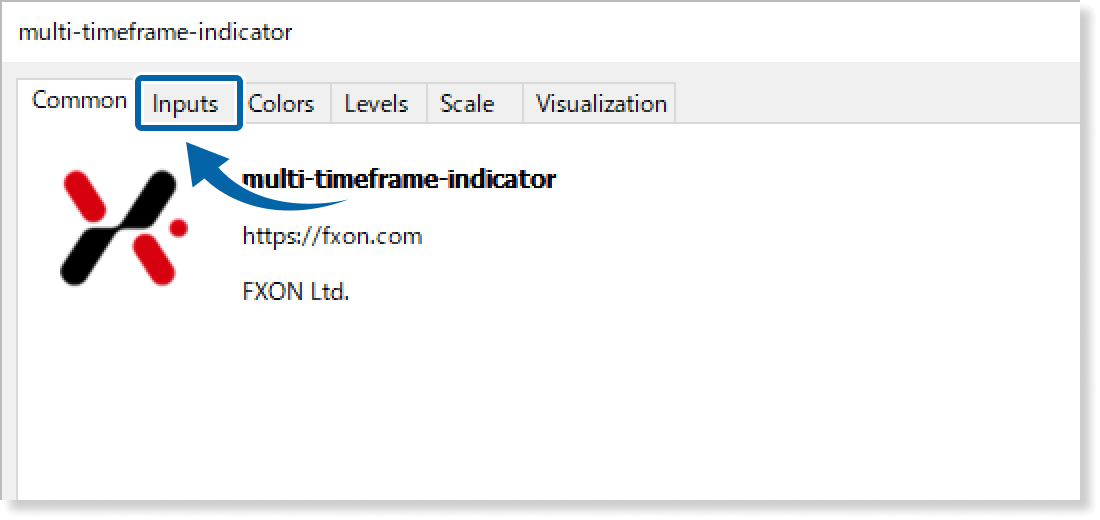
Step 1
First, open the Inputs tab.
Step 2
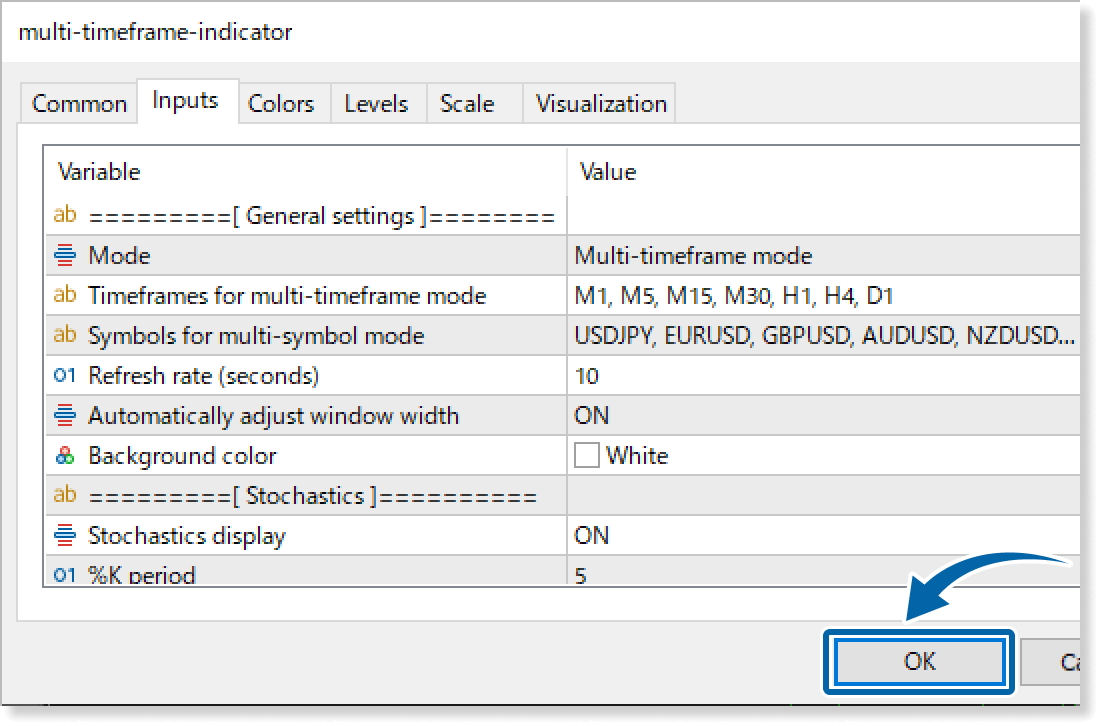
Set the parameters as follows.
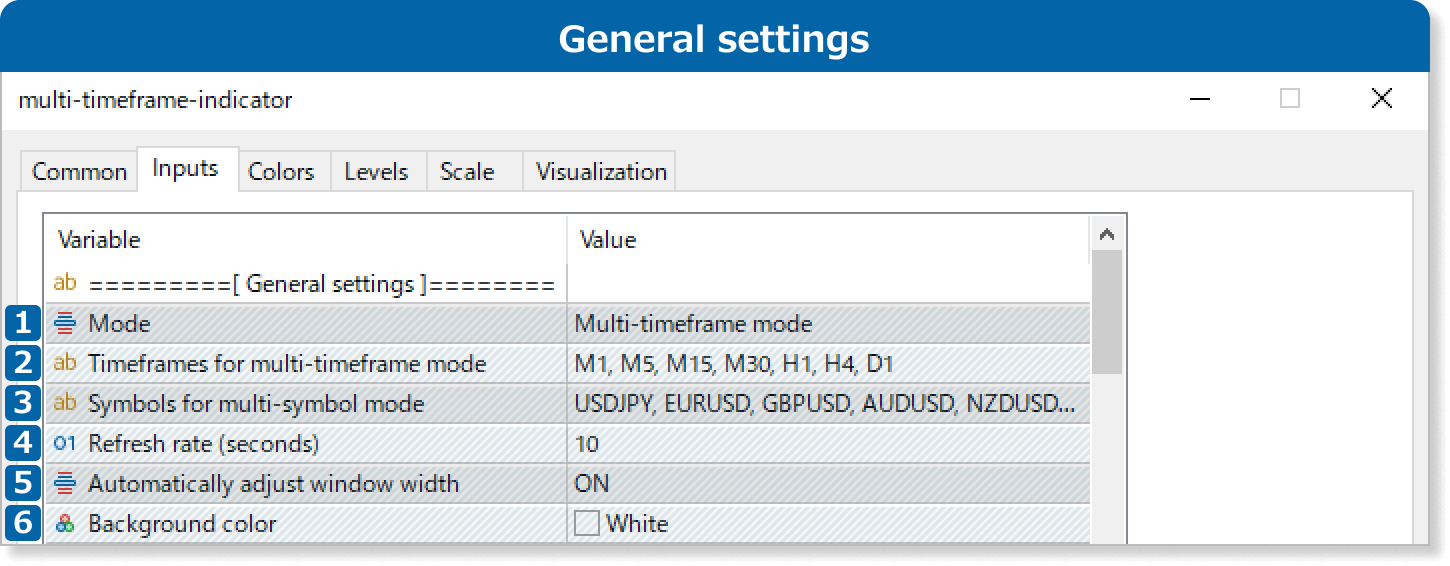
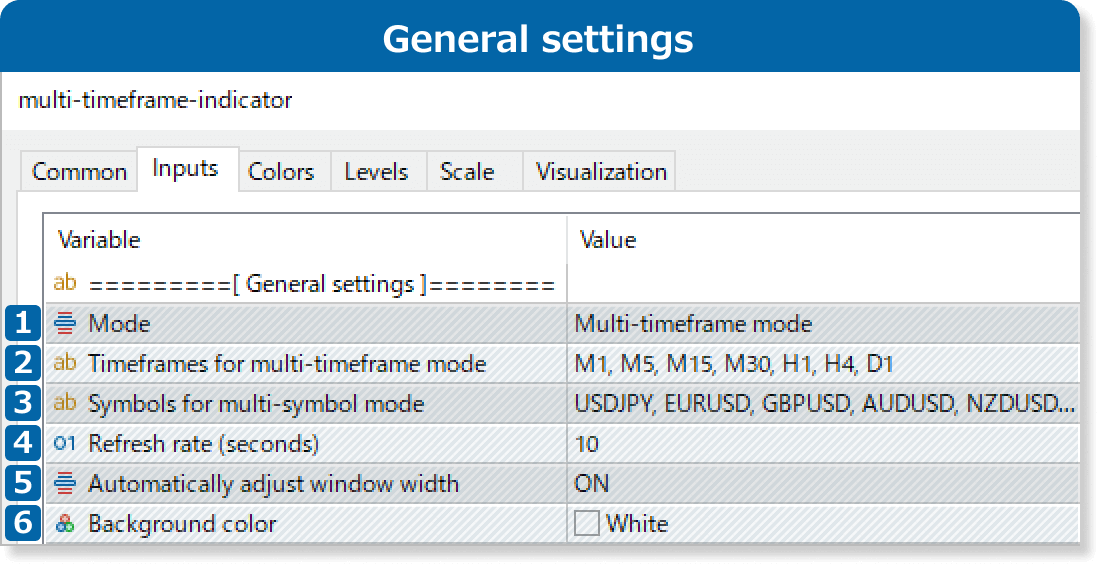
①Mode
Select from "Multi-timeframe mode" or "Multi-symbol mode".
②Timeframes for multi-timeframe mode
Enter up to 7 different timeframes to be displayed during the multi-timeframe mode. Separate the desired timeframe by a comma.
Example: M1, M5, M15, M30, H1, H4, D1
③Symbols for multi-symbol mode
Enter up to 7 different symbols to be displayed during the multi-symbol mode. Separate the desired symbol by a comma.
Example: USDJPY, EURUSD, GBPUSD, AUDUSD, NZDUSD, EURJPY, GBPJPY
④Refresh rate (seconds)
Set the refresh rate of the indicators by seconds.
⑤Automatically adjust window width
Turn the feature to automatically adjust the length of the sub-window "ON" or "OFF". If you choose "ON", you won't be able to adjust it manually.
⑥Background color
Set the background color for the panel.
In the Multi-Timeframe Trend Analysis Indicator, you can adjust the subwindow size by disabling the "Automatically adjust window width" parameter. However, in MT5, if the indicator is applied with this parameter enabled, the subwindow size will remain fixed, even if you later turn the parameter off.
To switch the "Automatically adjust window width" parameter from on to off, reapply the indicator.
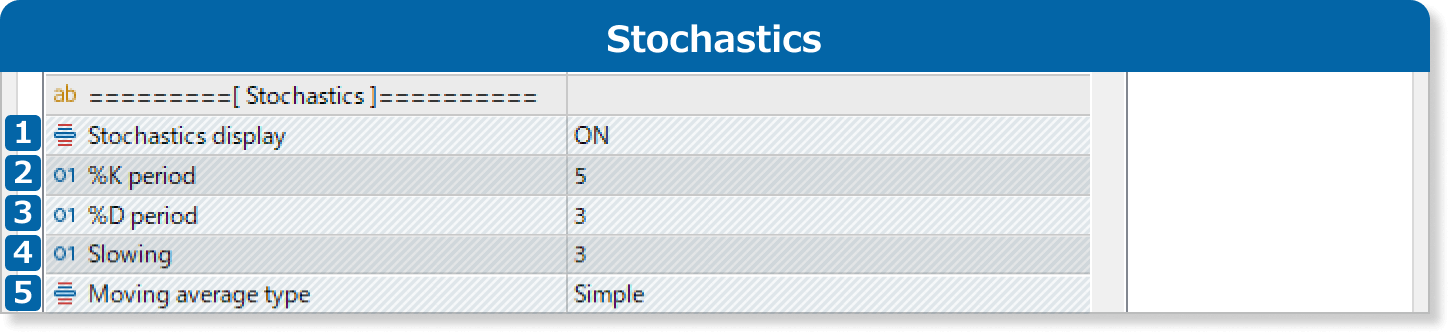
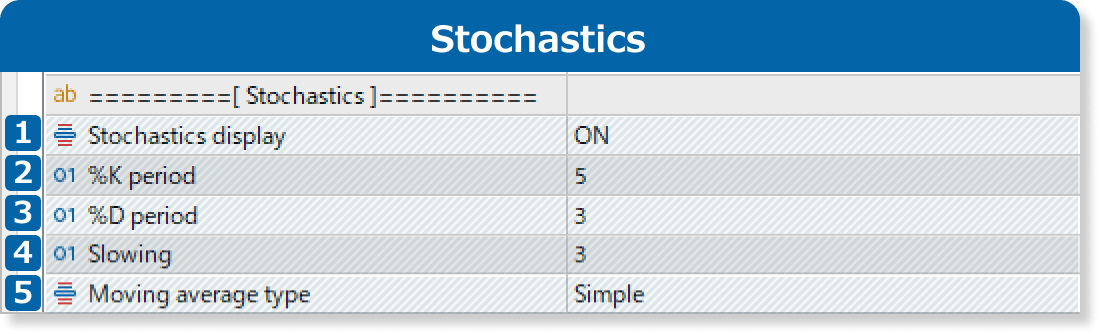
①Stochastics display
Select ON to display the stochastics, or OFF to hide it. "Low/High" is used for "Applied price field".
②%K period
Set the calculation period for %K.
③%D period
Set the calculation period for %D.
④Slowing
Set the calculation period for slow %D.
⑤Moving average type
Select the smoothing method to calculate %D.
Simple: simple moving average
Exponential: exponential moving average
Smoothed: smoothed moving average
Linear Weighted: linear weighted moving average
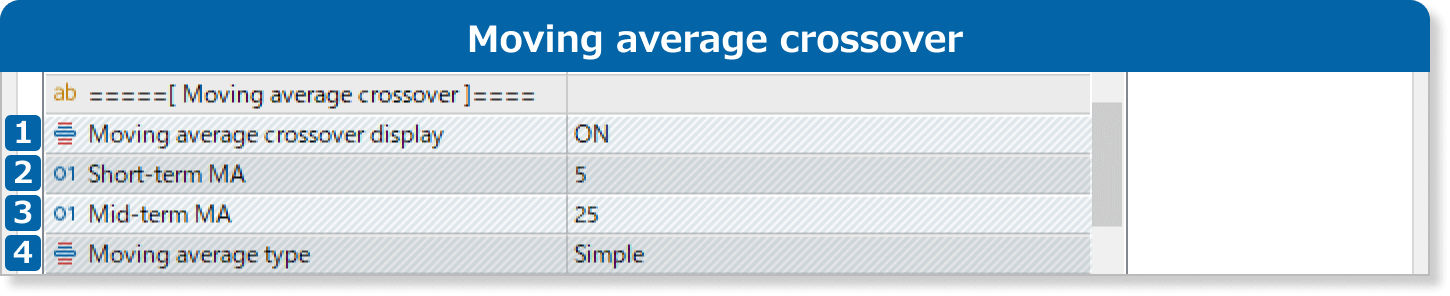
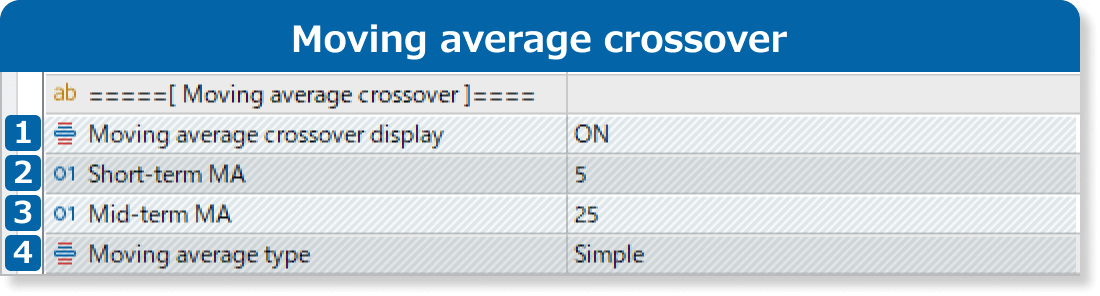
①Moving average crossover display
Select ON to display the moving average crossover, or OFF to hide it. "Close" is used for "Applied price field".
②Short-term MA
Set the calculation period for short-term MA.
③Mid-term MA
Set the calculation period for mid-term MA.
④Moving average type
Select the MA type.
Simple: simple moving average
Exponential: exponential moving average
Smoothed: smoothed moving average
Linear Weighted: linear weighted moving average
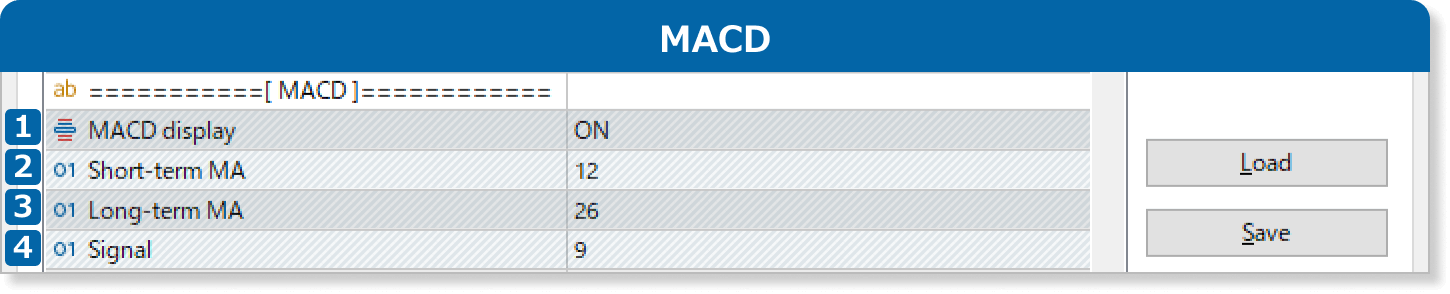
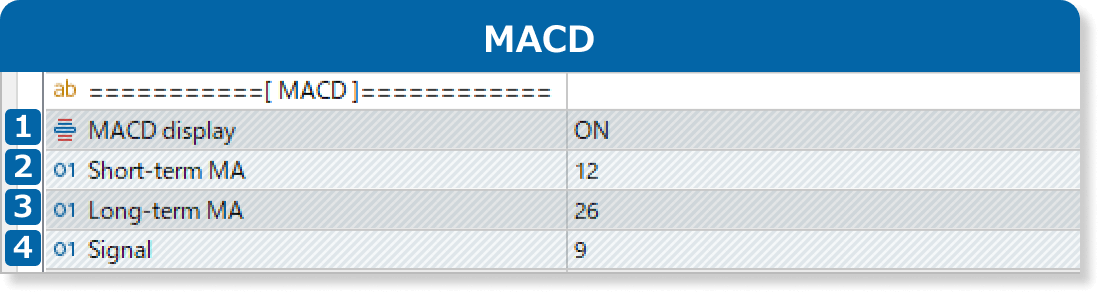
①MACD display
Select ON to display MACD, or OFF to hide it. "Close" is used for "Applied price field".
②Short-term MA
Set the calculation period for short-term MA.
③Long-term MA
Set the calculation period for long-term MA.
④Signal
Set the calculation period for MACD signal.
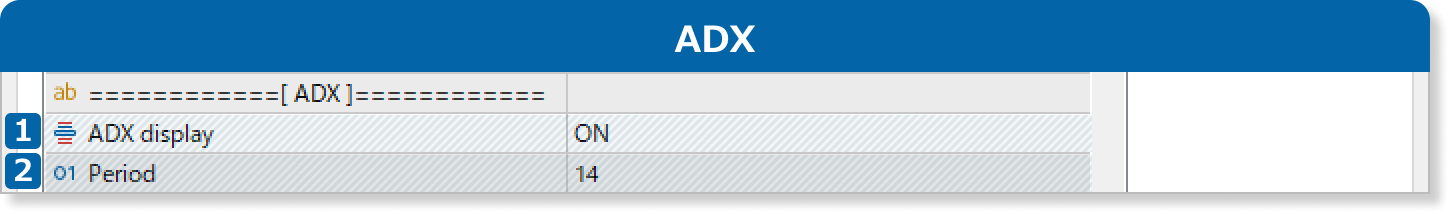
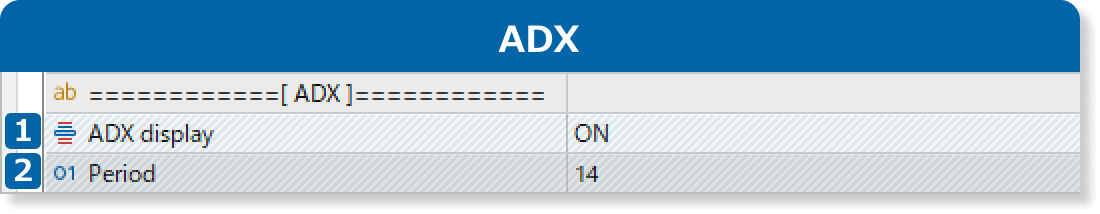
①ADX display
Select ON to display ADX, or OFF to hide it.
②Period
Set the calculation period for ADX.
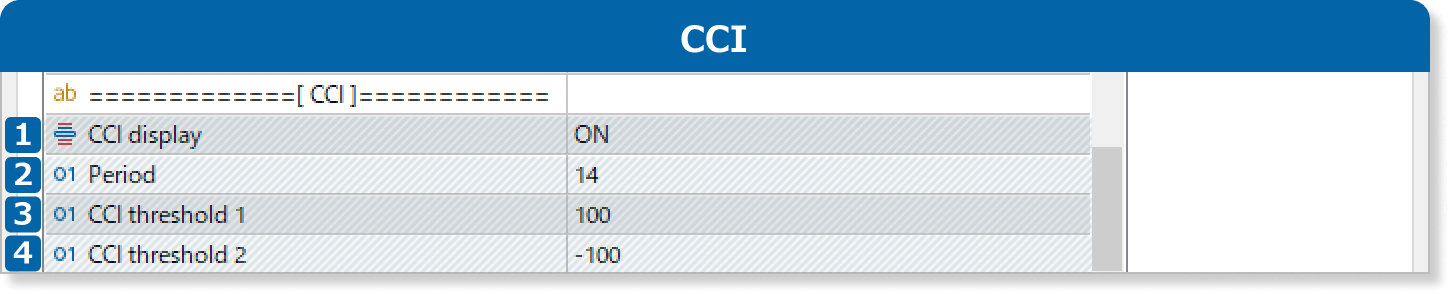
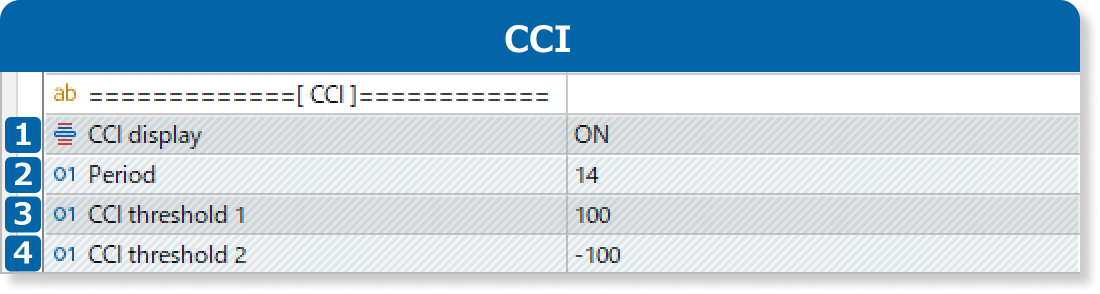
①CCI display
Select ON to display CCI, or OFF to hide it. "Typical Price (HLC/3)" is used for "Applied price field".
②Period
Set the calculation period for CCI.
③CCI threshold 1
When the CCI value reaches or exceeds the threshold 1, the value will be displayed in red as a high price level.
④CCI threshold 2
When the CCI value reaches or falls below the threshold 2, the value will be displayed in red as a low price level.
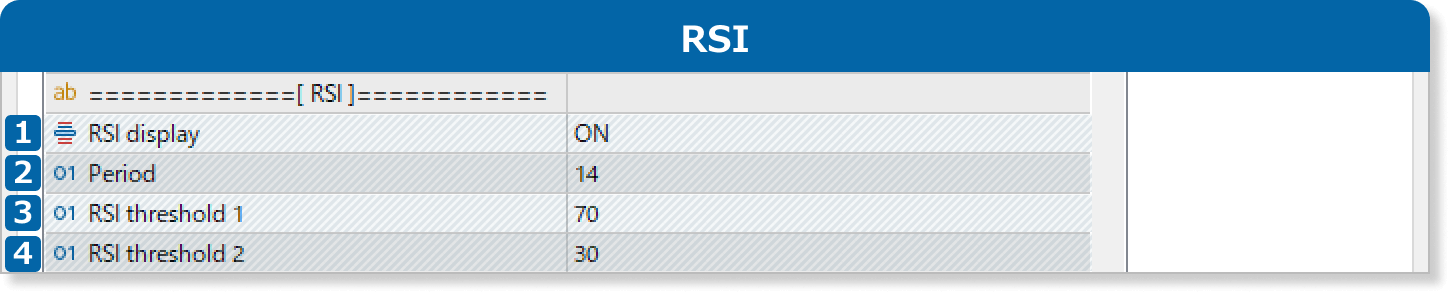
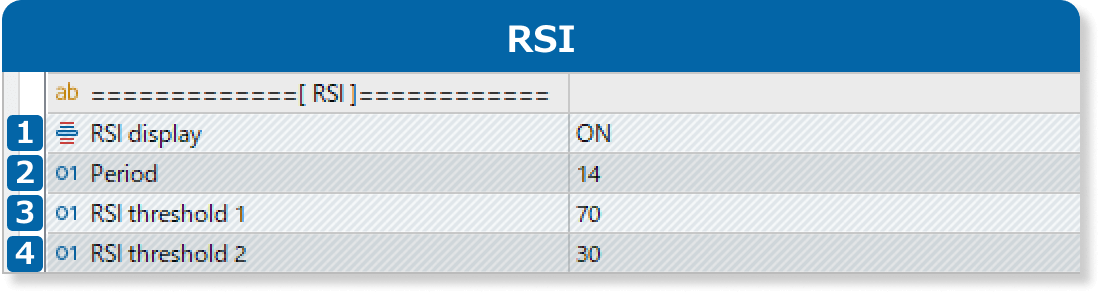
①RSI display
Select ON to display RSI, or OFF to hide it. "Close" is used for "Applied price field".
②Period
Set the calculation period for RSI.
③RSI threshold 1
When the RSI value reaches or exceeds the threshold 1, the value will be displayed in red as a high price level.
④RSI threshold 2
When the RSI value reaches or falls below the threshold 2, the value will be displayed in red as a low price level.
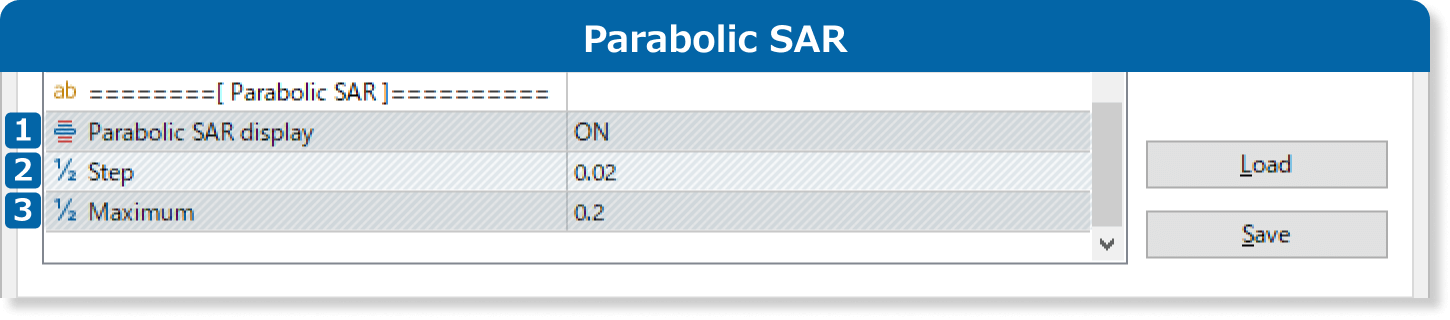
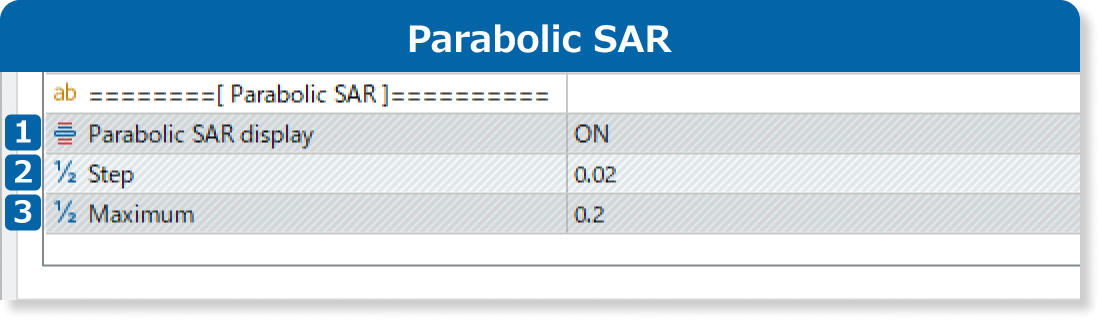
①Parabolic SAR display
Select ON to display parabolic SAR, or OFF to hide it. "Low/High" is used for "Applied price field".
②Step
Set the size of the acceleration factor for the parabolic SAR.
③Maximum
Set the maximum acceleration factor for the parabolic SAR.
Updates