


2026.03.09
This article was :
published
updated
Weekly FX Market Review and Key Points for the Week Ahead
In the foreign exchange market for the week that ended on March 8th, the U.S.-Israel military operation against Iran caused traders to lean toward a risk-off stance. While the dollar was favored as a safe-haven currency, traders also bought yen. Thus, the market grew volatile.
The USDJPY rose from the upper 155 yen range to the 158 yen range. The EURUSD fell from the 1.18 range to the lower 1.15 range. Meanwhile, the GBPUSD lost direction after falling to the 1.33 range.
March 2 (Mon)
Amid heightened tensions in the Middle East, the financial market started the week's trading session in a risk-off atmosphere, leading the dollar to strengthen against other major currencies.
The USDJPY surged from the 155.8 yen range to the 157.7 yen range. Conversely, the EURUSD fell from the 1.18 range to the 1.167 range. After falling to the 1.331 range, meanwhile, the GBPUSD rebounded to the 1.343 range.
March 3 (Tue)
While lingering geopolitical risks prompted traders to buy the dollar, fears of possible market intervention also arose. As a result, the USDJPY's uptick stalled at around 157.97 yen.
On the other hand, Iran's intention to close the Strait of Hormuz sparked a surge in crude oil futures. Consequently, the EURUSD plummeted to the 1.153 range and the GBPUSD dropped to the 1.325 range intraday.
March 4 (Wed)
The Iranian intelligence agency reportedly proposed conditions for negotiations to the U.S. toward the end of the war. This news spurred a sell-off of the dollar. Additionally, traders sold the dollar to adjust their positions. As a result, the USDJPY fell to 156.85 yen. However, after Iran denied the report, many market participants expected continued nervousness.
Meanwhile, the EURUSD downtrend halted, and the pair steadily moved back to the 1.14 range. The GBPUSD also rebounded to the 1.34 range.
March 5 (Thu)
As market hypervigilance waned, the USDJPY dropped to 156.45 yen. However, news reports later in the day evoked fears of prolonged warfare in the Middle East. Subsequently, the dollar strengthened against the yen, lifting the pair back to the 157.8 yen range.
The EURUSD pair sagged to the 1.155 range, while the GBPUSD pair hovered in the 1.33 range.
March 6 (Fri)
In addition to the ongoing volatility in the Middle East, comments from Japanese Financial Minister Satsuki Katayama suggesting that the Japanese economy might return to deflation contributed to the yen sell-off. The USDJPY temporarily broke above the 158 yen level. However, weaker-than-expected U.S. economic figures capped the uptick.
Meanwhile, after falling to the 1.154 range, the EURUSD rebounded to the 1.16 range. The GBPUSD temporarily recovered to the 1.34 range to conclude the weekly trading session.
Economic Indicators and Statements to Watch this Week
(All times are in GMT)
March 9 (Mon)
- 23:50 Japan: October-December Quarterly Gross Domestic Product (revised GDP)
March 11 (Wed)
- 12:30 U.S.: February Consumer Price Index (CPI)
- 12:30 U.S.: February Consumer Price Index (CPI Core Index)
March 13 (Fri)
- 07:00 U.K.: January Monthly Gross Domestic Product (GDP)
- 12:30 U.S.: October-December Quarterly Gross Domestic Product (revised GDP)
- 12:30 U.S.: January personal consumption expenditures (PCE deflator)
- 12:30 U.S.: January personal consumption expenditures (PCE core deflator, excluding food and energy)
This Week's Forecast
The following currency pair charts are analyzed using an overlay of the ±1σ and ±2σ standard deviation Bollinger Bands, with a 20-period moving average.
USDJPY
The Middle East is increasingly chaotic as warfare expands to surrounding countries. The dollar is under increasing upward pressure since inflationary pressures driven by high oil prices and traders' preference for a risk-off stance are leading to dollar buying. However, the pair is approaching the 159 yen range, where a "rate check" was previously performed. Therefore, mounting caution regarding the rate check may curb the pair's uptrend.
Next is an analysis of the USDJPY daily chart.
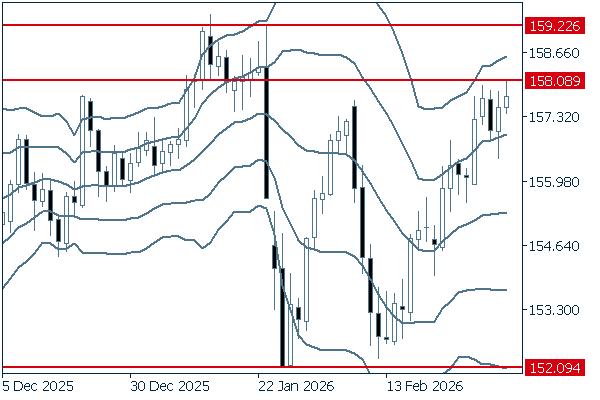
The pair has been overcoming small and significant declines to keep moving upward. For now, it is important to watch whether the pair can reach 158 yen again. If the pair breaks above 158.08 yen, it will set a new target in the 159 yen range.
We continue with an analysis of the USDJPY weekly chart.
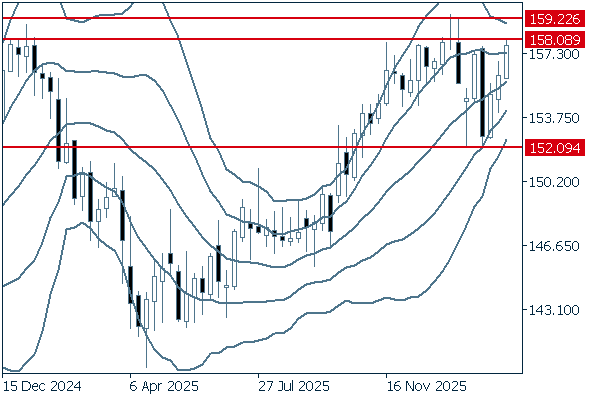
The pair rebounded at 152.09 yen and has since then rallied for three consecutive weeks, breaking above the pre-plummet level. If the pair surpasses 158.08 yen, it may extend its uptrend to 159.2 yen.
EURUSD
It is widely expected that the war between the U.S.-Israel alliance and Iran will be prolonged. The EURUSD is under downward pressure. There is little possibility that preference for the dollar as a safe-haven currency is waning. This week, the pair's downtrend will likely continue.
Next is an analysis of the EURUSD daily chart.
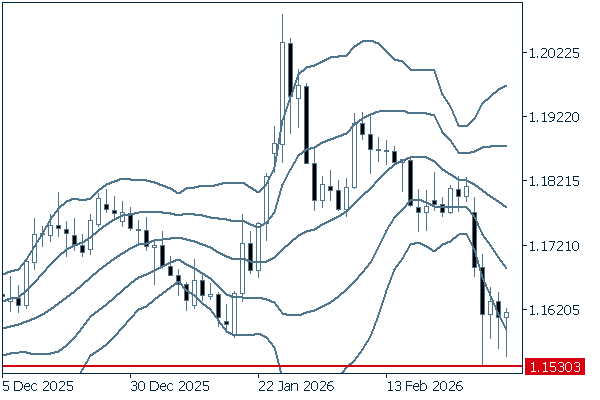
Last week, the pair fell below -2σ. Although increasing buying pressures are attempting to push the pair back into the band, the pair has been forming a series of lower highs. It is currently important to watch whether the pair crosses below the 1.1530 level and continues to fall. In short, it is safe to say that the downtrend will likely continue.
We continue with an analysis of the EURUSD weekly chart.
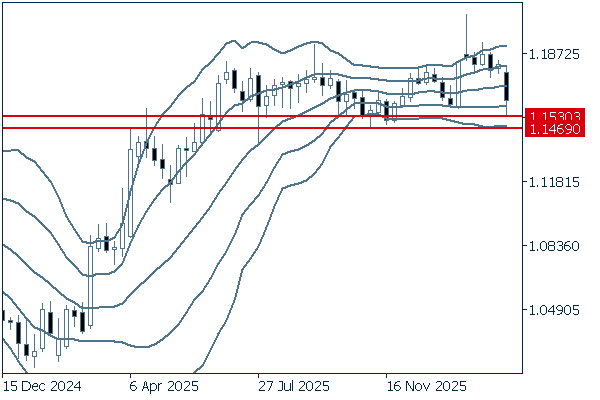
On the weekly chart, the pair is approaching the bottom of its fixed range. It is important to watch whether the pair rebounds or falls below the boundary. The current support line seems to lie around the 1.1530 level, while the bottom of the range appears to be around 1.14690. If the pair falls below the latter, it could be a sign that a downtrend has just started.
GBPUSD
Traders may prefer to sell the pound because of the fragile U.S.-U.K. ties amid the confusion in the Middle East. The waning clout of the ruling parties is also causing concern for the pound. This week, the pound will face downward pressure.
Next is an analysis of the GBPUSD daily chart.
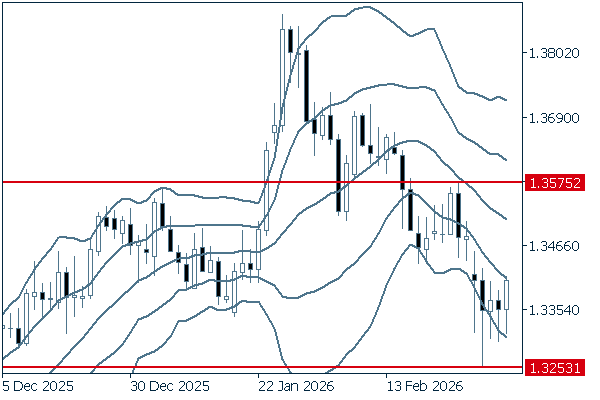
The daily chart shows that buying pressure is increasing after the pair fell below the 1.33 level. However, the pair cannot renew the recent high. For the pair to return to an uptrend, it must break above the 1.3575 level. Otherwise, it is safe to say that the downtrend will likely continue.
We continue with an analysis of the GBPUSD weekly chart.
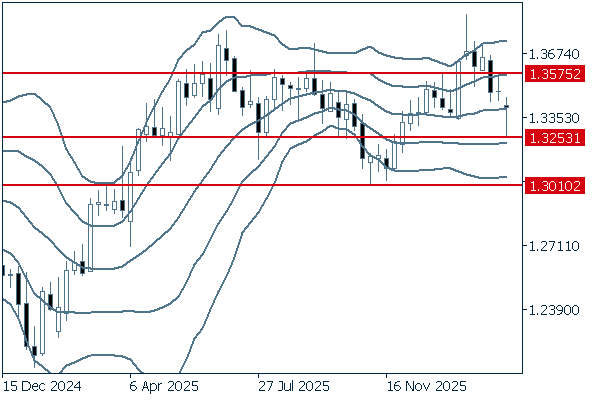
On the weekly chart, the pair appears to be moving within the fixed band. However, a long lower wick on the recent negative candlestick indicates that the pair rebounded just above the -1σ. If the rally continues, it could be a sign that the uptrend will continue. Conversely, if the pair crosses below the 1.3253 level, the current downtrend will likely continue towards 1.30.
Don't miss trade opportunities with a 99.9% execution rate.
Was this article helpful?
0 out of 0 people found this article helpful.
Thank you for your feedback.
Send