2026.03.16 NEW
This article was :
published
updated
Weekly FX Market Review and Key Points for the Week Ahead
The foreign exchange market for the week that ended on March 15th was quite sensitive to the crude oil market, which was significantly swung by the volatile situation in the Middle East. The USDJPY fell to the lower 157 yen range but later rebounded to the upper 159 yen range. The EURUSD fell to the 1.142 range, and the GBPUSD dropped to the 1.321 range on Friday.
March 9 (Mon)
As Iran named Mojtaba Hosseini Khamenei as their new supreme leader, the market grew concerned that the Middle East conflict would be prolonged. Accordingly, the USDJPY initially rose to 158.90 yen.
However, when the G7 nations reportedly started discussing the possibility of tapping the strategic oil reserve, the crude oil price plummeted in the New York market. It led to a sell-off of the dollar.
Later, as President Donald Trump said that war in Iran was "almost completely over", the pair fell to 157.61 yen. Conversely, the EURUSD rose to the 1.163 range and the GBPUSD climbed to the 1.344 range.
March 10 (Tue)
The market was sensitive to inconsistent news about the Strait of Hormuz. A social media post stating that the U.S. Navy would begin to convoy tankers pushed the crude oil price down. Consequently, the USDJPY fell to 157.40 yen. However, after the post was deleted a few minutes later, the dollar was bought back, lifting the pair back to 158.13 yen.
Meanwhile, the EURUSD initially rose to the 1.166 range but was later pushed down. The GBPUSD uptick paused at the 1.348 range and then declined to the 1.341 range.
March 11 (Wed)
During London trading hours, a European Central Bank (ECB) official mentioned the risk of inflation and a potential interest rate increase. In response, traders took a risk-off stance.
As a result, the USDJPY extended its rally to 158.97 yen. Meanwhile, the EURUSD fell to the 1.156 range and the GBPUSD dropped below the 1.34 level.
March 12 (Thu)
Geopolitical risk heightened due to news that a cargo ship passing through the Strait of Hormuz was attacked and that Iran had placed naval mines at the Straits. Accordingly, the dollar strengthened against other major currencies.
The USDJPY surged to 159.43 yen, the EURUSD fell close to 1.150, and the GBPUSD dropped to the 1.333 range.
March 13 (Fri)
With both President Trump and Leader Mojtaba Khamenei maintaining hard-line attitudes, traders preferred the dollar as a safe-haven currency.
The USDJPY renewed its annual high and reached 159.74 yen. Meanwhile, the EURUSD fell to the 1.141 range and the GBPUSD continued its downtrend to 1.322.
Economic Indicators and Statements to Watch this Week
(All times are in GMT)
March 18 (Wed)
- 10:00 Europe: February Harmonised Index of Consumer Prices (revised HICP)
- 10:00 Europe: February Harmonised Index of Consumer Prices (revised HICP Core Index)
- 18:00 U.S.: Federal Reserve Open Market Committee (FOMC) meeting, post-meeting policy rate announcement
- 18:30 U.S.: Regular press conference by Federal Reserve Chairman Jerome Powell
March 19 (Thu)
- TBA Japan: Bank of Japan (BOJ) Monetary Policy Meeting, post-meeting policy rate announcement
- 06:30 Japan: Regular press conference by BOJ Governor Kazuo Ueda
- Noon U.K.: Bank of England (BOE) policy interest rate announcement
- Noon U.K.: Minutes of Bank of England Monetary Policy Committee (MPC) meeting
- 13:15 Europe: European Central Bank (ECB) Governing Council policy interest rate announcement
- 13:45 Europe: Regular press conference by ECB President Christine Lagarde
- 14:00 U.S.: January new home sales
This Week's Forecast
The following currency pair charts are analyzed using an overlay of the ±1σ and ±2σ standard deviation Bollinger Bands, with a 20-period moving average.
USDJPY
Uncertainty in the Middle East is leading to a spike in crude oil prices and dollar buying. While the USDJPY is approaching its crucial milestone of 160 yen, the uptick may pause due to caution over market intervention. On the other hand, the FRB is expected to maintain its policy rate at its FOMC meeting on March 17th and 18th.
Next is an analysis of the USDJPY daily chart.

Last week, the pair rose for four consecutive days. Additionally, long lower wicks indicate that strong buying pressure is supporting the pair's uptick. Although it is safe to say that the uptrend will likely continue, it should be noted that the pair may experience a significant decline once it reaches the current target of 160 yen.
We continue with an analysis of the USDJPY weekly chart.

On the weekly chart, the pair rose for four consecutive weeks and concluded last week's trading session by breaking above +2σ. Although it may return within the band, it is important to see if the pair can break above 160 yen or if it will be pushed down after reaching that level.
EURUSD
As the U.S./Israel-Iran war is expected to drag on, the EURUSD is sensitive to crude oil prices, and the euro sell-off is accelerating. The ECB is expected to maintain its policy rate at its meeting on March 19th. In the long run, however, the central bank will be inclined to tighten its monetary policy as higher oil prices may induce inflation.
Next is an analysis of the EURUSD daily chart.
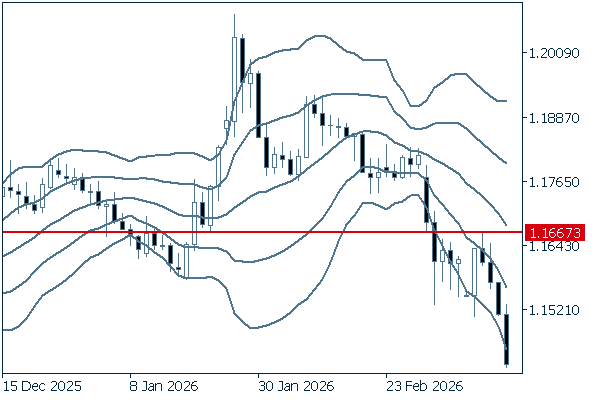
As indicated by a series of negative candlesticks, the pair fell for four consecutive days last week, accelerating the downtrend. Although the pair may rebound inside the band, it is safe to say that the downtrend will likely continue as long as the pair stays beneath 1.1667.
We continue with an analysis of the EURUSD weekly chart.
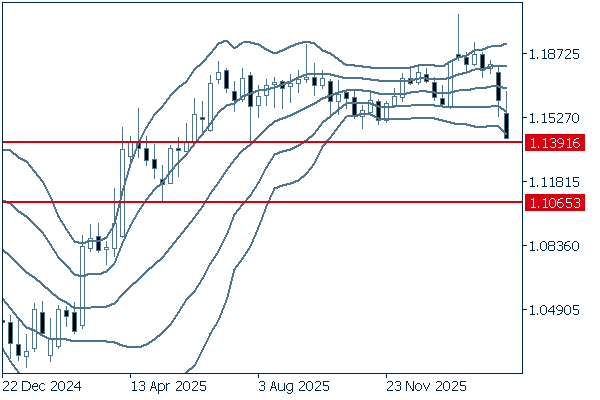
Last week, the pair fell below the 1.15 level. On the weekly chart, a new support line can be drawn at around the 1.1391 level, a monthly low in July 2025. If the pair falls below this line, it may head down to 1.10.
GBPUSD
The BOE is expected to keep its policy rate unchanged. Additionally, the market lowers the speculation that the central bank will raise the rate in the future, as a spike in oil prices may harm the U.K. economy. This week, the market will be dominated by traders' preference for the dollar as a safe-haven currency.
Next is an analysis of the GBPUSD daily chart.
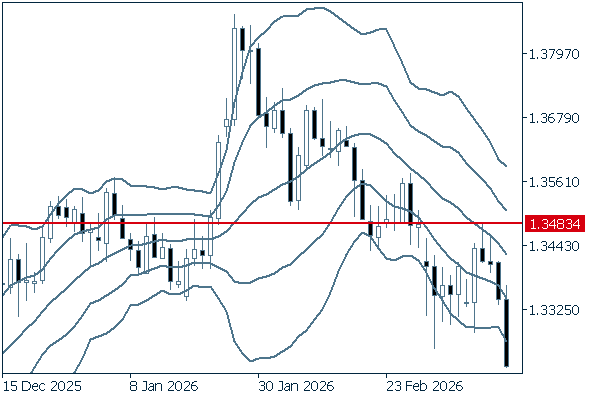
Along the downward bandwalk, the pair fell below -2σ last week. Meanwhile, the pair may attempt to return to the band in the short term. If so, it will be better to take advantage of the short-term rally to sell the pound.
We continue with an analysis of the GBPUSD weekly chart.
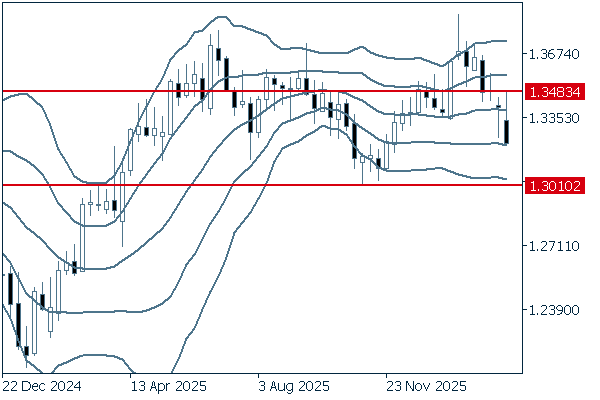
A long upper wick on the latest negative candlestick indicates an increase in selling pressure. A support line can be drawn at the 1.30 level, just below -2σ. The pair will likely continue to fall to this level.
[Important] Service Suspension & Migration Schedule
Was this article helpful?
0 out of 0 people found this article helpful.
Thank you for your feedback.
Send