


2026.02.23
This article was :
published
updated
Weekly FX Market Review and Key Points for the Week Ahead
In the foreign exchange market for the week that ended on February 22nd, the dollar strengthened against the yen. Differences in the monetary policies between the U.S. and Japan, weaker-than-expected Japanese economic data, and the Bank of Japan's (BOJ) reluctance to raise rates following the release of the Consumer Price Index (CPI) triggered the sell-off of the yen. Hawkish comments made by some U.S. monetary officials, as well as solid economic data in the U.S., also boosted the dollar.
In the meantime, the pound plunged after some data showed the sluggishness of the U.K. economy. However, its impact on the market was limited. The EURUSD and GBPUSD moved weakly throughout the week.
February 16 (Mon)
After Japanese quarterly GDP figures missed expectations, traders grew doubtful that the BOJ would raise rates anytime soon and thus sold the yen. The USDJPY moved steadily, reaching a daily high of 153.63 yen.
Meanwhile, the EURUSD sagged to the 1.184 range. The GBPUSD hovered in the 1.36 range.
February 17 (Tue)
In a reversal of the previous day's trend, the yen strengthened against the dollar during Tokyo trading hours, pushing the USDJPY down to the 152.7 yen range. Later, escalating tensions in the Middle East spurred buying of the dollar, lifting the pair back to the 153.9 yen range during New York hours.
Meanwhile, the EURUSD halted its downtrend just above the 1.18 level and fully recovered from the earlier decline to reach 1.185. The GBPUSD fell to 1.349 before rebounding to around 1.355.
February 18 (Wed)
Initially, the USDJPY moved relatively steadily in spite of the mixed trades. Later, the Federal Reserve Bank of New York admitted that it had conducted rate checks in January. Additionally, the Federal Open Market Committee (FOMC) minutes revealed that some officials supported a rate hike. As a result, the USDJPY rose to the 154.8 yen range.
Conversely, the EURUSD was pushed down to the 1.178 range, and the GBPUSD dropped below the 1.35 level.
February 19 (Thu)
The USDJPY uptick paused at the 155.3 yen range. After that, the pair fell back to the 154.5 yen range. However, it turned out that the pair straddled the 155 yen level throughout the day.
As figures showed the steadiness of the U.S. economy, the dollar strengthened against the euro and the pound. The EURUSD fell to the 1.174 range, and the GBPUSD declined to the lower 1.34 range.
February 20 (Fri)
After fluctuating nervously early in the day, the USDJPY reached a daily high of 155.64 yen. However, the Supreme Court's ruling to strike down the Trump tariffs sparked a sell-off of the dollar. Nevertheless, the pair's downtrend halted at the 154.7 yen range.
The EURUSD rebounded from the 1.174 range to 1.18 intraday. The GBPUSD almost erased the previous day's decline by rebounding to the 1.351 range to conclude the weekly trading session.
Economic Indicators and Statements to Watch this Week
(All times are in GMT)
February 25 (Wed)
- 10:00 Europe: January Harmonised Index of Consumer Prices (revised HICP)
- 10:00 Europe: January Harmonised Index of Consumer Prices (revised HICP Core Index)
This Week's Forecast
The following currency pair charts are analyzed using an overlay of the ±1σ and ±2σ standard deviation Bollinger Bands, with a 20-period moving average.
USDJPY
It was revealed that some U.S. monetary officials insisted on the possibility of a rate hike at the FOMC meeting. However, if the Conference Board Consumer Confidence Index for February, to be released on February 24th, misses market expectations, speculation about a rate cut by the end of 2026 may increase. Additionally, the uptick of USDJPY may be capped by the Japanese government's caution against a weak yen.
Next is an analysis of the USDJPY daily chart.
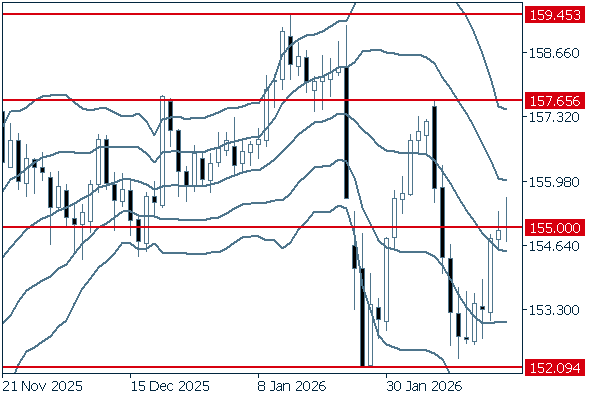
The pair is struggling to extend its rally above the 155 yen level due to an increase in selling pressure. If the pair falls clearly below the middle line and declines further, it could be an indication that the pair has entered a downtrend.
We continue with an analysis of the USDJPY weekly chart.
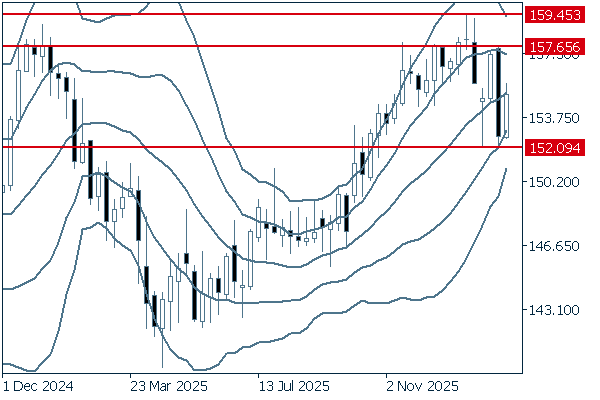
On the weekly chart, the pair rebounded at 152.09 yen and partially erased the plummet that occurred two weeks ago. If the pair crosses above the middle line to conclude the weekly trading session, it may head toward 157.65 yen again. However, based on past fluctuations, the pair has encountered resistance at this price level. Therefore, if the uptick halts there again, more traders would prefer to sell on the rally.
EURUSD
As the likelihood that the U.S. will attack Iran increases, the euro is weakening against the dollar. Germany will release its unemployment rate on February 27th. If it shows a deterioration of the German labor market, the sell-off of the euro will intensify. Therefore, the dollar will slightly strengthen against the euro throughout the week.
Next is an analysis of the EURUSD daily chart.
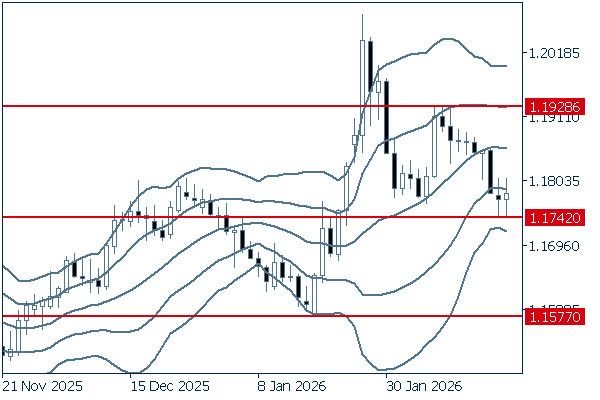
The pair is hovering around -1σ, indicating a dominance of selling pressure. If the pair rebounds from this level and breaks above the 1.1928 level, it would be safe to say that the uptrend has resumed. However, the downtrend is likely to continue for the time being as the pair targets 1.1577.
We continue with an analysis of the EURUSD weekly chart.
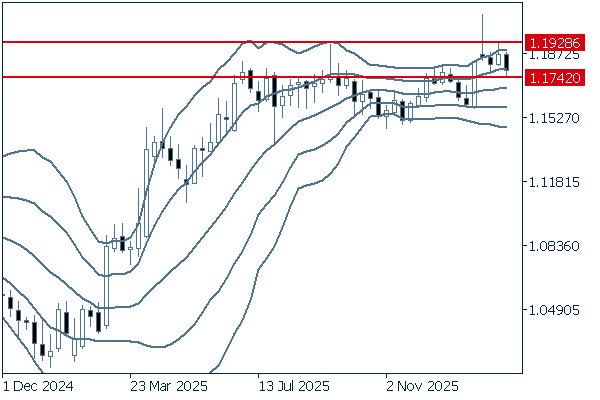
On the weekly chart, the pair is fluctuating within the fixed range between 1.1742 and 1.1928. Last week, the pair dipped from its high range, as the latest negative candlestick has a long lower wick. If the pair can break above 1.1928, it will likely extend its rally. However, if the pair falls below 1.1742, it will likely reach the middle line and may extend its downtrend to the 1.152 range.
GBPUSD
Amid rising tensions in the Middle East, the dollar will be favored. Conversely, the pound will face downward pressure. Additionally, some market participants predict that the Bank of England (BOE) will make an additional rate cut in March. This factor may also deter traders from buying the pound.
Next is an analysis of the GBPUSD daily chart.
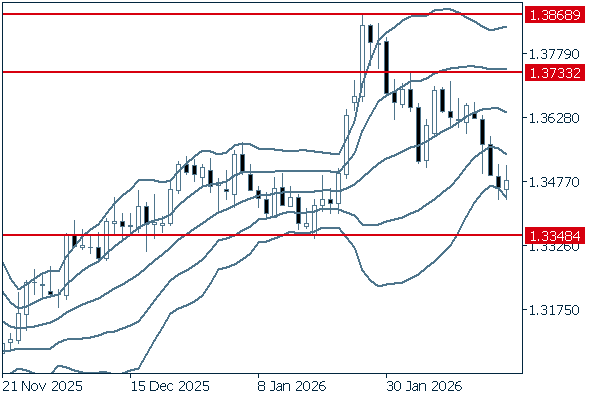
The pair has been declining since reaching 1.3868, currently the high for 2026. If the pair falls below 1.3348, the downtrend will likely intensify. On the other hand, if the pair rebounds to reach around 1.3733, it would again extend its rally.
We continue with an analysis of the GBPUSD weekly chart.
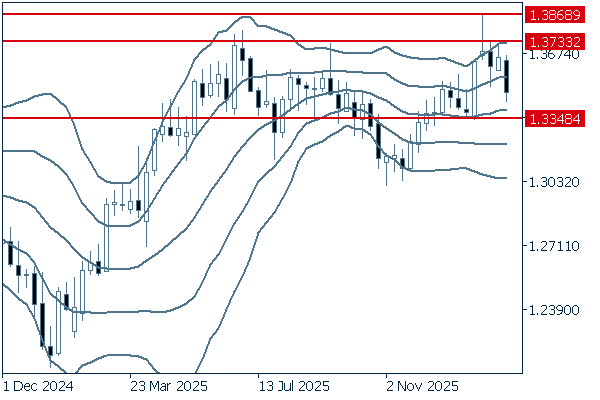
The weekly chart shows that the pair has no clear direction. It has been declining since reaching 1.3868 and is nearing the middle line. If the pair falls below the 1.3348 level, it may drop to around 1.30, which is the lower limit of the Bollinger Bands.
Don't miss trade opportunities with a 99.9% execution rate.
Was this article helpful?
0 out of 0 people found this article helpful.
Thank you for your feedback.
Send