


2026.02.09
This article was :
published
updated
Weekly FX Market Review and Key Points for the Week Ahead
In the foreign exchange market for the week that ended on February 8th, the ruling parties' lead ahead of Japan's Lower House election, as well as Prime Minister Sanae Takaichi's approval of a weak yen, spurred the sell-off of the yen. Consequently, the USDJPY rose to the 157 yen range. However, weaker-than-expected U.S. job openings in December and the postponement of U.S. employment figure releases capped the rally. The EURUSD was sensitive to speculation about rate cuts in Europe. The GBPUSD declined as political distrust mounted in the U.K.
February 2 (Mon)
Media reports at the end of the previous week revealed that the Liberal Democratic Party was leading in the Lower House election. It prompted a sell-off of the yen. Additionally, the nomination of Kevin Warsh as the next Federal Reserve Chair supported the dollar. These factors pushed the USDJPY up to the 155.7 yen range.
Conversely, the EURUSD fell to the 1.177 range and the GBPUSD declined to the 1.362 range.
February 3 (Tue)
During Tokyo trading hours, the dollar was sold as traders adjusted their positions. Later, in the London hours, the dollar was bought, lifting the USDJPY to the 155.9 yen range. However, the pair was pushed down to the 155.5 yen range due to fears over the Middle East situation.
The EURUSD straddled the 1.180 level. The GBPUSD remained flat in the upper 1.36 range.
February 4 (Wed)
Foreign traders accepted Prime Minister Takaichi's comments at the end of the previous week as her approval of a weak yen. As a result, the yen weakened against other currencies. The USDJPY jumped to the 156.9 yen range.
Meanwhile, the dollar strengthened slightly against the euro, pushing the EURUSD down beneath the 1.18 level. The GBPUSD climbed to the 1.373 range before dropping back down to the 1.364 range.
February 5 (Thu)
In spite of traders' sensitivities over possible market intervention, the USDJPY rose to the 157.3 yen range. However, a series of indices indicating a slowdown in the U.S. employment market pushed the pair down to the 156.5 yen range.
Meanwhile, political distrust mounted in the U.K., accelerating the sell-off of the pound. Consequently, the GBPUSD plummeted to the 1.351 range. The EURUSD pair hovered around the 1.180 level.
February 6 (Fri)
The partial government shutdown postponed the release of U.S. employment figures. Meanwhile, the market waited for the outcome of the Lower House election. As a result, the USDJPY experienced conflicting pressures from the ongoing yen sell-off and the cautious uptrend of the dollar. The pair concluded the weekly trading session at the daily high of 157.26 yen, as the market speculates that Takaichi will strengthen her leadership post-election and that it will lead to a weak yen.
Meanwhile, the EURUSD halted its downtrend at 1.1765 and rebounded to the 1.182 range. The GBPUSD stayed afloat above the 1.35 level and rebounded to the 1.36 range.
Economic Indicators and Statements to Watch this Week
(All times are in GMT)
February 10 (Tue)
- 13:30 U.S.: October-December Quarterly Employment Cost Index (ECI)
- 13:30 U.S.: December Retail Sales
- 13:30 U.S.: December Retail Sales (excluding automotives)
February 11 (Wed)
Closure: Japan (holiday)
- 13:30 U.S.: January change in nonfarm payrolls
- 13:30 U.S.: January unemployment rate
- 13:30 U.S.: January average hourly earnings
February 12 (Thu)
- 07:00 U.K.: December Monthly Gross Domestic Product (GDP)
- 07:00 U.K.: October-December Quarterly Gross Domestic Product (preliminary GDP)
February 13 (Fri)
- 10:00 Europe: October-December Quarterly Regional Gross Domestic Product (preliminary GDP)
- 13:30 U.S.: January Consumer Price Index (CPI)
- 13:30 U.S.: January Consumer Price Index (CPI Core Index)
This Week's Forecast
The following currency pair charts are analyzed using an overlay of the ±1σ and ±2σ standard deviation Bollinger Bands, with a 20-period moving average.
USDJPY
If the ruling parties make a landslide win in the Lower House election on February 8th, speculation about expansionist fiscal policies will increase, and it will prompt traders to take a risk-on stance and sell the yen. On the other hand, if the USDJPY continues to rise, traders will grow cautious over the possible market intervention. The bottom line is that the pair is less likely to rise sharply.
Next is an analysis of the USDJPY daily chart.
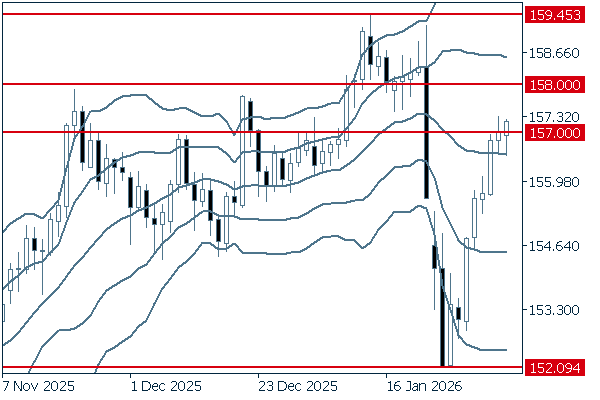
After falling to 152.09 yen in the previous week, the pair rallied for six consecutive days, as indicated by a series of positive candlesticks. Although the pair seems to remain flat after breaking above the 157 yen level, if it surpasses the 158 yen level, the rally will likely continue until it reaches 159.45 yen.
We continue with an analysis of the USDJPY weekly chart.
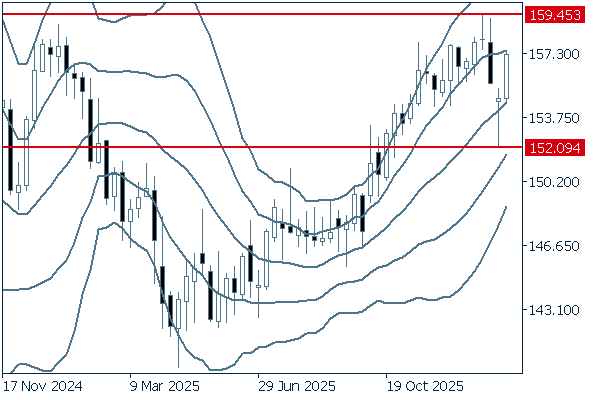
Although the pair temporarily fell below the middle line, it is now attempting to return to the uptrend. If the pair breaks above the recent high of 159.45 yen, it will attempt to reach 160 yen.
EURUSD
The European Central Bank (ECB) decided to keep its monetary policy unchanged at its Governing Council meeting. However, Council members also expressed concern about the recent strong euro. Therefore, a rally of EURUSD may be capped. The market is now focusing on U.S. employment figures. If they show improvement in the employment market, the dollar will be preferred.
Next is an analysis of the EURUSD daily chart.
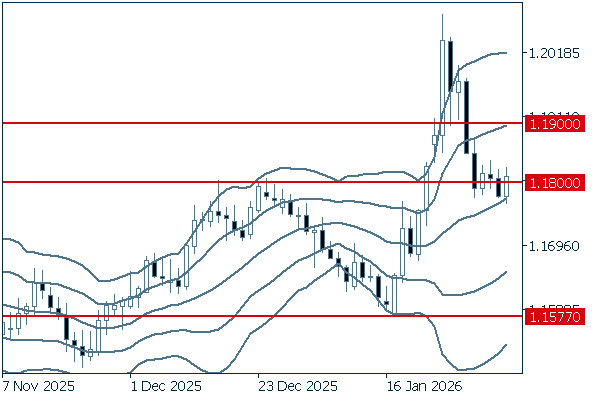
Last week, the pair straddled the 1.18 level, making it difficult to predict its future direction. If the pair rises above the 1.19 level again, the uptrend will likely continue. In contrast, if the pair falls below the middle line and continues to decline, it may be a sign of a trend reversal.
We continue with an analysis of the EURUSD weekly chart.
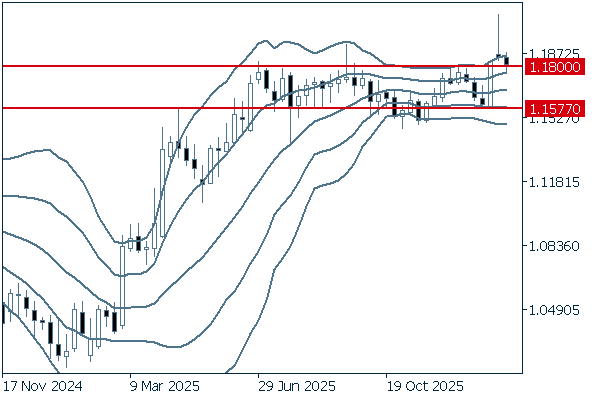
A negative candlestick appears on the weekly chart as the pair returned inside the band. However, as indicated by the long lower wick, the pair concluded last week's trading session above the 1.18 level. If the pair's rally continues, it will break above the fixed range and advance further.
GBPUSD
The Bank of England (BOE) decided to keep its policy interest rate unchanged on February 5th. Meanwhile, the market speculates that the central bank will decide to make a rate cut at its next Monetary Policy Committee meeting. If the October-December GDP, due out on February 12th, shows the sluggishness of the U.K. economy, the sell-off of the pound will accelerate.
Next is an analysis of the GBPUSD daily chart.
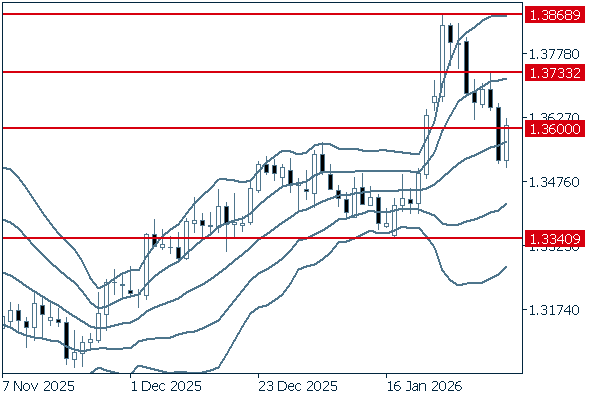
Last week, the pair rebounded after dropping below the middle line. However, it now seems difficult to determine whether the pair will continue to rally or it would be better to sell during this rally. Meanwhile, given the middle line's upward trend, it's reasonable to think that the pair's uptrend will likely continue only after breaking above the 1.3733 level.
We continue with an analysis of the GBPUSD weekly chart.
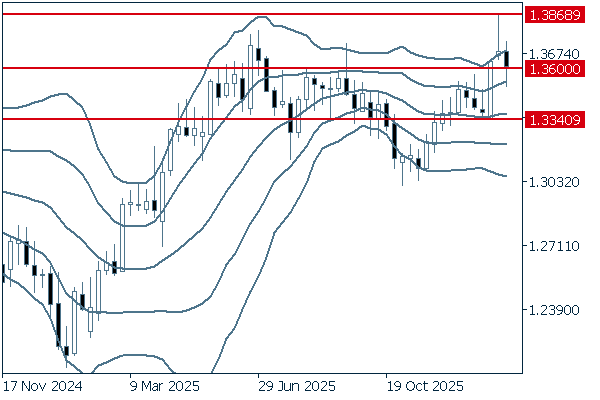
As indicated by the latest negative candlestick, the pair declined to conclude last week's trading session. Meanwhile, a long lower wick signals strong buying pressure. If the pair falls below the 1.334 level, it will reverse to a downtrend. However, it would be better to think that the pair will continue rising up to 1.3868.
Don't miss trade opportunities with a 99.9% execution rate.
Was this article helpful?
0 out of 0 people found this article helpful.
Thank you for your feedback.
Send