


2026.01.12
This article was :
published
updated
Weekly FX Market Review and Key Points for the Week Ahead
In the foreign exchange market for the week that ended January 11th, a wait-and-see attitude among traders prevailed ahead of the release of U.S. employment figures. Additionally, political developments in Japan led to the sell-off of the yen. As a result, the USDJPY temporarily broke above the 158 yen level. As the dollar strengthened, the EURUSD fell to the 1.161 range, and the GBPUSD temporarily dropped below the 1.34 level.
January 5 (Mon)
Concerns over the fiscal expansionism by Japan's Takaichi Cabinet triggered a sell-off of the yen. During Tokyo trading hours, the USDJPY reached 157.29 yen. Later, position adjustments by traders pushed the pair down to the 156.1 yen range.
Meanwhile, the EURUSD fell to the 1.165 range before rebounding to the 1.172 range. The GBPUSD surged to the 1.354 range.
January 6 (Tue)
The market lacked news, as a wait-and-see attitude among traders prevailed ahead of the release of U.S. employment figures on Friday. The USDJPY hovered around the mid-156 yen level.
On the other hand, the EURUSD extended its rally to the 1.174 range but then dropped below the 1.17 level. The GBPUSD also climbed to the 1.356 range. However, mounting pressure to buy the dollar pushed the pair down to around the 1.350 level to conclude the daily trading session.
January 7 (Wed)
The USDJPY remained stalled ahead of the release of U.S. economic figures over the weekend, fluctuating within the upper 156 yen range.
The EURUSD failed to rebound but instead continued to decline to the 1.167 range intraday. The pound also weakened against the dollar, pushing the GBPUSD down to the 1.345 range.
January 8 (Thu)
The U.S. trade deficit significantly decreased month-over-month in October 2025. The much lower than expected deficit moved backward the speculation of rate cuts by the Federal Reserve Board (FRB). Accordingly, the USDJPY temporarily exceeded the 157 yen level.
As the dollar strengthened, the EURUSD fell to just above 1.165, and the GBPUSD dropped to the lower 1.34 range.
January 9 (Fri)
After the U.S. employment figures for December were released, the market reaffirmed that the FRB would not decide to cut the interest rates at its Federal Open Market Committee (FOMC) meeting in January. Moreover, some media outlets reported that Japanese Prime Minister Sanae Takaichi is contemplating the dissolution of the Lower House. This news accelerated the sell-off of the yen, and the USDJPY jumped to temporarily enter the 158.1 yen range.
As the dollar strengthened, the EURUSD extended its decline to the 1.161 range during the trading hours. The GBPUSD hovered around the 1.34 level to conclude the weekly trading session.
Economic Indicators and Statements to Watch this Week
(All times are in GMT)
January 12 (Mon)
- Closure: Japan (Holiday)
January 13 (Tue)
- 13:30 U.S.: December Consumer Price Index (CPI)
- 13:30 U.S.: December Consumer Price Index (CPI Core Index)
- 15:00 U.S.: October new home sales
January 14 (Wed)
- 13:30 U.S.: November Retail Sales
- 13:30 U.S.: November Retail Sales (excluding automotives)
January 15 (Thu)
- 13:30 U.K.: November Monthly Gross Domestic Product (GDP)
This Week's Forecast
The following currency pair charts are analyzed using an overlay of the ±1σ and ±2σ standard deviation Bollinger Bands, with a 20-period moving average.
USDJPY
While the Japan-China relationship continues to deteriorate, lingering concerns about Japan's financial situation are prompting traders to sell yen. Last week, the USDJPY rose to as high as the 158 yen range. Although the market increasingly fears possible foreign exchange intervention by the Japanese government at this level, the pair is likely to remain stable.
Next is an analysis of the USDJPY daily chart.
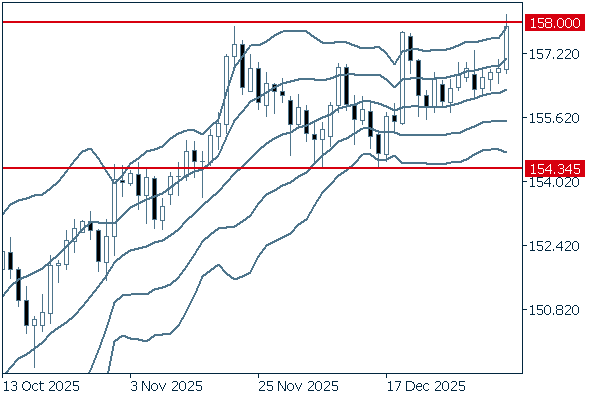
On the daily chart, four consecutive positive candlesticks appear above the middle line. Last week, the pair rose and temporarily broke above the 158 yen level. If the pair breaks above this level again, it will be safe to say that it has broken out of the deadlock and turned into an uptrend.
We continue with an analysis of the USDJPY weekly chart.
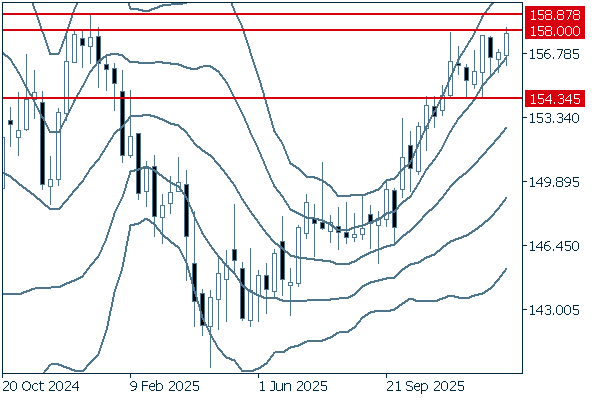
On the weekly chart, the pair has come to a temporary standstill beneath the 158 yen level for several weeks. However, it temporarily exceeded the line last week. It will next target 158.87 yen, the high set in January 2025. It should be noted, however, that caution about market intervention could halt the rally.
EURUSD
U.S. President Donald Trump continues to vow his intention to own Greenland, an autonomous territory of Denmark. It is deepening the conflict between the U.S. and Europe, leading to a sell-off of the euro in favor of the dollar due to risk aversion. However, if U.S. CPI figures miss market expectations, the downtrend of the euro may halt.
Next is an analysis of the EURUSD daily chart.
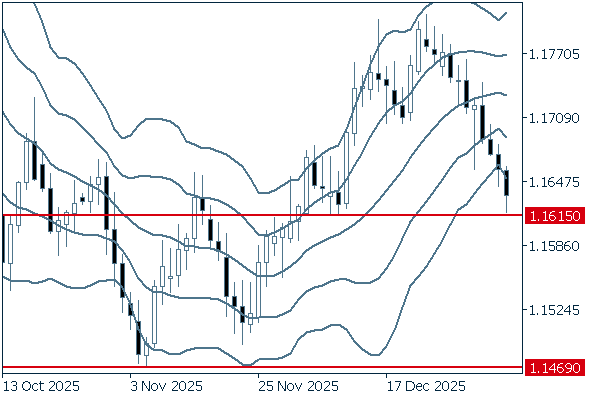
Since reaching +2σ, the pair has continued to drop. Last week, it finally fell below -2σ. Although the long lower wick can be seen as an indication of upward momentum back into the band, if the pair falls below the 1.1615 level, the current downtrend would accelerate.
We continue with an analysis of the EURUSD weekly chart.
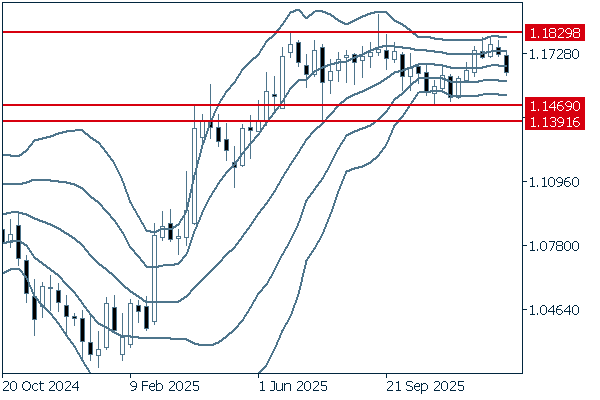
On the weekly chart, the pair rose to touch +2σ but was then pushed down. Overall, the pair has remained almost flat. Additionally, the most recent negative candlestick shows that the pair fell below the middle line to conclude last week's trading session. Therefore, it is safe to say that the downtrend will likely continue until the pair reaches -2σ.
GBPUSD
Following the release of U.S. employment figures, the market is strengthening speculation that the FRB will delay an interest rate cut. As a result, the dollar remains steady against the pound. If the U.S. CPI figures, to be released early this week, show signs of the U.S. economy's steadiness, the current downtrend may accelerate.
Next is an analysis of the GBPUSD daily chart.
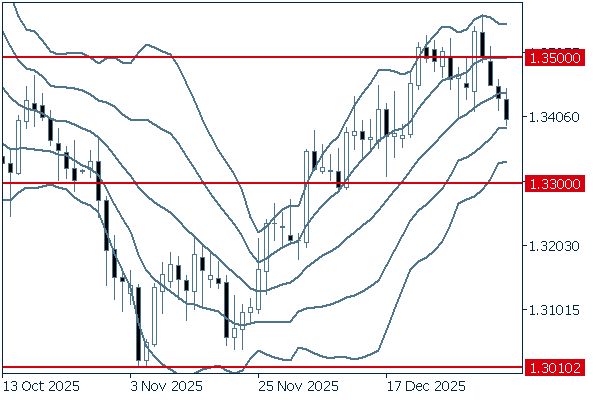
The pair had climbed along the upward middle line and remained above the line. However, the daily chart indicates that the long-term uptrend seems to have reversed. It is important to watch now whether the pair falls below the 1.33 level.
We continue with an analysis of the GBPUSD weekly chart.
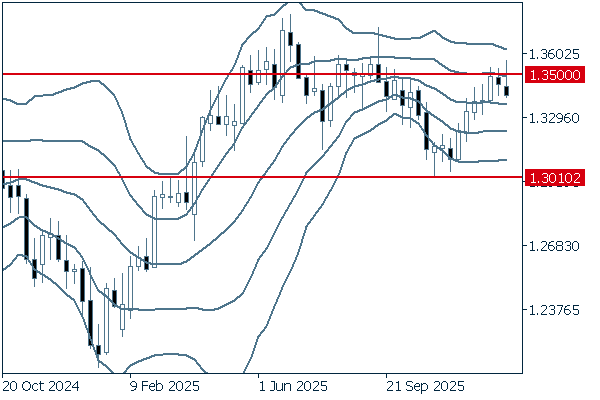
The pair has been under strong selling pressure since breaking above +1σ and has struggled to surpass the recent highs. As long as the pair stays beneath the 1.35 level, it is safe to say that the downtrend will likely continue.
Don't miss trade opportunities with a 99.9% execution rate.
Was this article helpful?
0 out of 0 people found this article helpful.
Thank you for your feedback.
Send