


2025.10.06
This article was :
published
updated
Weekly FX Market Review and Key Points for the Week Ahead
The foreign currency market for the week that ended on October 5th was sensitive to the risk arising from the U.S. federal government shutdown. The USDJPY fell by about three yen from the beginning of the week as the market focused on developments in the budget discussions in the U.S. Senate. Meanwhile, the EURUSD remained almost unchanged, and the GBPUSD saw solid movement.
September 29 (Mon)
The foreign exchange market became aware of the risks of a partial shutdown of the U.S. government. The accelerating sell-off of the dollar pushed the USDJPY down from the mid-149 yen range to the mid-148 yen range. In the meantime, Asahi Noguchi, a Policy Board member of the Bank of Japan (BOJ), insisted that the central bank would need to hike the interest rate in October. This remark also helped strengthen the yen.
As the dollar weakened, the EURUSD rose to the 1.175 range and the GBPUSD climbed to the 1.345 range.
September 30 (Tue)
As the market remained cautious about the partial U.S. government shutdown, investors sold the dollar. In contrast, investors preferred the yen as Japanese bond yields rose. Consequently, the USDJPY fell to the 147.6 yen range.
The German and French Harmonised Index of Consumer Prices (HICP) for September suggested that the European Central Bank (ECB) would likely keep the interest rate unchanged. The strong HICP and the weakening dollar lifted the EURUSD to the mid-1.17 range. Meanwhile, the GBPUSD hovered within the 1.34 range.
October 1 (Wed)
The partial shutdown of the U.S. government started. Traders took a risk-off stance and bought the yen. The USDJPY fell to the mid-146 yen range during the day. Although the pair rebounded to the 147 yen range later, it failed to climb further.
Meanwhile, the EURUSD hovered throughout the day, except when it touched the 1.177 range. The GBPUSD rose to the 1.352 range intraday.
October 2 (Thu)
The release of some major U.S. economic indicators was postponed due to the U.S. government's partial shutdown. The USDJPY fell to the 146.6 yen range. Later, the buyback of the dollar lifted the pair to the lower 147 yen range.
Meanwhile, the EURUSD fell below the 1.17 level. The GBPUSD dropped to the 1.34 level.
October 3 (Fri)
After BOJ Governor Kazuo Ueda expressed reluctance to additional monetary tightening, traders sold yen and the USDJPY rebounded to the 147.8 yen range. However, lingering concerns over the U.S. government shutdown capped the rebound. Later, weak U.S. ISM Non-Manufacturing PMI figures pushed the pair down slightly, but it closed the weekly trading session in the mid-147 yen range.
The EURUSD offset the previous day's decline, closing the weekly trading session at the 1.174 range. The GBPUSD rose to the 1.348 range.
Economic Indicators and Statements to Watch this Week
(All times are in GMT)
October 8 (Wed)
- 18:00 U.S.: Federal Reserve Open Market Committee (FOMC) meeting minutes*1
*1Due to the partial shutdown of the U.S. government, pending U.S. economic figures may be released this week.
This Week's Forecast
The following currency pair charts are analyzed using an overlay of the ±1σ and ±2σ standard deviation Bollinger Bands, with a 20-period moving average.
USDJPY
As the U.S. government postpones the release of major economic data due to the shutdown, the uncertainty is mounting. The Federal Reserve Board (FRB) will release the FOMC minutes on October 8th. If the minutes indicate that more meeting members prefer to continue the rate cut, the dollar will be sold off.
Next is an analysis of the USDJPY daily chart.
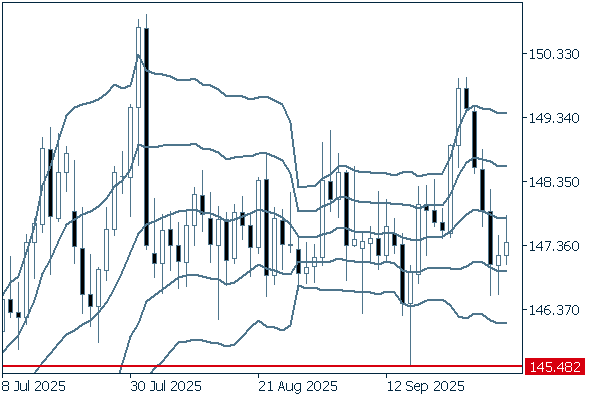
After briefly breaking above 149 yen, the pair fell for four consecutive days and returned to the range-bound market that has continued since July. If the pair drops below 145.48 yen, a new trend may emerge.
We continue with an analysis of the USDJPY weekly chart.
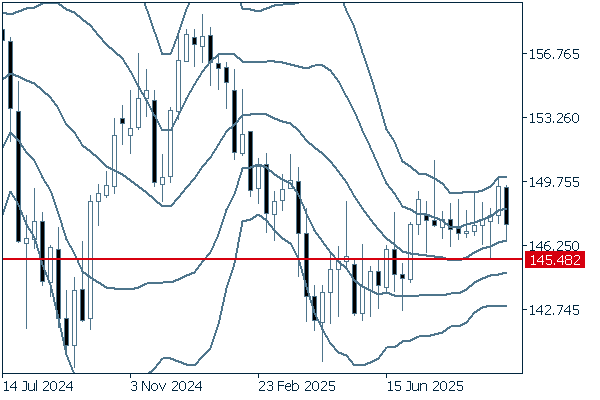
The pair had been rising gradually, but last week a long negative candlestick appeared, erasing the previous gains. If the pair falls below the 145.48 yen level, the current moderate uptrend could reverse into a new trend.
EURUSD
Uncertainty stemming from the U.S. government shutdown is leading to dollar selling, while the results of the HICP and other Eurozone economic indicators are creating a favorable environment for euro buying. Therefore, the EURUSD will see solid movement.
Next is an analysis of the EURUSD daily chart.
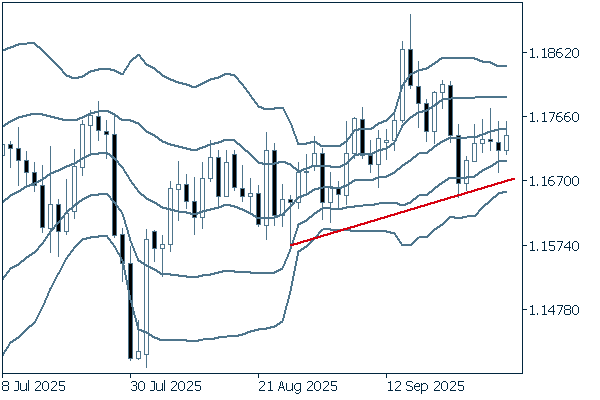
Instead of dramatic fluctuations, the pair has been edging up. As long as the pair stays above the trendline, it is safe to say that the uptrend will likely continue.
We continue with an analysis of the EURUSD weekly chart.
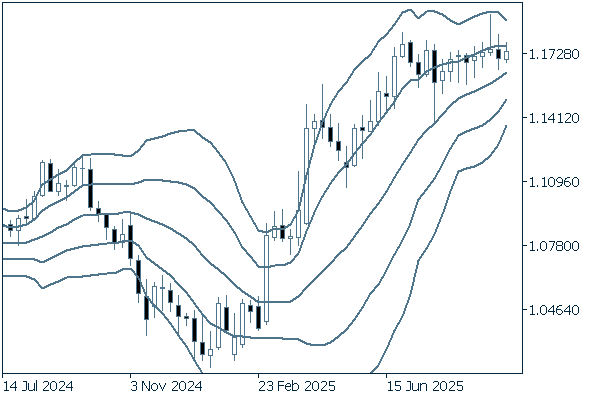
On the weekly chart, the pair has been steadily rising along +1σ. It is safe to say that the uptrend is continuing. Since fluctuations are relatively small, it would be better to make sure to buy on dips.
GBPUSD
Next is an analysis of the GBPUSD daily chart.
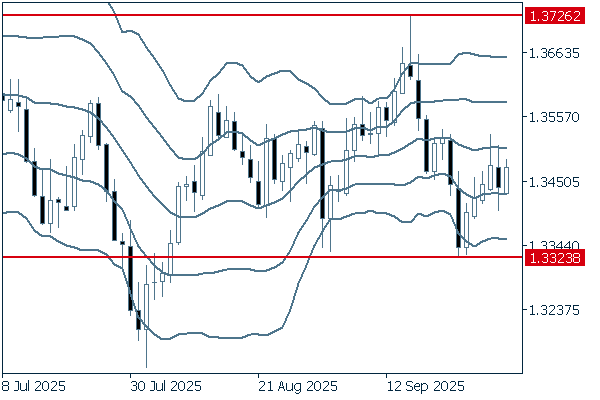
The pair has no clear direction, as it has been fluctuating within a fixed range. However, it stayed below the middle line last week. Therefore, it is important to keep in mind that the pair may start to trend downward.
We continue with an analysis of the GBPUSD weekly chart.
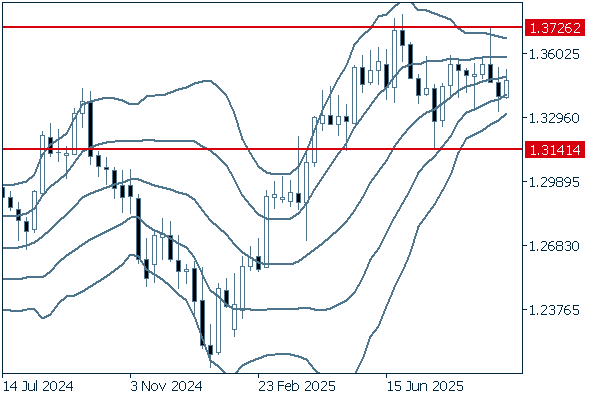
On the weekly chart, the bandwidth is narrowing, and the middle line is about to flatten. If the pair breaks above 1.3276, it may enter an uptrend. Conversely, if it drops below 1.3141, a downtrend will begin.
Don't miss trade opportunities with a 99.9% execution rate
Was this article helpful?
0 out of 0 people found this article helpful.
Thank you for your feedback.
Send