


2025.09.22
This article was :
published
updated
Weekly FX Market Review and Key Points for the Week Ahead
During the week that ended on September 21st, the foreign currency market was sensitive to monetary policy decisions made by central banks in the U.S., U.K., and Japan. Earlier in the week, the USDJPY fluctuated up and down, but concluded the weekly trading session with the dollar strengthening against the yen. The euro and the pound both weakened against the dollar throughout the week.
September 15 (Mon)
The Tokyo market was closed due to a national holiday. Ahead of the Federal Open Market Committee (FOMC) meeting of the Federal Reserve Board (FRB) and the Monetary Policy Meeting of the Bank of Japan (BOJ), traders had a wait-and-see attitude. After opening the weekly trading session in the upper 147 yen range, the USDJPY gradually fell to the 147.2 yen range.
Meanwhile, the EURUSD rose to the 1.172 range and the GBPUSD advanced to the 1.362 range.
September 16 (Tue)
Ahead of the FOMC and with no release of major economic data, traders maintained a wait-and-see attitude. The USDJPY remained directionless, hovering around the mid-147 yen range.
September 17 (Wed)
As expected, the FOMC decided to lower the U.S. interest rate by 0.25%. The committee also indicated that the FRB will cut rates twice more by the end of the year. This stance prompted a sell-off of the dollar, and the USDJPY plummeted to the mid-145 yen range.
However, comments by Federal Reserve Chair Jerome Powell at the post-meeting press conference cooled down excessive expectations for rate cuts. Consequently, traders bought back the dollar, and it strengthened against major currencies. The USDJPY rebounded to the 147 yen range. Meanwhile, after reaching the 1.19 range, the EURUSD fell back to the 1.18 range. The GBPUSD also dropped to the 1.36 range after touching the 1.372 range.
September 18 (Thu)
The USDJPY continued to advance, reaching the 148.2 yen range. As the figures of U.S. weekly initial jobless claims showed the strength of the U.S. employment market, the dollar further strengthened against major currencies. The EURUSD fell to the 1.175 range, and the GBPUSD dropped to the 1.353 range, respectively.
September 19 (Fri)
At the Monetary Policy Meeting, the BOJ decided to keep the policy interest rate unchanged. However, it also became clear that two board members voted against this decision and favored a rate hike. In response, the yen temporarily strengthened against the dollar.
At the post-meeting press conference, BOJ Governor Kazuo Ueda did not insist on a rate hike at the upcoming meeting in October. Consequently, the dollar was bought back.
After intra-day ups and downs, USDJPY concluded the weekly trading session around the 148 yen level. Meanwhile, the EURUSD fell to the lower 1.17 range, and the GBPUSD dropped below the 1.35 level.
Economic Indicators and Statements to Watch this Week
(All times are in GMT)
September 23 (Tue)
- Closure: Japan (national holiday)
September 24 (Wed)
- 14:00 U.S.: August new home sales
- 23:50 Japan: Summary of Opinions at the Monetary Policy Meeting
September 25 (Thu)
- 12:30 U.S.: April-June quarterly real Gross Domestic Product (revised GDP)
September 26 (Fri)
- 12:30 U.S.: August personal consumption expenditures (PCE deflator)
- 12:30 U.S.: August personal consumption expenditures (PCE core deflator, excluding food and energy)
This Week's Forecast
The following currency pair charts are analyzed using an overlay of the ±1σ and ±2σ standard deviation Bollinger Bands, with a 20-period moving average.
USDJPY
Although the market's cautions about the aggressive rate cut by the FRB have waned, the market remains cautious about the worsening U.S. employment market. Investors are waiting for the release of the PCE core deflator on September 26th to determine whether the figures will be able to boost the dollar. In the meantime, Japan's Liberal Democratic Party (LDP) will hold a presidential election on October 4th. If some front-runner candidates express opposition to a rate hike, the yen may be sold off.
Next is an analysis of the USDJPY daily chart.
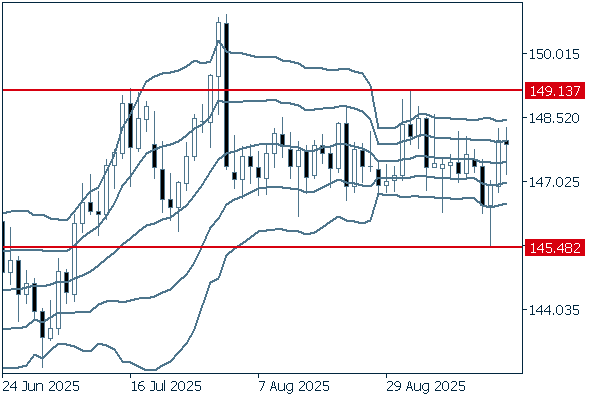
The daily chart shows that the pair has been pushed down after reaching around 149.13 yen, where a resistance line is located. Additionally, as the middle line flattens, the pair remains range-bound, lacking a clear direction. If the pair crosses below the 145.48 yen level, it may enter a downtrend.
We continue with an analysis of the USDJPY weekly chart.
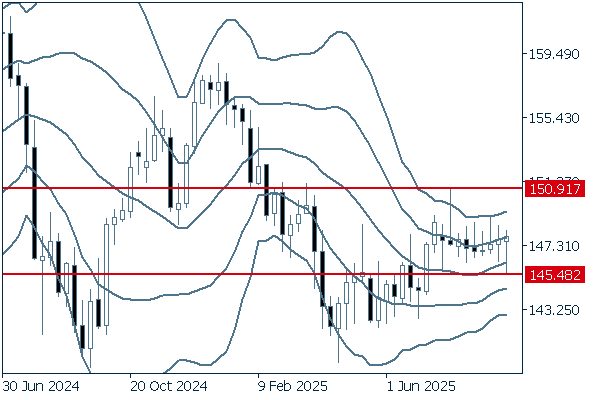
On the weekly chart, the pair is fluctuating along +1σ, and the middle line has turned slightly upward. Long lower wicks indicate that buying pressure is edging out selling pressure. As long as the pair remains above the 145.48 yen level, it would be good to buy on dips.
EURUSD
The Eurozone Manufacturing and Non-Manufacturing Purchasing Managers' Indexes (PMIs) will be released on September 23rd. If the figures show improvement, the euro will strengthen against the dollar. Conversely, if there is no positive data, the EURUSD will decline.
Next is an analysis of the EURUSD daily chart.
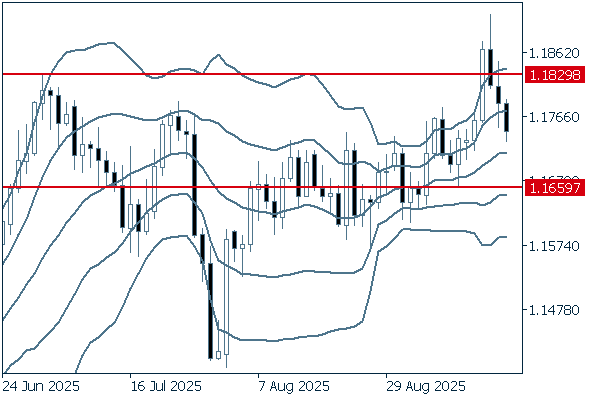
The daily chart shows that the pair has been setting higher highs and higher lows as it broke above the 1.1829 level, which was the high set in June. As long as the pair stays above the 1.1659 level, it is safe to say that the uptrend will likely continue. Therefore, it would be good to make sure to buy on dips.
We continue with an analysis of the EURUSD weekly chart.
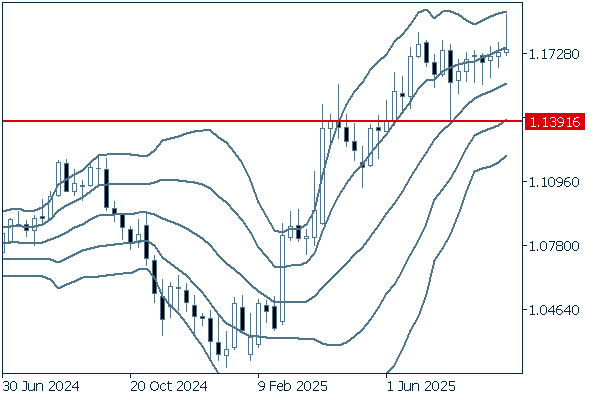
On the weekly chart, the pair is moving upward along +1σ, although the upward inclination turns gentle. Sure, the latest candlestick has a long upper wick. Nevertheless, it is safe to say that the uptrend will likely continue.
GBPUSD
The buy-back of the dollar at the end of last week, as well as lingering concerns about U.K. fiscal instability, are pushing the GBPUSD down. If the manufacturing and non-manufacturing PMI figures to be released on September 23rd are weak, it could accelerate the sell-off of the pound.
Next is an analysis of the GBPUSD daily chart.
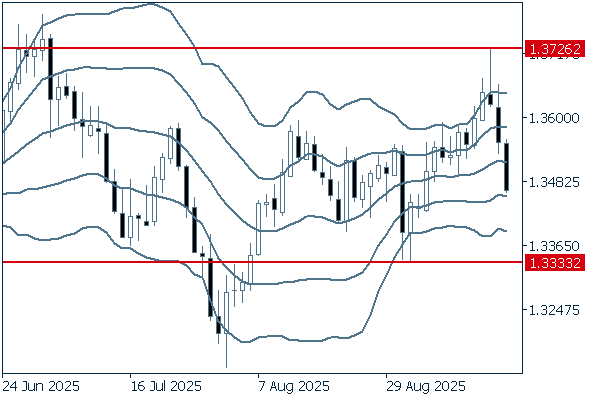
Although the pair temporarily broke above the resistance level of 1.36 and exceeded the upper limit of the band last week, it fell back to the middle line level to conclude the weekly trading session. The most recent rally started around the 1.3333 level. As long as the pair stays above this level, the uptrend will likely continue. On the other hand, if the pair falls below this level, it may be safe to say that the pair enters a downtrend.
We continue with an analysis of the GBPUSD weekly chart.
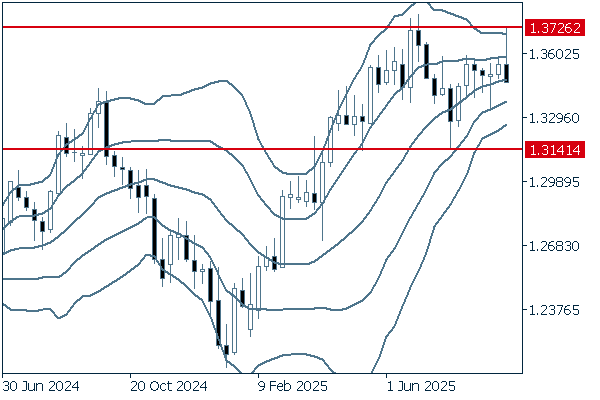
Although the pair temporarily broke above the range last week, mounting selling pressure pushed the pair lower. The upward middle line suggests that the uptrend will likely continue. However, if the pair falls clearly below 1.3141, a trend reversal may occur on a weekly basis.
Don't miss trade opportunities with a 99.9% execution rate
Was this article helpful?
0 out of 0 people found this article helpful.
Thank you for your feedback.
Send