


2025.09.15
This article was :
published
updated
Weekly FX Market Review and Key Points for the Week Ahead
The unstable political situation in Japan, U.S. economic indicators and the policy interest rate announcement by the European Central Bank (ECB) dominated the foreign currency market during the week that ended on September 14th. The USDJPY showed no clear direction, fluctuating between the lower 146 yen range and the mid-148 yen range. The EURUSD moved steadily, and the GBPUSD also remained relatively stable.
September 8 (Mon)
Following the announcement of Japanese Prime Minister Shigeru Ishiba's resignation on September 7th, the yen was sold off amid heightened political uncertainty. The USDJPY rose to the 148.5 yen range.
The EURUSD and GBPUSD offset the intraday decline at the end of the previous week, reaching the upper 1.17 and mid-1.355 range, respectively.
September 9 (Tue)
The yen sell-off led by the resignation of Ishiba has eased. Instead, traders sold the dollars as the market presumed that the upcoming Federal Reserve Open Market Committee (FOMC) meeting would decide to lower the U.S. interest rate due to the weaker-than-expected U.S. employment figures released two weeks ago. The USDJPY fell to the 146.3 yen range but then rebounded to the 147.4 yen range.
The buyback of the dollar led to a decline in the EURUSD, which moved from the 1.178 range to the 1.170 range. The GBPUSD followed suit, reaching 1.359 but then falling to the 1.351 range.
September 10 (Tue)
The market lacked clear direction throughout the day. Even the unexpectedly worse U.S. Producer Price Index (PPI) for August had little impact on the market.
The USDJPY hovered around the mid-147 yen level. The EURUSD remained within the lower 1.17 range, and the GBPUSD hovered around the mid-1.35 level.
September 11 (Thu)
The U.S. Consumer Price Index (CPI) for August exceeded initial expectations. However, the number of U.S. unemployment insurance weekly claims jumped unexpectedly, providing fresh negative data on the U.S. employment market. Consequently, the sell-off of the dollar intensified, and the USDJPY, which rose to the 148.18 yen range during the day, plummeted to beneath the 147 yen level.
The sell-off of the dollar boosted the EURUSD from the 1.165 range to the 1.174 range. The pound also strengthened against the dollar as the GBPUSD reached the 1.358 range during the day.
September 12 (Fri)
The dollar, which was sold off by the weak U.S. economic data the previous day, was bought back. The USDJPY recovered to the 148.0 yen range. However, in comparison to the uptick led by the weak yen early in the week, this surge showed slightly weaker upward momentum.
The EURUSD fluctuated within the 1.171 range. The GBPUSD was temporarily pushed down to the 1.352 range but concluded the weekly trading session by rebounding to the 1.355 range.
Economic Indicators and Statements to Watch this Week
(All times are in GMT)
September 16 (Tue)
- 12:30 U.S.: August Retail Sales
- 12:30 U.S.: August Retail Sales (excluding automotives)
September 17 (Wed)
- 09:00 Europe: August Harmonised Index of Consumer Prices (revised HICP)
- 09:00 Europe: August Harmonised Index of Consumer Prices (revised HICP core index)
- 18:00 U.S.: Federal Reserve Open Market Committee (FOMC) meeting, post-meeting policy rate announcement
- 18:30 U.S.: Regular press conference by Federal Reserve Chairman Jerome Powell
September 18 (Thu)
- 11:00 U.K.: Bank of England (BOE) policy interest rate announcement
- 11:00 U.K.: Minutes of Bank of England Monetary Policy Committee (MPC) meeting
- 23:30 Japan: August Consumer Price Index (CPI, all items, year-on-year data)
- 23:30 Japan: August Consumer Price Index (CPI, all items less fresh food)
- 23:30 Japan: August Consumer Price Index, Japan (CPI, all items less fresh food and energy)
September 19 (Fri)
- TBA Japan: Bank of Japan (BOJ) Monetary Policy Meeting, post-meeting policy rate announcement
- 06:30 Japan: Regular press conference by BOJ Governor Kazuo Ueda
This Week's Forecast
The following currency pair charts are analyzed using an overlay of the ±1σ and ±2σ standard deviation Bollinger Bands, with a 20-period moving average.
USDJPY
Recent employment data indicate a deterioration in the U.S. employment market. On the basis of these data, the FRB is expected to lower the interest rate at the FOMC meeting this week. However, if the central bank cuts the rate by only 0.25 percent, there is a possibility that more traders will buy back the dollar. On the other hand, the market is also trying to gauge the likelihood of an additional rate hike by the BOJ. However, as concerns over Japan's growing budget deficits loom, the USDJPY is expected to move steadily.
Next is an analysis of the USDJPY daily chart.
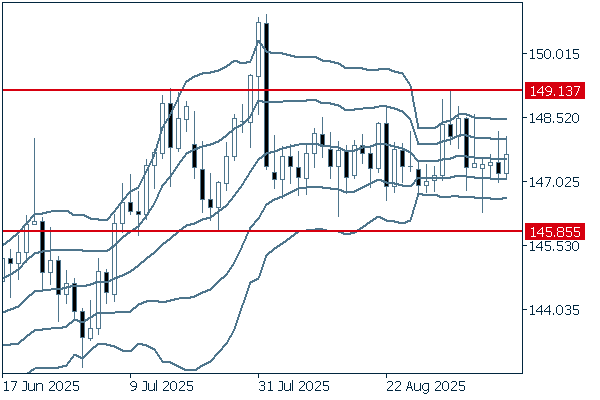
The daily chart indicates that the pair remains directionless as the middle line flattens and the band width is narrowing. As the period of fluctuation within the band range extends, the pair's downward or upward movement will gain momentum once it shows a clear trend. Therefore, it would be better to watch whether the pair clearly moves upward or downward and follow the momentum.
We continue with an analysis of the USDJPY weekly chart.
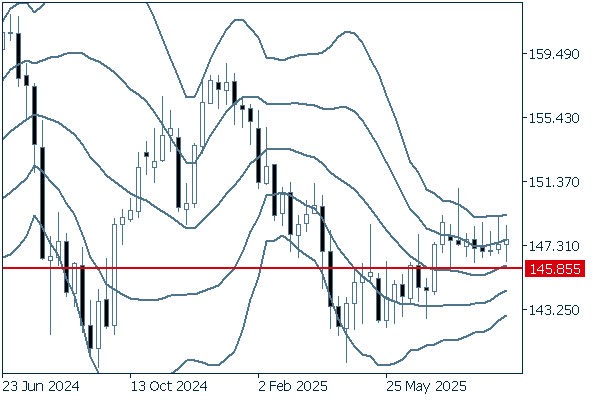
On the weekly chart, the pair is currently hovering around +1σ. Each candlestick has a long upper wick, indicating growing selling pressure. Nonetheless, it can be said that the pair has certain advantages for buyers. As long as the pair stays above the 148.85 yen level, it is basically safe to say that the uptrend will likely continue.
EURUSD
After the ECB decided to keep its policy interest rate unchanged, the risk-averse sell-off of the euro seems to be dwindling. The FRB is expected to lower the interest rate at the FOMC meeting this week. However, if the central bank cuts the rate by only 0.25 percent, there is a possibility that more traders will buy back the dollar, which can exert downward pressure on the euro.
Next is an analysis of the EURUSD daily chart.
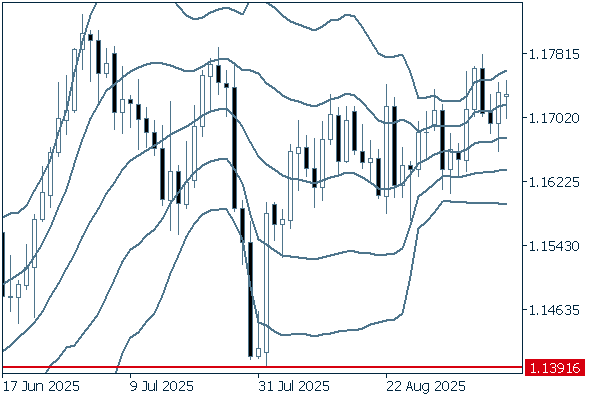
Although the pair has not moved significantly, it has been edging upward while being pushed downward at the highs. It would be good to make sure to buy on dips.
We continue with an analysis of the EURUSD weekly chart.
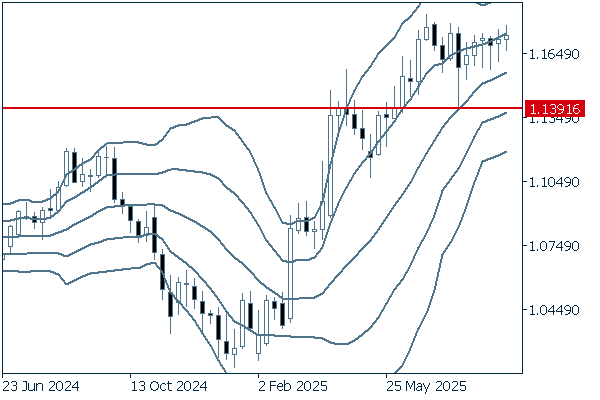
On the weekly chart, the pair is moving along the upward +1σ. Long lower wicks of candlesticks indicate increased buying interest in the euro among traders. Unless the pair falls below the 1.1391 level, it is safe to say that the uptrend will likely continue.
GBPUSD
If the U.K. CPI, to be announced on September 17th, shows strong figures, speculation over the interest rate cut by the Bank of England (BoE) will be reduced. However, the looming concerns over the U.K. fiscal situation will reduce the likelihood that more traders will buy the pound. As with the EURUSD, if the central bank cuts the rate by only 0.25 percent, there is a possibility that more traders will buy back the dollar, which can exert downward pressure on the pound.
Next is an analysis of the GBPUSD daily chart.
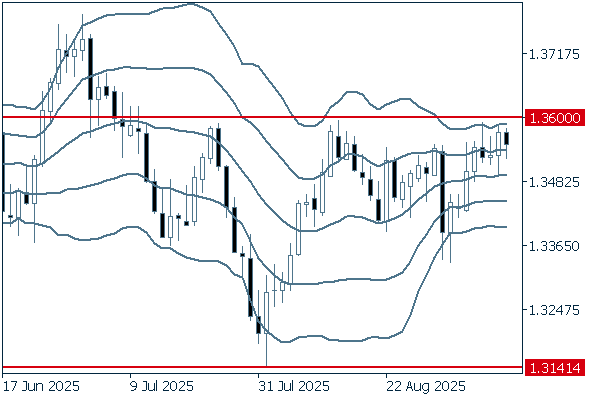
Although the middle line nearly flattens, the pair is moving along +1σ, indicating increased buying interest in the pound among traders. Meanwhile, the pair has repeatedly failed to break above the 1.36 level for weeks. Therefore, if the daily chart shows that the real body of the candlestick surpasses the level, the pair may get out of the directionless phase to enter the uptrend.
We continue with an analysis of the GBPUSD weekly chart.
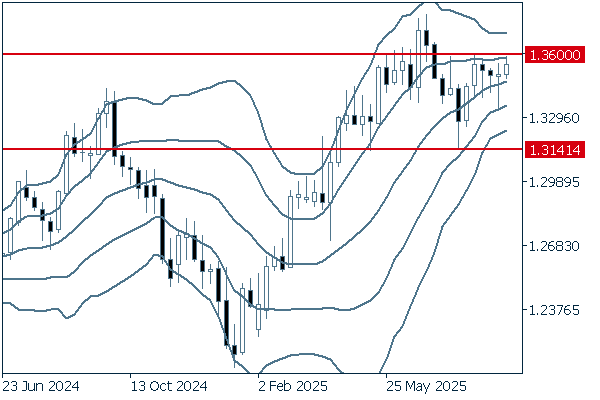
On the weekly chart, a resistance line appears to be located around 1.36. It is important to watch whether the pair can break above this line. Unless the pair crosses below 1.3141, it is safe to say that the uptrend will likely continue.
Don't miss trade opportunities with a 99.9% execution rate
Was this article helpful?
0 out of 0 people found this article helpful.
Thank you for your feedback.
Send