


2025.09.01
This article was :
published
updated
Weekly FX Market Review and Key Points for the Week Ahead
The foreign currency market lacked direction during the week that ended on August 31st. Confusion caused by the dismissal of a Federal Reserve Board governor and strong U.S. economic indicators sent mixed signals to the market. The USDJPY fluctuated around the 147 yen level throughout the week. Also, while political turmoil weakened the euro, the pound strengthened against the dollar.
August 25 (Mon)
Traders bought back the dollar, which fell sharply at the end of the previous week. Despite the lack of major news, the USDJPY rose to 147.93 yen.
Conversely, the EURUSD fell back to the 1.160 range and the GBPUSD dropped to the 1.344 range.
August 26 (Tue)
The market got confused following President Donald Trump's announcement that he was firing Federal Reserve Governor Lisa Cook, who argued against the president's decision, calling it legally groundless. Trump's announcement prompted traders to buy yen. However, the dollar soon rebounded after Cook's counterargument. Following the ups and downs, the USDJPY settled within the 147 yen range.
Meanwhile, both the EURUSD and GBPUSD lacked direction throughout the day, fluctuating around the mid-1.16 and upper 1.34 ranges, respectively.
August 27 (Wed)
Earlier, the USDJPY rose to 148.18 yen. However, it then failed to advance higher and instead fell to the 147.4 yen range.
In the EURUSD, political turmoil in France sparked a sell-off of the euro. The pair dropped to the upper 1.15 range before rebounding to the 1.164 range. Meanwhile, the GBPUSD offset a decline earlier in the day to reach the 1.35 range.
August 28 (Thu)
Comments by Junko Nakagawa, a Policy Board member of the Bank of Japan (BOJ), increased speculation about a potential rate hike by the Japanese central bank and accelerated yen buying. The USDJPY fell below the 146 yen level to reach the 146.6 yen range.
Meanwhile, the EURUSD rose to the 1.169 range as the dollar weakened. The GBPUSD remained within the 1.35 range after experiencing ups and downs.
August 29 (Fri)
Earlier, the USDJPY moved steadily into the 147.4 yen range. However, since the U.S. Personal Consumption Expenditures (PCE) Price Index for July turned out to be nearly in line with market forecasts, traders became more confident that the FRB would make a rate cut in September. Consequently, the pair fell to the 146.8 yen range, but then lacked direction for the remainder of the day.
The dollar weakened against other major currencies, too. The EURUSD moved higher to the 1.17 range. The GBPUSD initially fell to the 1.34 range but then rebounded to the 1.35 range to close the weekly trading session.
Economic Indicators and Statements to Watch this Week
(All times are in GMT)
September 2 (Tue)
- 09:00 Europe: August Harmonised Index of Consumer Prices (preliminary HICP)
- 09:00 Europe: August Harmonised Index of Consumer Prices (preliminary HICP core index)
- 14:00 U.S.: August ISM Manufacturing PMI
September 4 (Thu)
- 12:15 U.S.: August ADP National Employment Report
- 14:00 U.S.: August ISM Non-Manufacturing PMI (composite)
September 5 (Fri)
- 09:00 Europe: Quarterly Regional Gross Domestic Product (revised regional GDP)
- 12:30 U.S.: August change in nonfarm payrolls
- 12:30 U.S.: August unemployment rate
- 12:30 U.S.: August average hourly earnings
This Week's Forecast
The following currency pair charts are analyzed using an overlay of the ±1σ and ±2σ standard deviation Bollinger Bands, with a 20-period moving average.
USDJPY
U.S. economic data released in August fueled speculation in the market that the FRB would make a rate cut in September. Political pressure from the Trump administration also contributed to the surge in speculation. Traders will focus on the U.S. employment figures to be released on September 5th to forecast the likelihood of a rate cut.
Next is an analysis of the USDJPY daily chart.
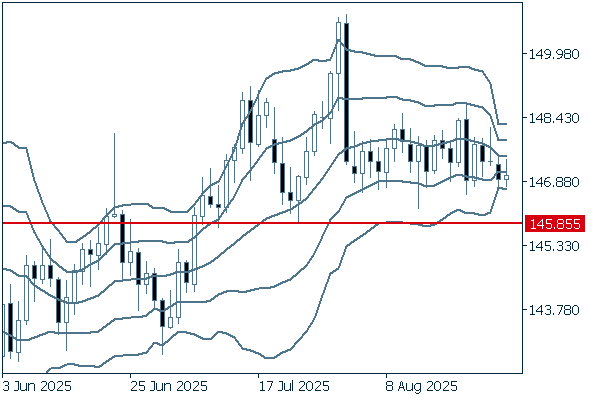
While the pair has been hovering around the 147 yen level, the band width has been narrowing. If the pair drops below 145.85 yen, where the most recent rally began back in July, the downtrend will likely intensify as the strength of the yen will become clearer.
We continue with an analysis of the USDJPY weekly chart.
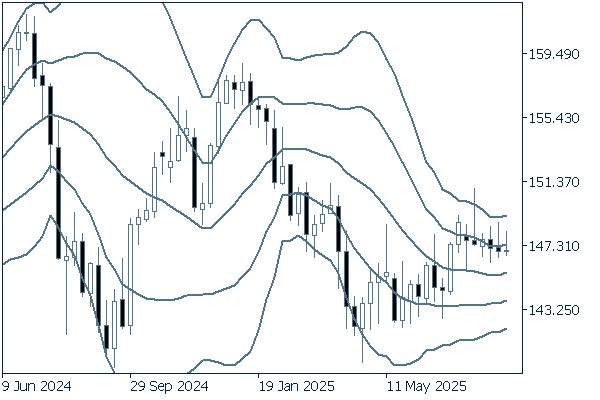
The weekly chart indicates prevalent selling pressure for the dollar, as the pair is moving down alongside the gradual downward movement of +1σ. Since there is no clear indication of the future direction, it would be good to sell on a rally at shorter intervals for the time being.
EURUSD
The weakening dollar is helping the EURUSD head back toward the level it was on August 22nd. The market is focused on whether the FRB will decide to make a rate cut in September. U.S. employment figures will be a crucial indicator to forecast the central bank's decision.
Next is an analysis of the EURUSD daily chart.
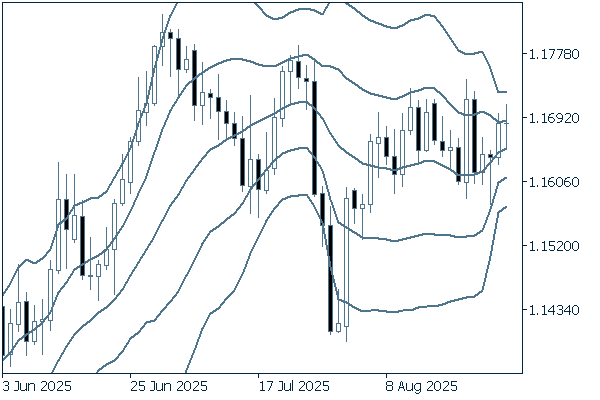
After plunging last Monday, the pair rebounded and has been fluctuating above the middle line. However, the current chart does not indicate a clear future direction. It would be better to buy dips actively. Nevertheless, it cannot be ruled out that the pair may break out upward.
We continue with an analysis of the EURUSD weekly chart.
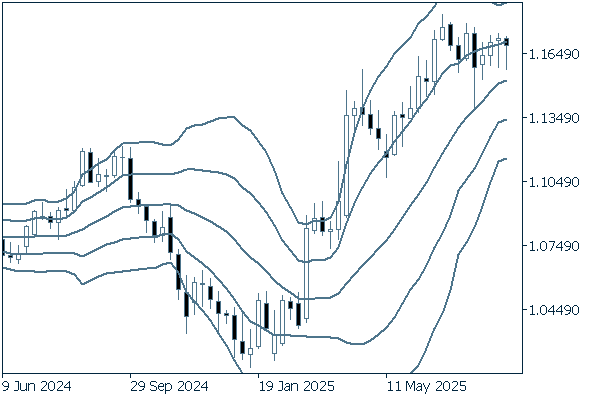
Although the middle line remains upward, the pair has been struggling to rise for weeks. Nevertheless, given the prevalence of buying pressure, it is safe to say that the uptrend will likely continue.
GBPUSD
The market is shifting its focus to the U.S. employment figures to be released on September 5th. If the figures fall short of market forecasts, as seen in August, speculation about a U.S. rate cut will increase, and the sell-off of the dollar will intensify.
Next is an analysis of the GBPUSD daily chart.
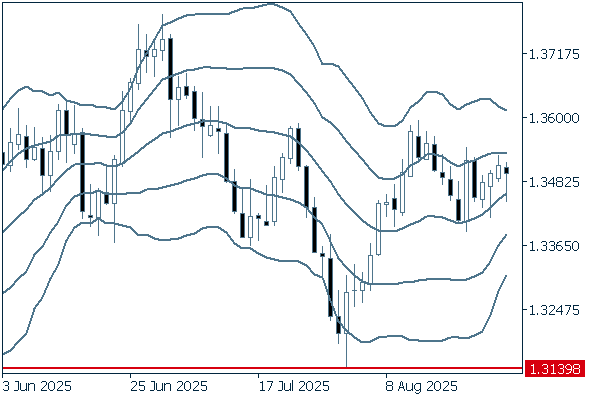
The pair is showing steadiness, hovering between the middle line and +1σ. Unless it falls below the 1.3139 level, it would be better to buy dips actively.
We continue with an analysis of the GBPUSD weekly chart.
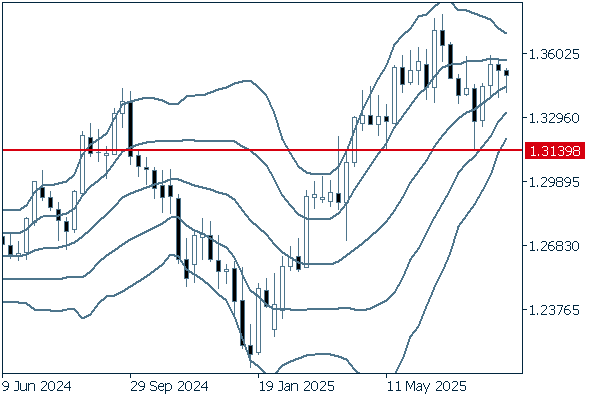
Although the middle line is trending upward, the band width is narrowing. Regardless of whether the pair moves up or down, it will indicate a clear directional trend. For now, it would be good to keep an eye on whether the pair can break above the 1.36 level.
Don't miss trade opportunities with a 99.9% execution rate
Was this article helpful?
0 out of 0 people found this article helpful.
Thank you for your feedback.
Send