


2025.07.28
This article was :
published
updated
Weekly FX Market Review and Key Points for the Week Ahead
In the foreign exchange market for the week that ended on July 27th, several factors were tangled up, such as the political scene in Japan, the development of U.S.-Japan trade talks and speculation of major central banks' monetary policies. After experiencing significant ups and downs, the USDJPY rebounded as the dollar was bought back late last week. Meanwhile, the EURUSD and GBPUSD advanced but failed to approach recent highs.
July 21 (Mon)
The results of Japan's Upper House election on July 20th revealed that the ruling parties failed to retain a majority. Consequently, the USDJPY gaped up at the start of the weekly trading session as the yen was sold. After rising to the 148.6 yen range, however, the pair fell to the 147.0 yen range.
As the dollar weakened, the EURUSD rose to the 1.171 range, and the GBPUSD surged to the 1.35 range.
July 22 (Tue)
The USDJPY rebounded from the previous day's decline. However, the pair then fell to a daily low of 146.30 yen as selling pressure on the dollar strengthened.
Meanwhile, after slightly weakening against the dollar earlier in the day, the euro gained strength, pushing the EURUSD up to the 1.176 range during New York trading hours. The GBPUSD also rose to the 1.353 range as traders bought the pound on dips.
July 23 (Wed)
The U.S. and Japan reached a tariff agreement. At the same time, some media outlets reported that Prime Minister Shigeru Ishiba had seemingly decided to resign. These developments caused the USDJPY to fluctuate wildly during Tokyo trading hours. The pair rose to the 147.2 yen range, then plummeted to the 146.1 yen range.
Meanwhile, the weaker-than-expected U.S. economic data pushed the EURUSD up to the 1.177 range in New York trading hours after the euro was sold earlier in the day. The GBPUSD also rose to the 1.358 range.
July 24 (Thu)
Speculation that the Bank of Japan (BOJ) will raise interest rates soon has strengthened. Additionally, some media outlets reported that the U.S. Commerce Secretary Howard Lutnick called for the resignation of Federal Reserve Board (FRB) Chair Jerome Powell. These factors pushed the USDJPY below 146 yen. However, the pair then halted its decline and rebounded to the 147.1 yen range.
The EURUSD remained within the 1.17 range. Conversely, weaker-than-expected U.K. preliminary PMI figures strengthened expectations that the Bank of England (BOE) will make a rate cut. As a result, the GBPUSD fell, almost breaking below the 1.35 level.
July 25 (Fri)
As lower-than-expected Tokyo-area CPI figures reduced speculation that the BOJ would make a rate hike, the yen weakened against the dollar. Then, during New York trading hours, U.S. President Donald Trump said it was unnecessary to relieve Federal Reserve Chairman Powell of his duties. Consequently, the dollar strengthened against the yen, and the USDJPY approached 148 yen.
Meanwhile, as the dollar's decline paused, the EURUSD fell, almost breaking below the 1.17 level. The GBPUSD closed the weekly trading session by falling to the lower 1.34 range.
Economic Indicators and Statements to Watch this Week
(All times are in GMT)
July 30 (Wed)
- 09:00 Europe: April-June quarterly regional gross domestic product (preliminary regional GDP)
- 12:15 U.S.: June ADP National Employment Report (month-on-month)
- 12:30 U.S.: April-June quarterly real gross domestic product (preliminary GDP)
- 18:00 U.S.: Federal Reserve Open Market Committee (FOMC) meeting, post-meeting policy rate announcement
- 18:30 U.S.: Regular press conference by Federal Reserve Chairman Jerome Powell
July 31 (Thu)
- TBA Japan: Bank of Japan (BOJ) Monetary Policy Meeting, post-meeting policy rate announcement
- TBA Japan: BOJ Outlook for Economic Activity and Prices
- 06:30 Japan: Regular press conference by BOJ Governor Kazuo Ueda
- 12:30 U.S.: April-June quarterly Employment Cost Index
- 12:30 U.S.: June personal consumption expenditures (PCE deflator)
- 12:30 U.S.: June personal consumption expenditures (PCE core deflator, excluding food and energy)
August 1 (Fri)
- 09:00 Europe: July Harmonised Index of Consumer Prices (preliminary HICP)
- 09:00 Europe: July Harmonised Index of Consumer Prices (preliminary HICP core index)
- 12:30 U.S.: July change in nonfarm payrolls
- 12:30 U.S.: July unemployment rate
- 12:30 U.S.: July average hourly earnings
- 14:00 U.S.: July ISM Manufacturing PMI
This Week's Forecast
The following currency pair charts are analyzed using an overlay of the ±1σ and ±2σ standard deviation Bollinger Bands, with a 20-period moving average.
USDJPY
The market will focus on the policy rate announcements of the FRB and the BOJ. It is expected that both central banks will leave their rates unchanged. Therefore, the dollar will strengthen against the yen. However, if the market has already factored in these announcements, the pair will not experience significant fluctuations.
Next is an analysis of the USDJPY daily chart.
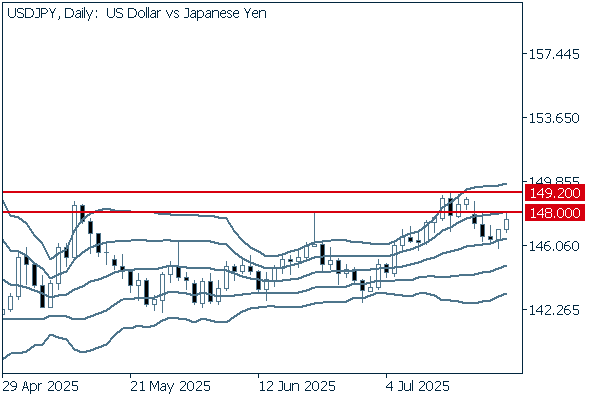
Last week, the pair showed a rebound after breaking below the middle line. For now, it is important to see whether the pair can clearly break above the 148 yen level. If it crosses above 149.20 yen, it will likely advance to 150 yen.
We continue with an analysis of the USDJPY weekly chart.
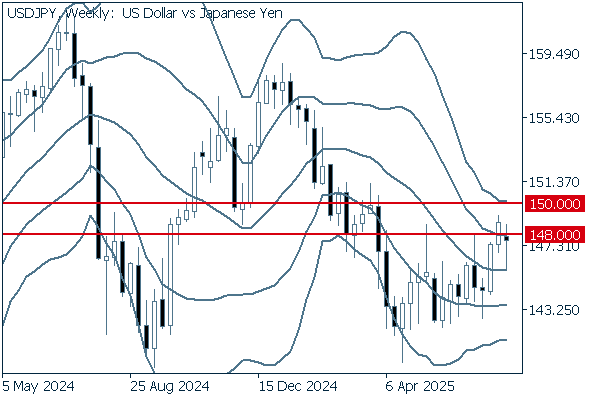
The middle line is about to flatten. Although a negative candlestick appeared last week, the pair traded above the middle line to close the weekly trading session. This indicates that buying pressure for the dollar is mounting. If the pair breaks above the current high of 148 yen, it will likely advance to 150 yen.
EURUSD
Last week, the European Central Bank (ECB) left the interest rate unchanged. However, the central bank did not clarify whether or not it would make a rate cut in September. With August 1st approaching - the date on which the U.S. will impose additional tariffs on imports from Europe - the market will focus on the development of trade talks between the U.S. and the E.U.
Next is an analysis of the EURUSD daily chart.
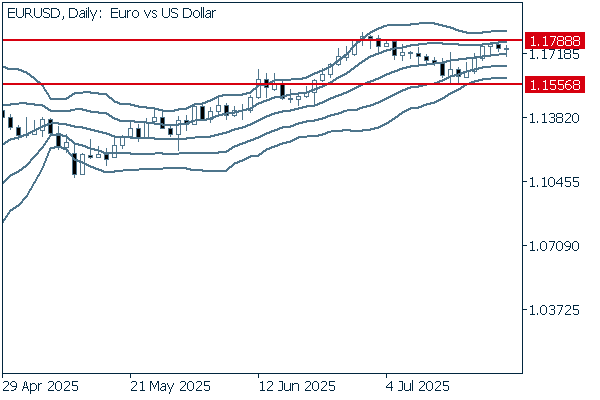
The daily chart indicates that the pair is losing direction. If the pair clearly breaks below 1.1556, it may signal an entry into a downtrend. On the other hand, if the pair breaks above 1.1788, it will continue to advance.
We continue with an analysis of the EURUSD weekly chart.
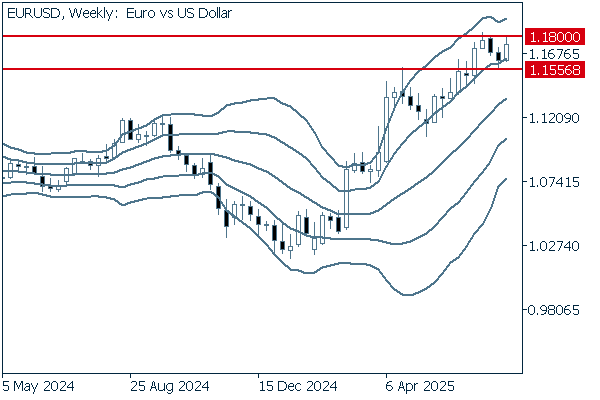
The weekly chart indicates that the pair is still in an uptrend, as the euro was bought during dips. Additionally, the chart shows that the pair has not fallen below +1σ for approximately ten weeks. It is safe to say that the uptrend will likely continue. Furthermore, it is important to see whether the pair can break above the 1.18 level again.
GBPUSD
The Office for National Statistics (ONS) announced that the U.K. government's borrowings reached a record high. It reignited uncertainty over the government's financial sustainability. Meanwhile, in the U.S., the FRB will announce the policy rate, and employment figures will be released on August 1st. Considering these factors, it will be important to watch whether selling pressure against the pound increases.
Next is an analysis of the GBPUSD daily chart.
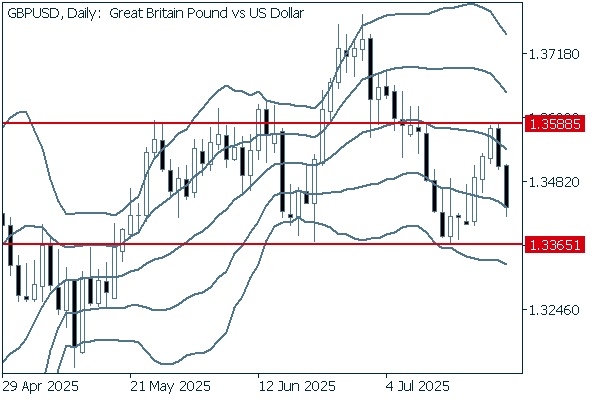
The daily chart indicates that the pair is losing direction, as the middle line is about to flatten. If the pair clearly breaks above 1.3588, it could signal that the uptrend will continue. Conversely, if the pair falls below 1.3365, it could indicate a trend reversal to a downtrend.
We continue with an analysis of the GBPUSD weekly chart.
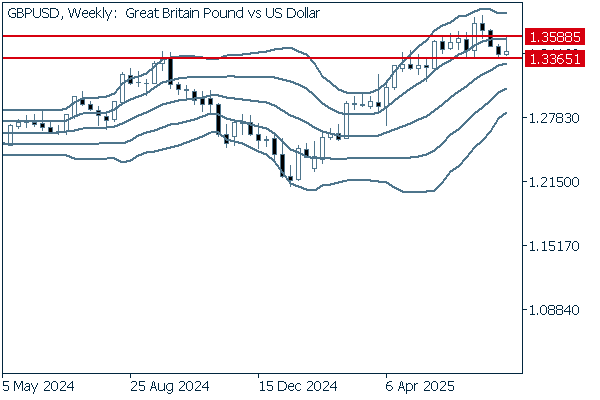
As the upward band walk came to an end, the pair is now on the brink of either continuing to climb or entering a range-bound phase. If the pair clearly falls below 1.3365, it would be better to assume that the pound's uptrend is pausing.
Don't miss trade opportunities with a 99.9% execution rate
Was this article helpful?
0 out of 0 people found this article helpful.
Thank you for your feedback.
Send