


2025.07.21
This article was :
published
updated
Weekly FX Market Review and Key Points for the Week Ahead
In the foreign exchange market for the week that ended on July 20th, the dollar gained moderate strength against major currencies. However, U.S. political news and economic data dominated the market. The USDJPY was especially sensitive to political risks and economic data throughout the week.
July 14 (Mon)
U.S. President Donald Trump announced that the U.S. would impose a 30% tariff on imports from Europe and Mexico, effective August 1st. In response, traders took a risk-off stance and bought the yen. The USDJPY fell to 146.86 yen before rebounding to the 147.7 yen range as the dollar was bought back later in the day.
Meanwhile, the EURUSD broke below the 1.17 level, and the GBPUSD fell to the lower 1.34 range.
July 15 (Tue)
The higher-than-expected U.S. Consumer Price Index (CPI) for June, announced during New York trading hours, spurred dollar buying and pushed the USDJPY upward. The pair reached 149 yen, surpassing the monthly high set in May.
Conversely, the EURUSD broke below the 1.16 level and the GBPUSD fell to the 1.33 range.
July 16 (Wed)
During Tokyo trading hours, the USDJPY reached a weekly high of 149.18 yen before dropping to the 147.6 yen range. During New York trading hours, it was reported that Trump might dismiss Federal Reserve Board Chair Jerome Powell. This news accelerated the dollar sell-off, pushing the pair down to the 146.9 yen range.
As the dollar was sold off, the EURUSD jumped from beneath the 1.16 level to the 1.172 range. The GBPUSD also fluctuated wildly over a short period, surging from under the 1.336 level to the 1.348 range.
July 17 (Thu)
The dollar strengthened against major currencies after Trump denied reports of the Powell dismissal. During New York trading hours, the USDJPY reached 149.09 yen before moving back to the middle of the 148 yen range.
The euro weakened against the dollar, with EURUSD falling to the 1.155 range. Meanwhile, GBPUSD hovered within the 1.34 range.
July 18 (Fri)
Before Japan's Upper House election on July 20th, political uncertainty dominated the market, prompting traders to sell yen. The USDJPY remained within the 148 yen range.
The declining EURUSD showed a rebound, rising to the 1.167 range before falling slightly to the 1.162 range. The GBPUSD rose to the 1.347 range but concluded the weekly trading session at the 1.340 range.
Economic Indicators and Statements to Watch this Week
(All times are in GMT)
July 22 (Tue)
- 11:30 U.S.: Speech by Federal Reserve Board (FRB) Chair Jerome H. Powell
July 24 (Thu)
- 11:15 Europe: European Central Bank (ECB) Governing Council policy interest rate
- 11:45 Europe: Regular press conference by ECB President Christine Lagarde
- 14:00 U.S.: June new home sales
This Week's Forecast
The following currency pair charts are analyzed using an overlay of the ±1σ and ±2σ standard deviation Bollinger Bands, with a 20-period moving average.
USDJPY
If Japan's Upper House election on July 20th results in a victory for the opposition parties, the yen sell-off will accelerate as the market speculates that Japan's fiscal situation may deteriorate. Last week, the USDJPY surpassed the monthly high set in May and reached the 149 yen range. Now, the pair's next upper target is 150 yen.
Next is an analysis of the USDJPY daily chart.
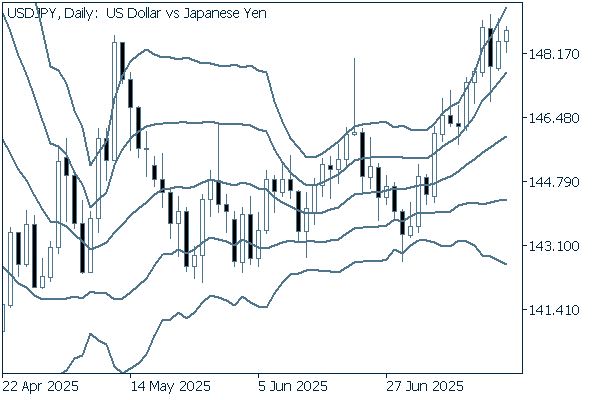
The pair is climbing along the upward band walk, indicating a strong uptrend. Last week, the pair was pushed back after reaching the 149 yen range. Nevertheless, it is safe to say that the pair is on its way to reaching the current upper target of 150 yen.
We continue with an analysis of the USDJPY weekly chart.
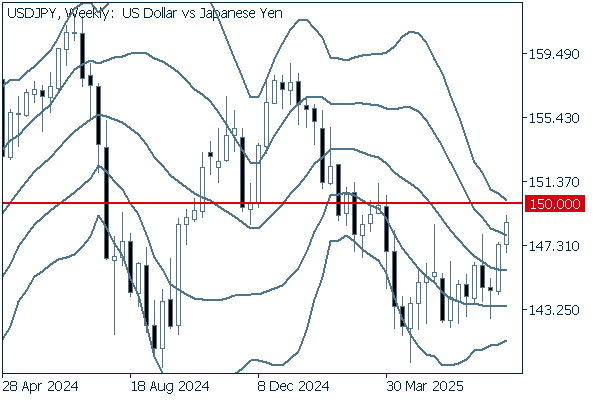
On the weekly chart, two consecutive positive candlesticks appeared. Additionally, the pair broke above +1σ to conclude last week's trading session. While it is important to see whether the pair can reach and surpass 150 yen, it is approaching the upper limit of the band. Therefore, even if the pair surpasses 150 yen, it could be pushed back down.
EURUSD
At the July 24th Governing Council meeting, the ECB is expected to leave the policy interest rate unchanged. The market is focusing on what President Lagarde has to say about the central bank's monetary policy at the post-meeting press conference. If she expresses reluctance about future rate cuts, the euro will strengthen. Conversely, if she strongly insists that the ECB will make a rate cut by the end of the year, the euro sell-off may reignite.
Next is an analysis of the EURUSD daily chart.
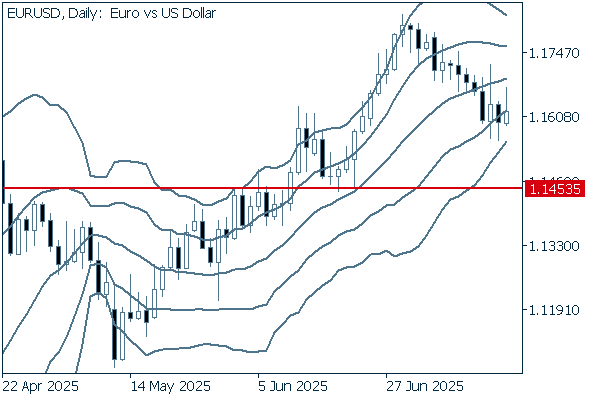
After the uptrend ended, the pair continued to fall and clearly broke below -1σ last week. The most recent uptrend started when the pair hit 1.1453. If the pair falls below this level, it can be a clear sign that a downtrend has begun.
We continue with an analysis of the EURUSD weekly chart.
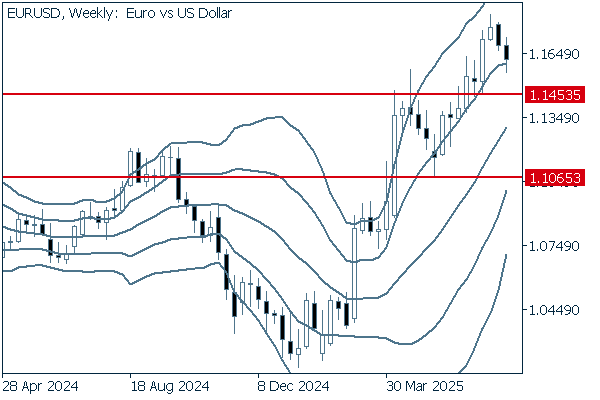
On the weekly chart, the middle line maintains an upward trend. However, if the pair falls below 1.1453, where the most recent uptrend started on the daily chart basis, it may go down as low as 1.1065, where the most recent uptrend started on the weekly chart basis.
GBPUSD
The U.S. CPI for June, announced last week, rose amid concerns over the Trump tariffs. As a result, the dollar will likely continue to strengthen against the pound.
Next is an analysis of the GBPUSD daily chart.
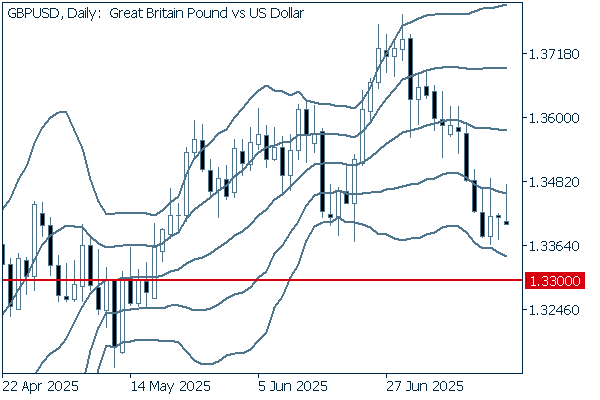
The selling pressure on the pound is mounting. Last week, as indicated by the lower wicks, the pair briefly fell below the level at which the most recent uptrend began. If the bottom of the candlestick's real body lies below this level, it could be a clear sign that the pair is entering a downtrend. Therefore, it will be best to wait and see until the direction becomes clear before making an entry.
We continue with an analysis of the GBPUSD weekly chart.
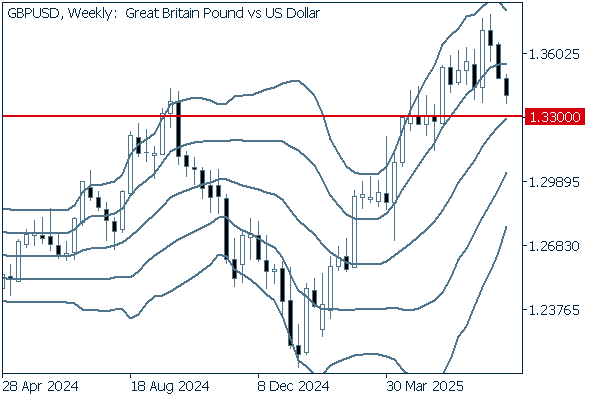
Three consecutive negative candlesticks appeared on the weekly chart. As the pair fails to make higher lows, the uptrend that began last December will finally come to an end. If the pair falls below 1.33, it may break below the middle line and continue to fall.
Don't miss trade opportunities with a 99.9% execution rate
Was this article helpful?
0 out of 0 people found this article helpful.
Thank you for your feedback.
Send