


2025.07.14
This article was :
published
updated
Weekly FX Market Review and Key Points for the Week Ahead
In the foreign exchange market for the week that ended on July 13th, the dollar strengthened against the yen due to several factors, including the development of the Trump tariffs and forecasts of U.S. and Japanese monetary and fiscal policies. The USDJPY reached the 147 yen range late last week. Meanwhile, the strengthening dollar pushed the EURUSD and GBPUSD down.
July 7 (Mon)
After U.S. President Donald Trump announced that the U.S. would impose additional 10% tariffs on imports from countries siding with BRICS, the dollar strengthened against the currencies of emerging countries. Consequently, the USDJPY jumped from the 144 yen range to the 146.2 yen range.
Meanwhile, the EURUSD fell to the 1.168 range, and the GBPUSD was pushed down to the 1.357 range.
July 8 (Tue)
The yen continued to be sold off due to concerns over the slowdown in the growth of the Japanese economy, the ruling parties' struggles in the Upper House election campaign, and the credit insecurity triggered by government bond issuance. After hovering around 146.0 yen, the USDJPY rose to the 146.9 yen range.
The sell-off of the dollar pushed the EURUSD up to the 1.176 range, but then the pair broke below the 1.17 level. Also, in addition to the strengthening dollar, anxieties over U.K. financial insecurity caused the GBPUSD to fall below the 1.36 level.
July 9 (Wed)
The sell-off of the yen continued due to the possible impacts of the Trump tariffs and concerns over the Japanese economy. During the Tokyo trading session, the USDJPY touched 147.18 yen. Afterward, however, the pair was pushed down to the 146.3 yen range.
The EURUSD hovered around the 1.170 level, and the directionless GBPUSD hovered around the 1.36 level.
July 10 (Thu)
The USDJPY lacked a clear direction throughout the day. After reaching an intraday low of 145.75 yen during the Tokyo trading session, the pair rebounded to 146.78 yen.
The EURUSD fell to the 1.166 range during the day, and the GBPUSD also dropped to the 1.353 range.
July 11 (Fri)
Trump announced that the U.S. would uniformly impose tariffs ranging from 15 to 20 percent on imports from most countries. Additionally, speculation increased that the U.S. would delay a rate cut. Consequently, the dollar strengthened against major currencies. The USDJPY hit a weekly high of 147.52 yen. The EURUSD fluctuated within the 1.169 range, and the GBPUSD fell below the 1.35 level to close the weekly trading session.
Economic Indicators and Statements to Watch this Week
(All times are in GMT)
July 15 (Tue)
- 12:30 U.S.: June Consumer Price Index (CPI)
- 12:30 U.S.: June Consumer Price Index (CPI Core Index)
July 17 (Thu)
- 09:00 Europe: June Harmonised Index of Consumer Prices (revised HICP)
- 09:00 Europe: June Harmonised Index of Consumer Prices (revised HICP core index)
- 12:30 U.S.: June retail sales
- 12:30 U.S.: June retail sales (excluding automotives)
- 23:30 Japan: June Consumer Price Index (CPI, all items less, year-on-year data)
- 23:30 Japan: June Consumer Price Index (CPI, all items less fresh food)
- 23:30 Japan: June Consumer Price Index (CPI, all items less fresh food and energy)
This Week's Forecast
The following currency pair charts are analyzed using an overlay of the ±1σ and ±2σ standard deviation Bollinger Bands, with a 20-period moving average.
USDJPY
Traders will focus on the U.S. economic index this week. In particular, if the U.S. June CPI for both all items and those less food and energy (the core index) increases month over month, the market will further reduce speculation about an early rate cut in the U.S. However, the market will also be anxious about the downturn in consumer spending triggered by higher prices and the slowdown of the country's economy.
Next is an analysis of the USDJPY daily chart.
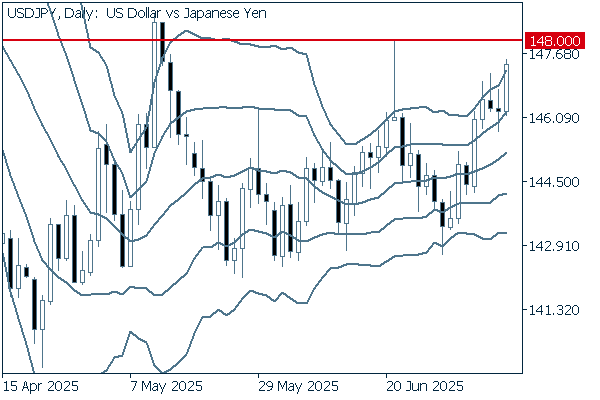
The pair has been edging higher while fluctuating wildly within the band. The pair's current upper target is the resistance line around 148 yen. If the pair crosses above this line, it will likely head towards 149 yen.
We continue with an analysis of the USDJPY weekly chart.
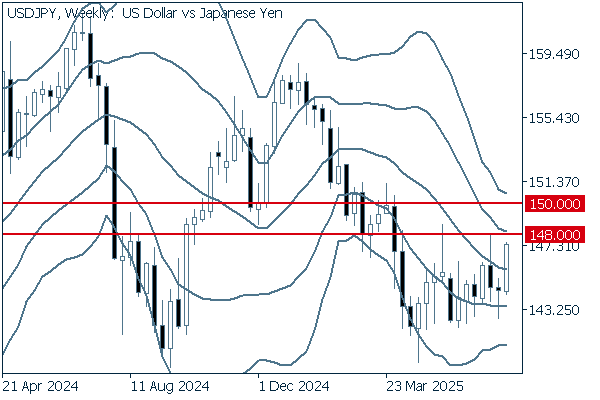
The pair closed the weekly trading session two weeks ago with a long lower wick. The following week, the pair surged as a long positive candlestick appeared on the chart. The pair's current upper target is 148 yen. If the pair crosses above this level, it may head toward 150 yen.
EURUSD
A series of news reports about the Trump tariffs has been pushing the dollar up and weakening the euro. This week, news about tariffs and forecasts of a U.S. interest rate cut will dominate the market.
Next is an analysis of the EURUSD daily chart.
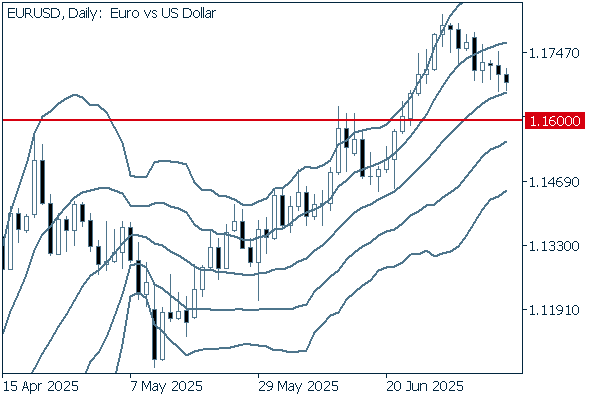
After climbing along the upward band walk, the pair broke below +1σ and is now approaching the middle line. If the pair clearly falls below 1.16 and even 1.15, it should be taken into account that the uptrend may come to an end.
We continue with an analysis of the EURUSD weekly chart.
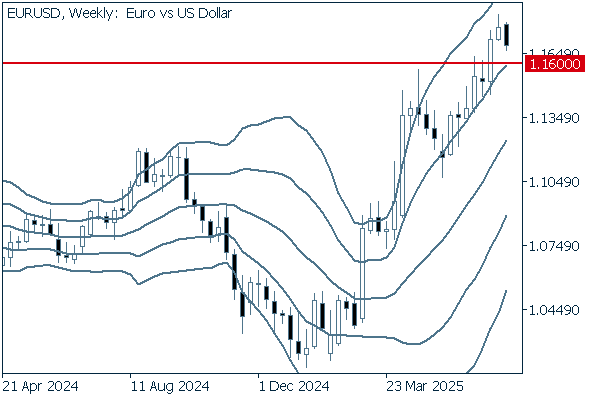
On the weekly chart, a long negative candle appeared last week, indicating an increase in selling pressure. The middle line maintains its upward curve. Nevertheless, if the pair clearly breaks below the 1.16 level, a mid-term trend reversal may occur.
GBPUSD
Uncertainties cast a cloud over the pound due to the strengthening dollar and increasing speculation of an early rate cut by the Bank of England, triggered by worsening economic indicators and fiscal turmoil in the country. It should be taken into account that the pound's uptrend, which began in March, may be coming to an end.
Next is an analysis of the GBPUSD daily chart.
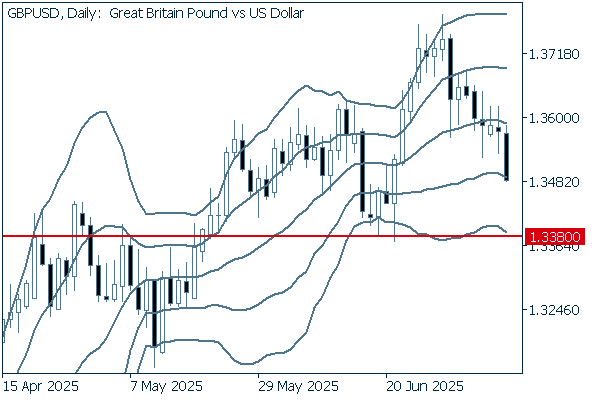
On the daily chart, the latest uptrend for the pound started when the pair hit the 1.338 level in late June. However, after an upper wick crossed over +2σ two weeks ago, the pair began to decline and broke below -1σ on a real body basis to close last week's trading session. If the pair falls clearly below the 1.338 level, it could transition to a short-term downtrend.
We continue with an analysis of the GBPUSD weekly chart.
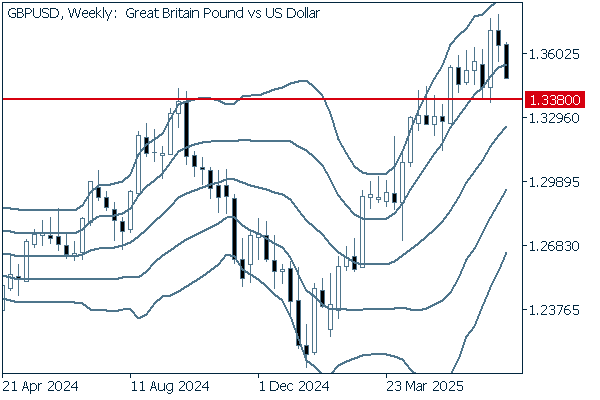
On the weekly chart, two consecutive negative candlesticks appeared as the pair broke below +1σ last week. The middle line maintains its upward curve. However, the recent candlesticks have long upper wicks, indicating an increase in selling pressure. To forecast the trend, it will be important to watch whether the pair rebounds at the 1.338 level or clearly breaks below it.
Don't miss trade opportunities with a 99.9% execution rate
Was this article helpful?
0 out of 0 people found this article helpful.
Thank you for your feedback.
Send