


2025.06.09
This article was :
published
updated
Weekly FX Market Review and Key Points for the Week Ahead
In the foreign exchange market for the week that ended on June 8th, the dollar continued to weaken against the yen, and the USDJPY fell to the 142 yen range. However, steady U.S. employment data boosted dollar buying, lifting the pair back up to the 145 yen range. Meanwhile, the EURUSD and GBPUSD moved solidly due to persistent pressure to sell the dollar. As the weekend approached, however, both pairs were pushed down slightly.
June 2 (Mon)
The USDJPY started the weekly trading session in the upper 143 yen range. Then, the pair fell to 142.53 yen as the dollar sell-off was triggered by a comment from Federal Reserve Board (FRB) member Christopher J. Waller and an announcement from U.S. President Donald Trump that the U.S. would increase tariffs on imported steel and aluminum.
The EURUSD rose to the 1.144 range, and the GBPUSD rose to the 1.355 range.
June 3 (Tue)
The yen sell-off intensified after Bank of Japan (BOJ) Governor Kazuo Ueda said the Japanese central bank would not rush to make another interest rate hike. The USDJPY surged to the 143 yen range and even hit 144.1 yen. Conversely, the EURUSD was pushed back to the 1.139 range, and the GBPUSD temporarily broke below the 1.35 level.
June 4 (Wed)
By the London trading session, the USDJPY pair was hovering around the 144.0 yen level. Later, on New York time, weak results from the ADP National Employment Report and the ISM Non-Manufacturing PMI prompted traders to sell the dollar, causing the pair to drop to the 142.6 yen range.
These negative surprises for the dollar pushed the EURUSD up to return to the 1.143 range and the GBPUSD up to the 1.358 range.
June 5 (Thu)
The USDJPY rebounded from the previous day's decline and moved steadily to reach 143.97 yen.
Meanwhile, as expected, the European Central Bank (ECB) decided to lower the interest rate by 0.25%. However, ECB President Christine Lagarde insisted that the current cycle of rate cuts would soon come to an end. Traders responded to her comment by buying the euro, as the EURUSD rose to the 1.149 range. The pound also strengthened, and the GBPUSD rose to the 1.361 range during daily trading hours.
June 6 (Fri)
The slightly better-than-expected U.S. employment figures for May caused an increase in the U.S. long-term interest rate. Accordingly, the dollar was bought, and the USDJPY temporarily recovered to the 145 yen range. Conversely, after the release of these figures, the EURUSD was pushed back to the 1.137 range. The pound also weakened against the dollar, but the GBPUSD managed to stay within the 1.35 range.
Economic Indicators and Statements to Watch this Week
(All times are in GMT)
June 8 (Sun)
- 23:50 Japan: January-March Quarterly Gross Domestic Product (revised GDP)
June 11 (Wed)
- 12:30 U.S.: May Consumer Price Index (CPI)
- 12:30 U.S.: May Consumer Price Index (CPI Core Index)
June 12 (Thu)
- 06:00 U.K.: April Monthly Gross Domestic Product (GDP)
This Week's Forecast
The following currency pair charts are analyzed using an overlay of the ±1σ and ±2σ standard deviation Bollinger Bands, with a 20-period moving average.
USDJPY
Amid growing uncertainty over the Trump administration's policy management, the market is still hopeful about the progress of U.S.-China trade talks. If the May CPI shows the robustness of the U.S. economy, FRB will again turn to be hesitate to resume rate cuts, strengthening the momentum of dollar buying.
Next is an analysis of the USDJPY daily chart.
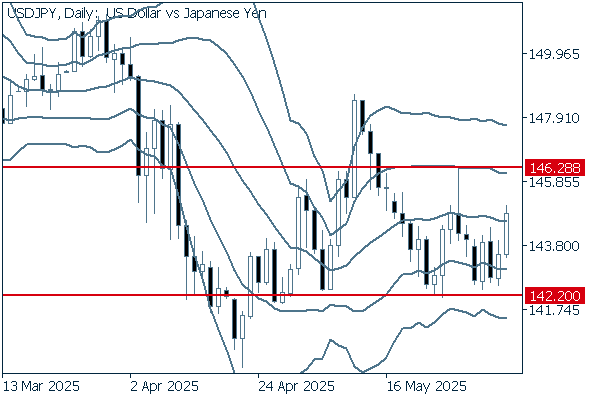
The pair has been trending sideways with a current support line located around 142.20 yen. However, growing buying pressure pushed the pair above the middle line last week. The pair is likely to target the recent high of around 146.28 yen.
We continue with an analysis of the USDJPY weekly chart.
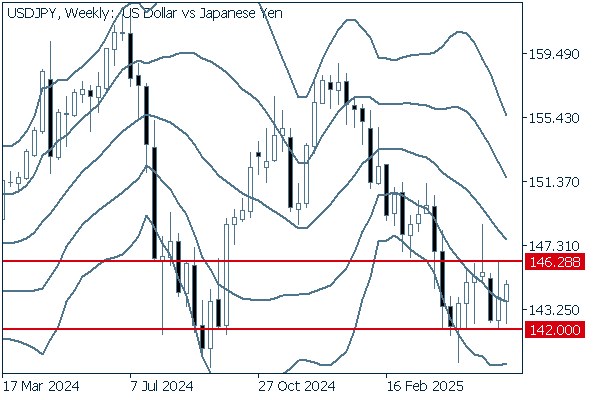
While the middle line maintains the downtrend, the pair stays above the support line lying at the 142.0 yen level. Also, the latest positive candlestick has a long lower wick, which indicates the strength of the upward momentum. If the pair breaks above the 146.28 yen level, it will be able to test the 148 yen level.
EURUSD
Although the ECB decided to lower the interest rate by 0.25%, President Lagarde insisted that the series of rate cuts will soon come to an end. This comment will further encourage traders to buy the euro.
Next is an analysis of the EURUSD daily chart.
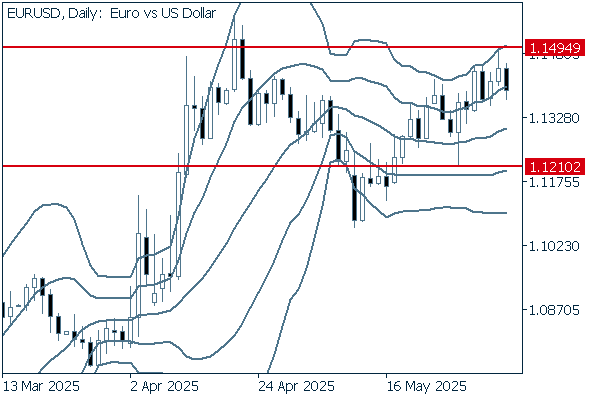
While the middle line is gently rising, the candlesticks form an upward band walk around +2σ. These factors present a good opportunity for dip buyers. If the pair breaks above the recent high of 1.149, the uptrend will likely continue.
We continue with an analysis of the EURUSD weekly chart.
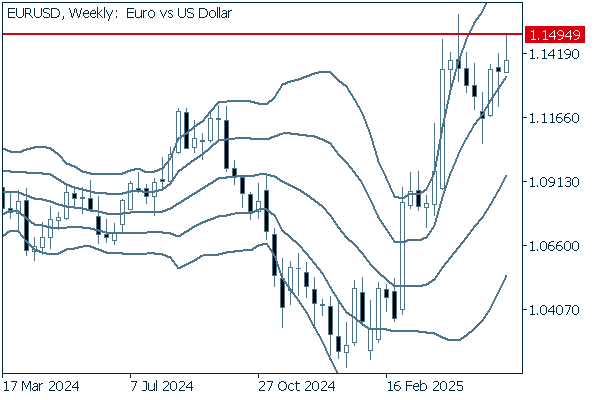
Falling below +1σ provided a good opportunity for dip buyers, and the pair re-entered an uptrend. However, the latest positive candlestick has a long upper wick, which indicates growing selling pressure. Nevertheless, it is safe to say that the pair will likely continue its upward trend.
GBPUSD
Amid uncertainty over the Trump administration's management of policy, including the implementation of tariff policies, traders have become more inclined to sell the dollar. While the pound keeps strengthening against the dollar, the GBPUSD has been affected by the headlines. The market is focusing on the U.S. CPI, due to be released on June 11th.
Next is an analysis of the GBPUSD daily chart.
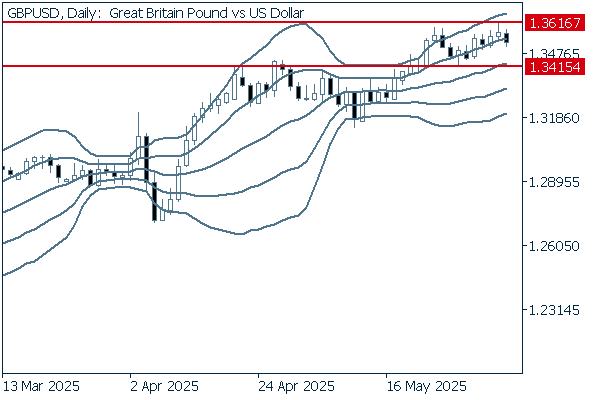
The pair continues to fluctuate between +1σ and +2σ as the upward band walk is formed on the daily chart. Although it entered a corrective phase after hitting a new high, the upward trend is likely to continue as long as it remains above the support line lying around 1.3415.
We continue with an analysis of the GBPUSD weekly chart.
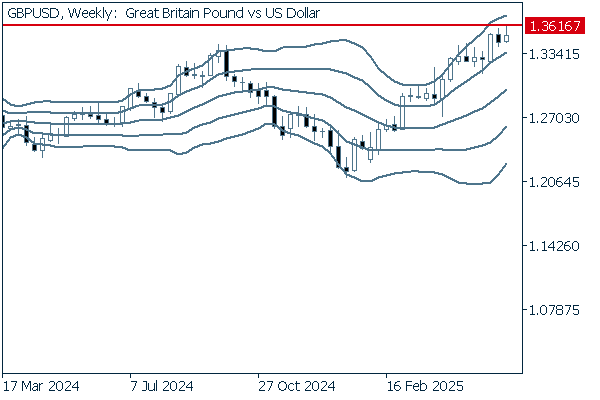
After touching -2σ, the pair rebounded and has remained in an uptrend since then. It has broken the past week's high without falling below the low from past weeks. Although the recent candlesticks have upper wicks, which indicate growing selling pressure, it is safe to say the uptrend will likely continue.
Don't miss trade opportunities with a 99.9% execution rate
Was this article helpful?
0 out of 0 people found this article helpful.
Thank you for your feedback.
Send