


2025.06.02
This article was :
published
updated
Weekly FX Market Review and Key Points for the Week Ahead
The development of the Trump tariffs dominated the foreign exchange market for the week that ended on June 1st. The USDJPY reached the 146 yen range but was later pushed back to the 143 yen range to close the weekly trading session. Both EURUSD and GBPUSD followed the dollar's behavior but were slightly sensitive to caution over political risk.
May 26 (Mon)
President Donald Trump announced that the U.S. would postpone the imposition of a 50% tariff on products imported from the E.U. until July 9th. However, this announcement increased uncertainty surrounding the tariff talks, causing the yen to strengthen against the dollar. The USDJPY fell to the 142.2 yen range during the daily trading session.
Following this behavior of the dollar, the EURUSD advanced to the 1.141 range before being pushed down. The GBPUSD also sagged after advancing to the 1.359 range.
May 27 (Tue)
Amid concerns over the U.S. government budget deficit, the USDJPY fell to around 142.10 yen. However, the pair then rebounded, rising to the 144.4 yen range, as the Japanese long-term bond yield plummeted.
In the meantime, the euro continued to weaken against the dollar, and the EURUSD fell to the 1.132 range. Also, the GBPUSD sagged to the 1.350 range after reaching the 1.358 range.
May 28 (Wed)
The USDJPY fluctuated wildly following statements from Kazuo Ueda, the governor of the Bank of Japan (BOJ), and John Williams, the president of the New York Federal Reserve. However, after President Trump announced the postponement of the tariff hike on imports from the E.U., the pair reached the 145 yen range.
Both the EURUSD and GBPUSD experienced sell-offs on the rally, with the former falling to the 1.128 range and the latter dropping to the 1.344 range.
May 29 (Thu)
The U.S. Court of International Trade (C.I.T.) ordered the Trump administration to suspend part of the Trump tariffs. This ruling eased market concerns about the trade wars and prompted traders to buy the dollar. As a result, the USDJPY jumped to 146.28 yen. However, the pair was pushed back down to 143.9 yen after the administration appealed the C.I.T. ruling to a federal appeals court and a weaker U.S. economic index was released.
Meanwhile, the EURUSD rose back to the 1.138 range, and the GBPUSD recovered to the 1.35 range.
May 30 (Fri)
Traders took a risk-off stance and bought the yen after media reports that the Trump administration was preparing a "Plan B" for the Liberation Day tariffs, which the C.I.T. had ruled illegal. Additionally, the strong Tokyo area CPI further weakened the dollar against the yen. The USDJPY fell to the 143.4 yen range before rebounding. The pair concluded the weekly trading session by hovering around the 144 yen level.
The euro weakened against the dollar as the EURUSD fell to the 1.134 range. Likewise, the GBPUSD fell to the 1.345 range.
Economic Indicators and Statements to Watch this Week
(All times are in GMT)
June 2 (Mon)
- 14:00 U.S.: May ISM Manufacturing PMI
- 17:00 U.S.: Statement by Federal Reserve Board (FRB) Chair Jerome H. Powell
June 3 (Tue)
- 09:00 Europe: May Harmonised Index of Consumer Prices (preliminary HICP)
- 09:00 Europe: May Harmonised Index of Consumer Prices (preliminary HICP core index)
June 4 (Wed)
- 12:15 U.S.: May ADP National Employment Report
- 14:00 U.S.: May ISM Non-Manufacturing PMI (composite)
June 5 (Thu)
- 12:15 Europe: European Central Bank (ECB) Governing Council policy interest rate announcement
- 12:15 Europe: Regular press conference by ECB President Christine Lagarde
June 6 (Fri)
- 09:00 Europe: January-March quarterly regional gross domestic product (revised regional GDP)
- 12:30 U.S.: May change in nonfarm payrolls
- 12:30 U.S.: May unemployment rate
- 12:30 U.S.: May average hourly earnings
This Week's Forecast
The following currency pair charts are analyzed using an overlay of the ±1σ and ±2σ standard deviation Bollinger Bands, with a 20-period moving average.
USDJPY
While the C.I.T. had ruled the Trump tariffs illegal, the Trump administration challenged the ruling. The market will be sensitive to the outcome of the court battle. Additionally, persistent concerns about a potential triple sell-off of bonds, stocks, and the dollar seem to be preventing traders from taking a risk-on stance and buying the dollar.
Next is an analysis of the USDJPY daily chart.
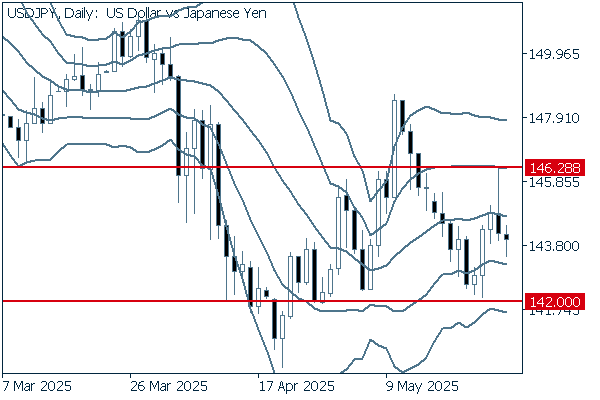
There is no clear direction yet, but it seems that the pair is trending downward from 146.28 yen. Meanwhile, the pair has experienced several rebounds at around 142 yen. If it falls below this level, it will likely drop to 140 yen.
We continue with an analysis of the USDJPY weekly chart.
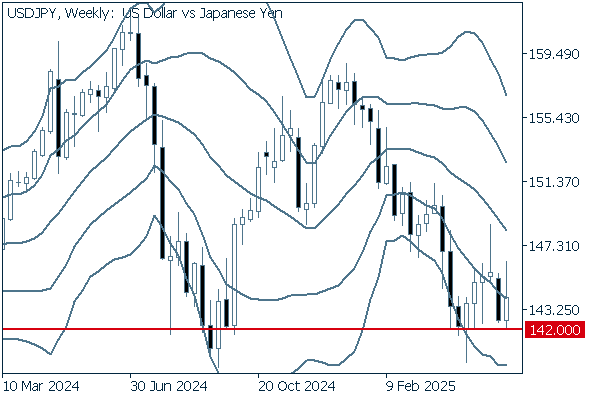
On the weekly chart, the pair had edged toward the middle line before being pushed down again. Even the most recent positive candlestick indicates strong selling pressure. It will be important to see whether the pair falls below 142 yen to conclude the weekly trading session.
EURUSD
The ECB is expected to cut its key policy interest rate by 0.25% at the Governing Council meeting on June 5th. However, some council members are reluctant to make additional rate cuts. The uncertainty surrounding U.S. tariff policy will likely contribute to a weaker dollar, which will put upward pressure on the EURUSD.
Next is an analysis of the EURUSD daily chart.
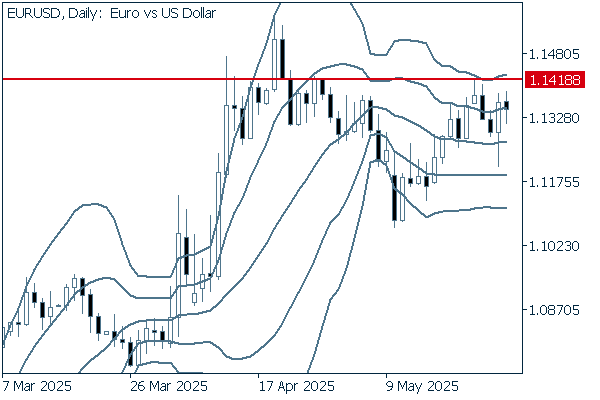
The daily chart shows that the pair has experienced rebounds when falling below the middle line. Currently, it is hovering in the stratosphere. If it breaks above the current resistance level lying at 1.1418, it may rise toward 1.15.
We continue with an analysis of the EURUSD weekly chart.
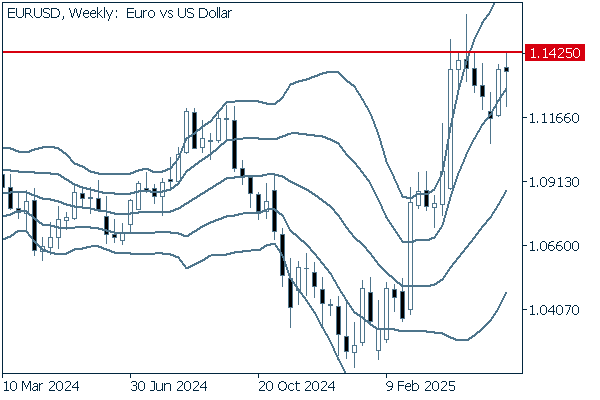
The pair broke above +2σ then fell back into the bandwidth. However, it is now attempting to move higher again after finding a bottom. If it clearly breaks above the recent high of 1.1425, it will likely signal a continuation of the uptrend.
GBPUSD
The C.I.T. ruling and the resulting controversy in the U.S. are expected to trigger a sell-off of the dollar as uncertainty mounts. Meanwhile, solid British economic indicators and the BOE's cautious stance on interest rate cuts are likely to strengthen the pound.
Next is an analysis of the GBPUSD daily chart.
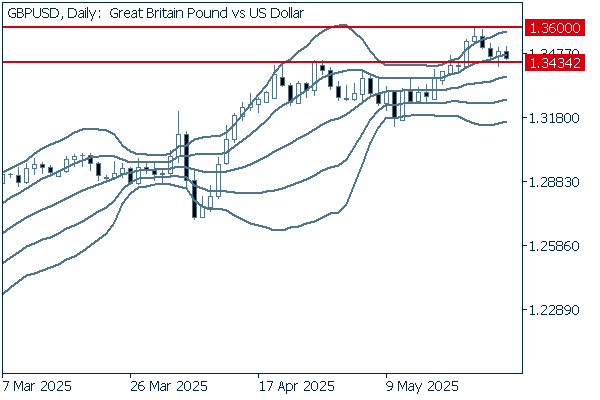
The pair continues to hover above the middle line. A dip below +1σ indicates a potential buying opportunity. If the pair clearly breaks below 1.3434, it will likely decline to the level of the middle line. However, it is safe to say that the uptrend will likely continue.
We continue with an analysis of the GBPUSD weekly chart.
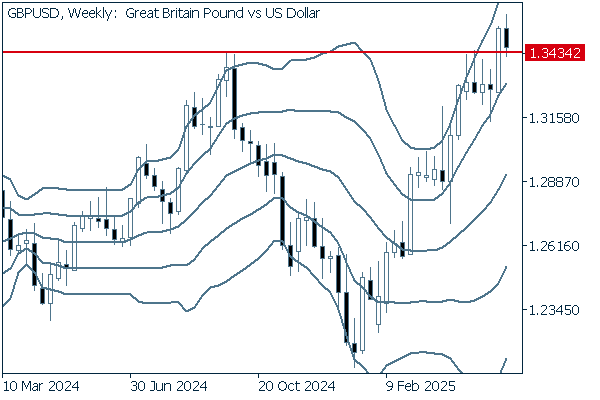
The pair is rising along the upward band walk. The line lying at 1.3434, the yearly high in 2024 and formerly a resistance line, is now seen as a support line. Unless the pair clearly breaks below this line, it is safe to assume that the uptrend will continue.
Don't miss trade opportunities with a 99.9% execution rate
Was this article helpful?
0 out of 0 people found this article helpful.
Thank you for your feedback.
Send