


2025.04.07
This article was :
published
updated
Weekly FX Market Review and Key Points for the Week Ahead
Following the Trump administration's "reciprocal tariffs" policy, traders reinforced their risk-off stance to sell the dollar and buy the yen in the foreign exchange market of the week that ended on April 6th. The announcement of countermeasures by the Chinese government on April 4th, in particular, added to the market's uncertainty.
March 31 (Mon)
The weekly session in the foreign exchange market started with reports of U.S. President Donald Trump's proposed "reciprocal tariffs" policy. As risk-off traders bought the yen, the USDJPY slid to the 148.7 yen range during Tokyo hours. The pair later rebounded to the 150.2 yen range.
The EURUSD climbed to the middle of the 1.08 range but then fell back to the upper 1.07 range. The GBPUSD briefly dropped below the 1.29 level.
April 1 (Tue)
The continued risk-off stance weakened the dollar against the yen as concerns over the Trump tariffs persisted. The market widely shared the view that his tariff policy could intensify inflationary pressures and dampen consumption and investment sentiment. The USDJPY crossed below the 149 yen level and fell to the 148.9 yen range.
The EURUSD fluctuated around the 1.08 level. The GBPUSD stayed flat at the lower 1.29 level.
April 2 (Wed)
Earlier in the day, the market cautiously awaited President Trump's announcement on tariffs. After the announcement at 20:00 GMT, traders reinforced their risk-off sentiment as they grew more cautious about the possible reactions and countermeasures from other countries.
The USDJPY plunged from the 150.4 yen range to the 148.6 yen range within an hour before the market close. The EURUSD briefly broke above the 1.09 level, and the GBPUSD briefly crossed above the 1.30 level.
April 3 (Thu)
Risk-off sentiment lingered in the market amid reports of the Trump tariffs and the growing awareness that the policy would have a negative impact on the global economy. The USDJPY fell more than five yen from the previous day's high to the 145.1 yen range during the trading session.
The dollar weakened against the euro and pound as well. The EURUSD reached the 1.11 range, approaching a yearly high. The GBPUSD also temporarily entered the 1.32 range.
April 4 (Fri)
Beijing announced that it would impose an additional 34% tariff on all imports from the U.S. and indicated that it would restrict exports of rare earths. These retaliatory measures intensified traders' risk-off sentiment. The USDJPY fell to the 144.5 yen range. Later, traders' buyback of the dollar lifted the pair back to the lower 147 yen range.
This buyback trend pushed the EURUSD down to the lower 1.09 range and the GBPUSD down to around 1.285, respectively.
Economic Indicators and Statements to Watch this Week
(All times are in GMT)
April 9 (Wed)
- 18:00 U.S.: Minutes of the Federal Open Market Committee (FOMC)
April 10 (Thu)
- 12:30 U.S.: March Consumer Price Index(CPI)
- 12:30 U.S.: March Consumer Price Index(CPI core index)
April 11 (Fri)
- 06:00 U.K.: March monthly gross domestic product (GDP, month-on-month data)
This Week's Forecast
The following currency pair charts are analyzed using an overlay of the ±1σ and ±2σ standard deviation Bollinger Bands, with a 20-period moving average.
USDJPY
After falling as low as the middle of the 144 yen range, the USDJPY rebounded to the 147 yen range as traders bought back the dollar. The U.S. CPI figures due out on April 10th will determine whether the pair bottoms out around the 145 yen level or falls further.
Next is an analysis of the USDJPY daily chart.
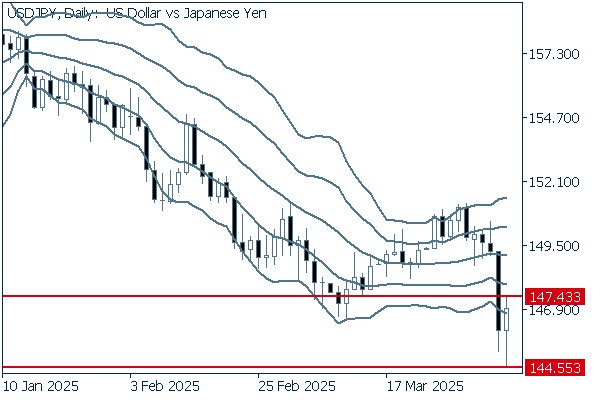
After the pair nosedived and broke below the 145 yen level, the dollar's temporary buyback lifted the pair back into the range of the Bollinger Bands. Although a short-term rebound seems likely, it is safe to say that the downtrend will continue. The next possible support level is around 140 yen.
We continue with an analysis of the USDJPY weekly chart.
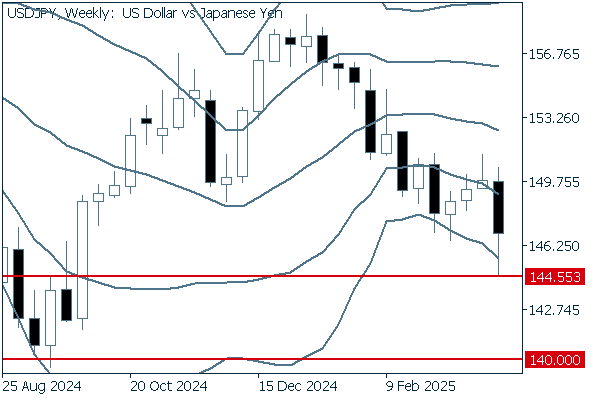
On the weekly chart, the pair broke below the 145 yen level, which is the monthly low for March and a recent key support level. Although the longer lower wick of the latest candlestick indicates that traders bought back the dollar to some extent last week, it is safe to say that the downtrend will continue. The next support level is likely to be around 140 yen, the level seen in September last year.
EURUSD
The previous week saw the EURUSD surge to the 1.10 range before undergoing a correction. Although the Trump tariffs undermine the confidence in the dollar, the U.S. CPI figures, which are scheduled to be released on April 10, may strengthen the dollar.
Next is an analysis of the EURUSD daily chart.
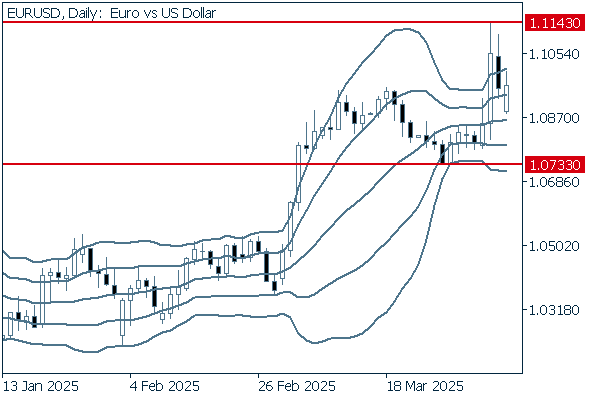
After briefly breaking above the upper limit of the Bollinger Bands, the pair returned within the band range. If the real body of a daily candlestick shows that the pair breaks below the 1.0733 level, there is a possibility that the downtrend will strengthen. Overall, however, it can be seen that the pair is in the process of offering a buying opportunity in the midst of the uptrend. Therefore, it would be better to consider going long on the euro.
We continue with an analysis of the EURUSD weekly chart.
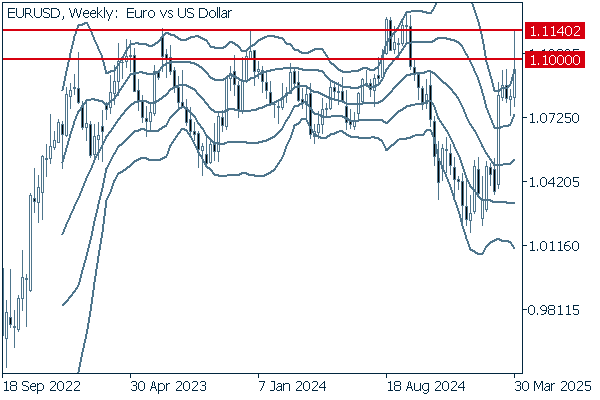
On the weekly chart, the pair is approaching the upper limit of the long-term box-shaped range formed by the fluctuations since late 2022. However, the pair may face a short-term downtrend or correction phase. In this case, it is important to see if the pair offers a buying opportunity on a pullback.
GBPUSD
The GPBUSD plunged on Friday, erasing the surge from earlier in the week, as traders bought back the dollar. It should be noted that the pair was more affected by this buyback than the EURUSD. The dollar's behavior will continue to dominate the GPBUSD.
Now, we analyze the daily GBPUSD chart.
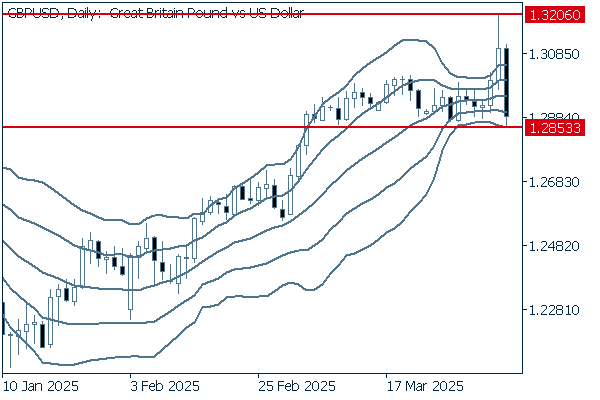
In the previous week, the surging GBPUSD temporarily broke above the upper limit of the band range. However, the pair then plummeted and touched the lower limit of the band range on April 4th. Unless the pair crosses below the 1.2853 level, it is good to see that the uptrend will continue as the pair may hit the new high.
We continue with an analysis of the GBPUSD weekly chart.

The pair had rallied since it bottomed out in December last year. However, the pair faced increasing selling pressure as it neared the upper limit of the band range. If it rebounds and a fresh positive candlestick appears on the weekly chart, the pair may break above the 1.3206 level and climb higher.
Was this article helpful?
0 out of 0 people found this article helpful.
Thank you for your feedback.
Send