


2025.04.14
This article was :
published
updated
Weekly FX Market Review and Key Points for the Week Ahead
In the foreign exchange market for the week that ended on April 13th, the Trump administration's tariff policy threw the entire market into turmoil. While traders were very nervous about the tariff news, the dollar weakened against other major currencies. The simultaneous sell-off in stocks, bonds, and the dollar reinforced the risk-off sentiment.
April 7 (Mon)
Traders bought the yen on growing concerns about a global trade war. The USDJPY touched the 144.8 yen range. Later, some buying of the dollar pushed the pair up to the 148.1 yen range.
The EURUSD once touched the 1.105 range but fluctuated in the upper 1.09 range throughout the day. The GBPUSD temporarily reached the 1.293 range. However, the continued downtrend pushed the pair down to the 1.271 range.
April 8 (Tue)
Ahead of the launch of the Trump tariffs, traders focused on gauging the impact of the tariffs on the U.S. economy and took the risk-off stance to buy the yen. The dollar weakened against the yen throughout the day as the USDJPY broke below the 146 yen level during the trading hours.
The EURUSD hovered in the upper 1.09 range while the GBPUSD paused its decline and rebounded to the 1.28 range during the trading hours.
April 9 (Wed)
As the U.S. officially introduced reciprocal tariffs, the USDJPY continued to fall, reaching the 143.9 yen range. However, during New York trading hours, U.S. President Donald Trump announced a 90-day pause on some tariffs. This news triggered massive dollar buying, and the pair spiked to 148.27 yen.
The EURUSD steadily climbed to the 1.109 range. However, the above news pushed the pair down to the lower 1.09 range. The GBPUSD saw volatile movements but mostly hovered in the 1.28 range.
April 10 (Thu)
Amidst the lingering market volatility, the market became increasingly concerned about capital outflows from the U.S. Moreover, some traders adjusted their positions after the USDJPY's sharp rise the previous day. As a result, the pair offset its gains and fell as low as the 144.0 yen range.
Meanwhile, the EURUSD surged to the 1.12 range, and the GBPUSD also moved steadily, approaching the 1.30 level.
April 11 (Fri)
The continued exchange of retaliatory tariffs between the U.S. and China intensified the global trade war and increased uncertainty. Traders sold the dollar and pushed the USDJPY down to the 142.0 yen range. However, the pair hit a bottom there and rebounded to the 144 yen range.
The weakening dollar lifted the EURUSD to near the 1.15 level. The GBPUSD also rose above the 1.30 level and approached the previous week's high.
Economic Indicators and Statements to Watch this Week
(All times are in GMT)
April 16 (Wed)
- 09:00 Europe: March Harmonised Index of Consumer Prices (revised HICP)
- 09:00 Europe: March Harmonised Index of Consumer Prices (revised HICP core index)
- 12:30 U.S.: March retail sales
- 12:30 U.S.: March retail sales (excluding automotive)
- 17:30 U.S.: Speech by Federal Reserve Chairman Jerome Powell
April 17 (Thu)
- 12:15 Europe: European Central Bank (ECB) Governing Council policy interest rate announcement
- 12:45 Europe: Regular press conference by ECB President Christine Lagarde
- 23:30 Japan: March Consumer Price Index (CPI, all items, year-on-year data)
- 23:30 Japan: March Consumer Price Index (CPI, all items less fresh food)
- 23:30 Japan: March Consumer Price Index (CPI, all items less fresh food and energy)
This Week's Forecast
The following currency pair charts are analyzed using an overlay of the ±1σ and ±2σ standard deviation Bollinger Bands, with a 20-period moving average.
USDJPY
Growing concerns about the global trade war make the market highly volatile. Moreover, investors are shifting their dollar assets to other currencies. As the USDJPY almost broke below the 142 yen level last week, it would be good to think that the pair could fall as low as 140 yen.
Next is an analysis of the USDJPY daily chart.
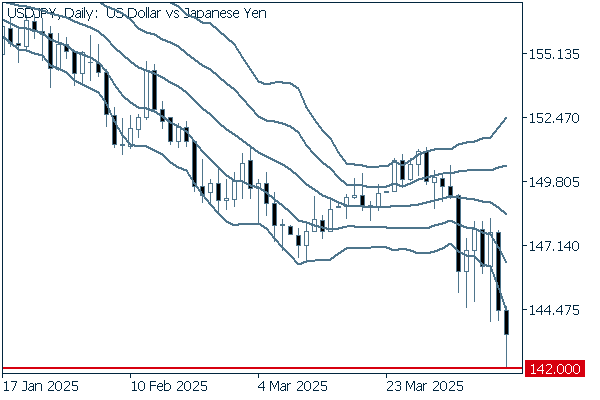
The daily chart shows a clear and continuing downtrend for the pair, which approached the 142.0 yen level last Friday. If the pair breaks clearly below this support level, it would be good to think that the pair could fall as low as around the 140 yen level, the monthly low of September 2024.
We continue with an analysis of the USDJPY weekly chart.
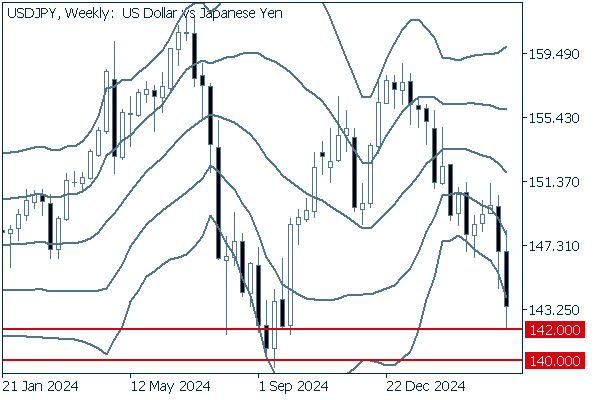
As with the daily chart, the weekly chart shows a clear and continuing downtrend as the pair approached the watershed line of 142.0 yen last week. If the pair clearly breaks below this support level, the pair will likely fall as low as 140 yen. Furthermore, it would be good to keep in mind that the stronger downward momentum could push the pair below the 140 yen level.
EURUSD
Accelerating dollar selling helped the EURUSD reach a three-year high. Meanwhile, the ECB is expected to announce a 0.25% interest rate cut at its Governing Council on April 17th.
Next is an analysis of the EURUSD daily chart.
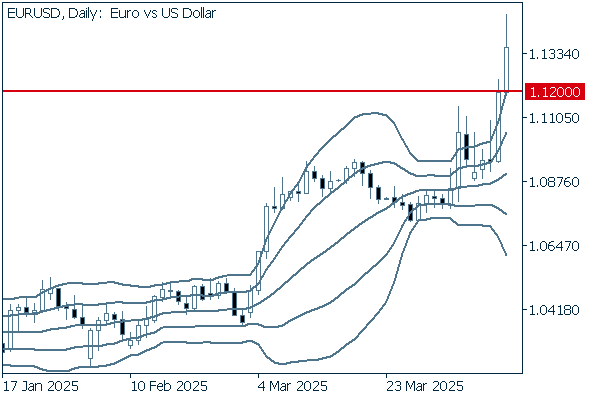
The daily chart definitely shows that the pair broke above the 1.12 level last week, which is the upper limit of the range formed by the fluctuation since 2022. Moreover, the upward band walk contributes to the continuation of the pair's uptrend. Even if the pair enters a short-term corrective phase, it would be good to buy the dip as the current uptrend will not be hampered.
We continue with an analysis of the EURUSD weekly chart.
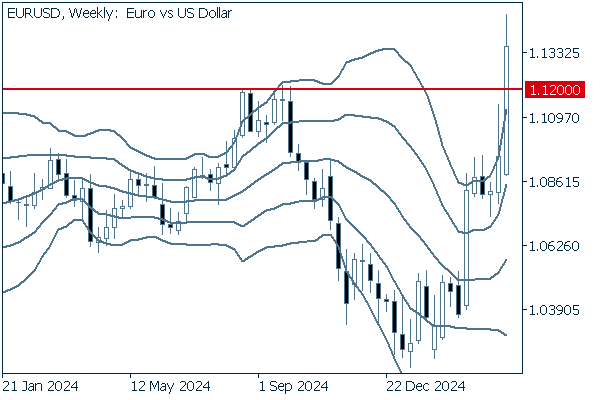
As with the daily chart, the weekly chart suggests that the pair has just entered the phase of the uptrend. In particular, the pair has definitely broken above the 1.12 level, turning the resistance line into a fresh support line. Even if the pair enters a short-term corrective phase to be pushed lower, it is safe to assume that the uptrend will continue as a whole.
GBPUSD
Following stronger-than-expected U.K. monthly GDP for February, the outlook for the country's economy is split. Some are pointing to the possibility that the economy can keep growing. Meanwhile, others are predicting that it is less likely that it can continue to grow at the current pace due to the potential increase in the trade deficit and uncertainty, both of which will be caused by the Trump tariffs. The volatile behavior of the dollar will continue to dominate the GBPUSD.
Now, we analyze the daily GBPUSD chart.
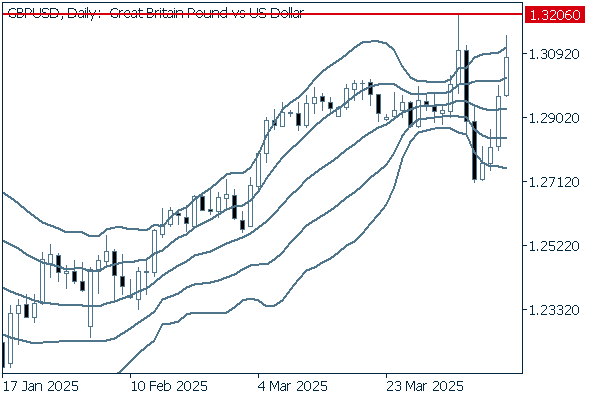
As consecutive sharp declines offered traders an opportunity to buy the dip, it seems that the pair is about to re-enter the uptrend phase. Currently, the resistance line lies around the 1.3206 level, the weekly high of the week of March 31st. If the pair breaks above the line, the uptrend will likely continue.
We continue with an analysis of the GBPUSD weekly chart.
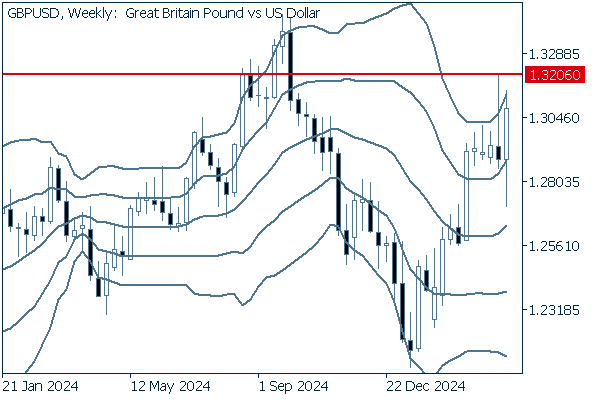
The weekly chart also suggests that the pair is about to re-enter the mid-term uptrend phase. For now, it is important to focus on whether the pair can break above the resistance line at 1.3206 in order for the pair to continue to rally. As the pair is approaching the upper border of the Bollinger Bands, it may enter a corrective phase. However, it is safe to say that, basically, the uptrend will continue.
Was this article helpful?
0 out of 0 people found this article helpful.
Thank you for your feedback.
Send