


2025.03.31
This article was :
published
updated
Weekly FX Market Review and Key Points for the Week Ahead
In the foreign exchange market for the week ending on March 30th, the USDJPY edged up to cross above the 151 yen level before dipping below the 150 yen level to close the weekly trading session. Traders are increasingly concerned about the U.S. trade policy as President Donald Trump is set to impose reciprocal tariffs on April 2nd. Meanwhile, the market has experienced a conflicting mood between the U.S.'s reconciliatory stance towards China and its confrontational stance towards the EU and Canada. As a result, the euro and the pound weakened against the dollar.
March 24 (Mon)
The USDJPY started the weekly trading session by rising to the 150.7 yen range after the better results of the U.S. flash services PMI for March. On the other hand, concerns over stagnant German economic growth and Trump's tariff policy weighed down the EURUSD, which fell to the 1.07 range during the trading hours. The GBPUSD also fell sharply from the 1.297 range, briefly breaking below the 1.29 level.
March 25 (Tue)
The USDJPY approached the 151 yen level but then plummeted to the 149.8 yen range during trading hours. As the dollar's upward momentum slowed, so did the EURUSD's downward momentum. Nevertheless, traders were less inclined to buy back the euro. The EURUSD hovered around the 1.08 level. The GBPUSD rebounded to the 1.296 range.
March 26 (Wed)
Uncertainty lingered over the impact of the trade dispute on the economy, as well as the fiscal policy of the Federal Reserve Board (FRB). The dollar strengthened slightly against the yen during Tokyo trading hours as the USDJPY entered the 150 yen range. However, it failed to extend the rally above the 150.7 yen range.
After hovering around the 1.08 level, the EURUSD fell to the 1.075 range as traders started to sell the euro during the New York trading hours. Meanwhile, the weak U.K. CPI for February increased traders' expectations for further interest rate cuts by the Bank of England (BoE). As a result, the GBPUSD fell to the 1.28 range.
March 27 (Thu)
President Trump announced that the U.S. would impose a 25% tariff on imported automobiles. Subsequently, the dollar weakened against the yen as the USDJPY fell to around the 150.06 yen level. However, as the market's caution began to fade, the pair rebounded to the 151.1 yen range during New York trading hours.
The weakening dollar also affected the EURUSD and GBPUSD. The former erased the previous day's decline to reach 1.082. The latter followed suit, rebounding from the previous day's decline to extend the rally to the 1.299 range.
March 28 (Fri)
After the USDJPY touched the 151.2 yen range, caution over the Trump administration's automobile tariffs triggered the yen buying. The pair plummeted to the 149.6 yen range in New York trading hours.
Following the wild fluctuations in the dollar, the EURUSD fell to the 1.077 range before rebounding to the 1.08 range. Meanwhile, the GBPUSD closed the weekly trading session with small fluctuations around the 1.295 level.
Economic Indicators and Statements to Watch this Week
(All times are in GMT)
March 31 (Mon)
- 23:50 Japan: Bank of Japan January-March Short-Term Economic Survey of Enterprises (Tankan)
April 1 (Tue)
- 09:00 Europe: March Harmonised Index of Consumer Prices (preliminary HICP)
- 09:00 Europe: March Harmonised Index of Consumer Prices (preliminary HICP core index)
- 14:00 U.S.: March ISM Manufacturing PMI
April 2 (Wed)
- 13:15 U.S.: March ADP Employment Report
April 3 (Thu)
- 11:30 Europe: European Central Bank (ECB) Governing Council meeting minutes
- 14:00 U.S.: March ISM Non-Manufacturing PMI (composite)
April 4 (Fri)
- 12:30 U.S.: March change in nonfarm payrolls
- 12:30 U.S.: March unemployment rate
- 12:30 U.S.: March average hourly earnings
- 15:25 U.S.: Press conference by Federal Reserve Chairman Jerome Powell
This Week's Forecast
The following currency pair charts are analyzed using an overlay of the ±1σ and ±2σ standard deviation Bollinger Bands, with a 20-period moving average.
USDJPY
Uncertainty lingers over the Trump administration's tariff policy. Although the USDJPY has been edging upward, the pair has been pushed lower after reaching a high. This week, traders will be focusing on the U.S. employment figures and other economic indicators.
Next is an analysis of the USDJPY daily chart.
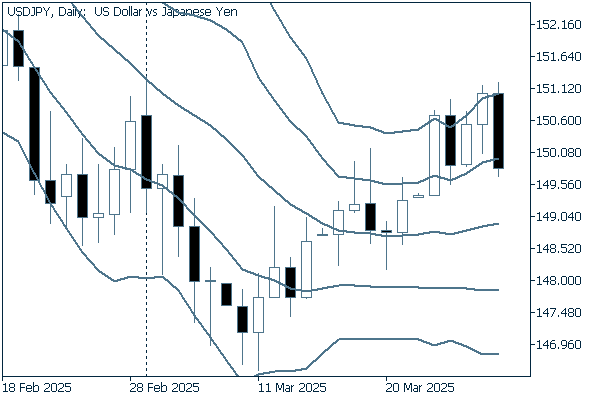
The flattened middle line has just turned upward, indicating that the pair has entered a moderate uptrend phase. If the pair breaks above the recent high of 151.30 yen, it is likely to move higher, with a target of 155 yen.
We continue with an analysis of the USDJPY weekly chart.
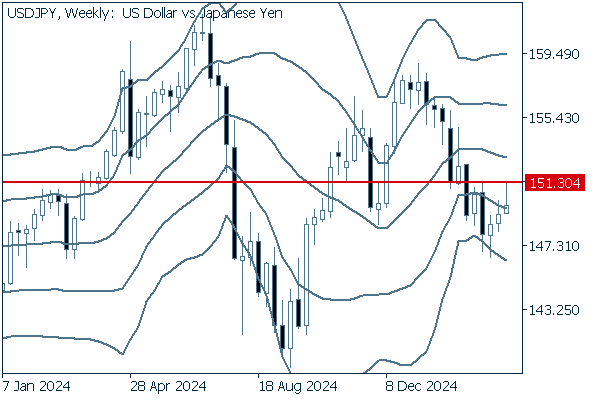
On the weekly chart, three consecutive positive candlesticks have appeared. However, the latest candlestick has a long upper wick, suggesting that this uptrend is capped by strong selling pressure. If the pair fails to break above the recent high of 151.30 yen, it may fall back to the 147 yen level.
EURUSD
On April 2nd, the Trump administration will impose a 25% tariff on imported automobiles. If Europe announces countermeasures, it is possible that increased fears over the tariff conflict could strengthen the dollar against the euro.
Next is an analysis of the EURUSD daily chart.
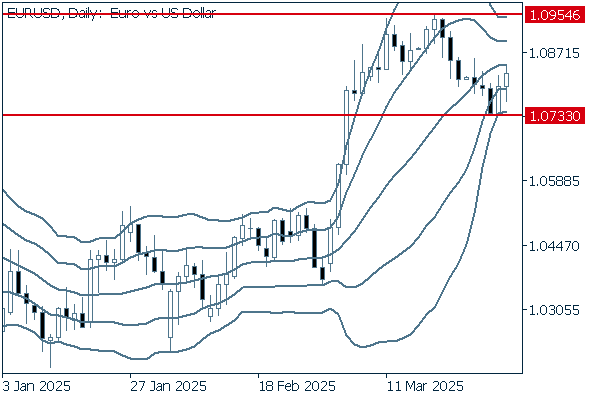
After a period of sharp upward movement, traders' adjustment of positions had pushed the pair lower. However, the pair showed a rebound late in the previous week. Unless the pair breaks below the recent low of 1.0733, it is safe to say that the uptrend is likely to continue. Furthermore, if the pair breaks above the middle line, its upward momentum will accelerate.
We continue with an analysis of the EURUSD weekly chart.
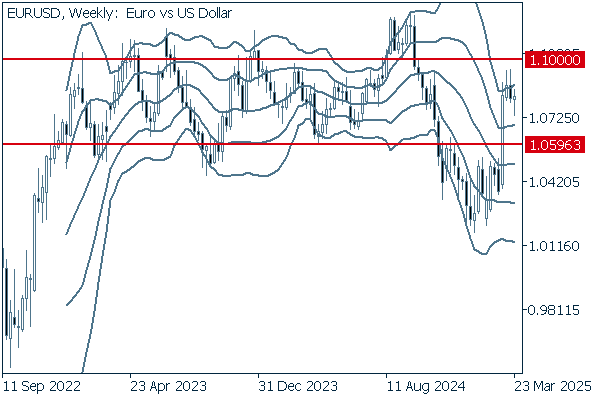
In the long term, the pair has been fluctuating within the box-shaped range formed by the fluctuations since late 2022, between 1.0596 and 1.10. It is difficult to say whether the pair will head towards the resistance line located around 1.10 or back towards 1.0596, the support line and the annual low of 2023. The weekly chart shows that the most recent positive candlestick has a long lower wick, indicating that the pair can be considered in a recovery phase. The bottom line is that the pair is likely to continue to rise.
GBPUSD
It is expected that the U.S. employment figures for March, to be released on April 4th, will show a slowing of the employment conditions. If negative results lead to increased speculation that the FRB will cut interest rates, the dollar will weaken against the pound. It seems that the dollar's behavior will continue to dominate the GBPUSD.
Now, we analyze the daily GBPUSD chart.
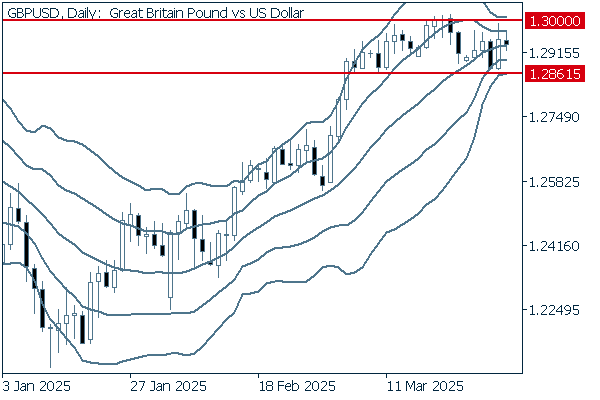
The pair has been fluctuating within a box-shaped range with a resistance line sitting at the 1.30 level, and the width of the Bollinger Bands is narrowing. The longer the consolidation phase continues, the larger the fluctuation will turn once the clear direction is confirmed. It will be best to monitor and follow the direction of the pair.
We continue with an analysis of the GBPUSD weekly chart.
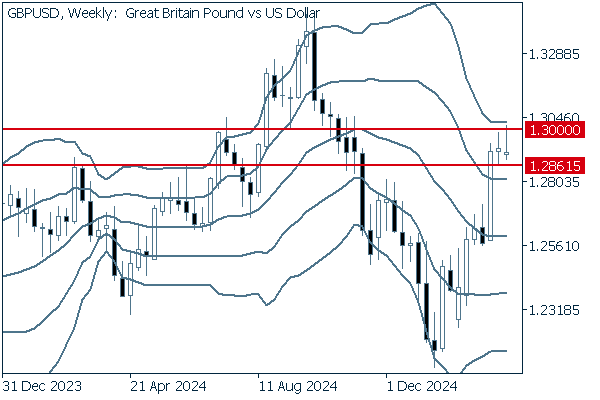
Over the past two weeks, the pair has experienced a small fluctuation. Meanwhile, the most recent positive candlestick has a significant upper wick, indicating that the current fluctuation is capped by strong selling pressure at a higher price. If the pair is pushed back to clearly break below the 1.2861 level, this support line may turn into a resistance line, and the pair may continue to fall.
Was this article helpful?
0 out of 0 people found this article helpful.
Thank you for your feedback.
Send