


2025.02.03
This article was :
published
updated
Weekly FX Market Review and Key Points for the Week Ahead
A mixture of a strong yen and a strong dollar characterized the foreign exchange market for the week that ended on February 2nd. Traders also took a risk-averse stance as the market was concerned about President Donald Trump's comments on tariff policy, as well as news of a new AI model developed by a Chinese startup.
The USDJPY saw a wide and erratic fluctuation between the 156 and 153 yen ranges. The market closely followed the outcome of the Federal Open Market Committee (FOMC) and European Central Bank (ECB) monetary policy announcements. However, they had little impact on the market.
January 27(Mon)
Traders took a risk-averse stance after President Trump announced that he would impose a 25% tariff on imports from Colombia. The yen also strengthened against the dollar on news of a new AI model developed by a Chinese startup. The USDJPY fell sharply from the lower 156 yen range to the upper 153 yen range during the day's session.
The EURUSD hovered around the 1.050 level. The GBPUSD moved steadily around the 1.250 level.
January 28(Tue)
The USDJPY attempted to make up for the previous day's plunge, helped by widespread speculation that the Bank of Japan (BOJ) will hold off on raising interest rates due to concerns over the Trump tariff policy. However, the rally stalled at around the 155.90 yen level and failed to reach 156 yen.
The strengthening dollar pushed the EURUSD down to the lower 1.04 range, and the GBPUSD fell to the lower 1.24 range.
January 29(Wed)
The USDJPY waited for the outcome of the FOMC meeting and traded in the 155 yen range, although it touched 154.90 yen.
The Fed decided to keep interest rates on hold. The predictable outcome did not affect market volatility, as the EURUSD briefly fell below the 1.04 level, and the GBPUSD broke below 1.24.
January 30(Thu)
Traders adjusted their positions to buy the yen ahead of a speech by BOJ Deputy Governor Ryozo Himino. Subsequently, the USDJPY fell to the 153.80 yen level.
Meanwhile, the European Central Bank (ECB) decided to cut interest rates by 0.25%. The EURUSD temporarily rebounded to 1.046 but then fell below 1.04. The GBPUSD hovered within the 1.24 range.
January 31(Fri)
President Trump announced that, effective February 1st, the U.S. would impose a 25% tariff on imports from Mexico and Canada. He also mentioned a plan to impose tariffs on imports from China and the BRICS countries, which prompted traders to become risk-averse.
The USDJPY rebounded after touching 153.90 yen to close the weekly session in the lower 155 yen range. The EURUSD briefly dropped to 1.035, and the GBPUSD also fell to 1.238.
Economic Indicators and Statements to Watch this Week
(All times are in GMT)
February 3(Mon)
- 10:00 Europe: January Harmonised Index of Consumer Prices (preliminary HICP)
- 15:00 U.S.: January ISM Manufacturing PMI
February 5(Wed)
- 13:15 U.S.: January ADP National Employment Report
- 15:00 U.S.: November ISM Non-Manufacturing PMI (composite)
February 6(Thu)
- 12:00 U.K.: Bank of England (BOE) policy interest rate announcement
February 7(Fri)
- 13:30 U.S.: January change in nonfarm payrolls
- 13:30 U.S.: January unemployment rate
- 13:30 U.S.: November average hourly earnings
This Week's Forecast
The following currency pair charts are analyzed using an overlay of the ±1 and ±2 standard deviation Bollinger Bands, with a 20-period moving average.
USDJPY
The Fed decided not to make another interest rate cut on January 29th. However, if the January U.S. employment figures, which will be released on February 7th, show strength in the labor market, the dollar is expected to be bought back. In addition, President Trump's comments seem to affect the market.
Next is an analysis of the USDJPY daily chart.
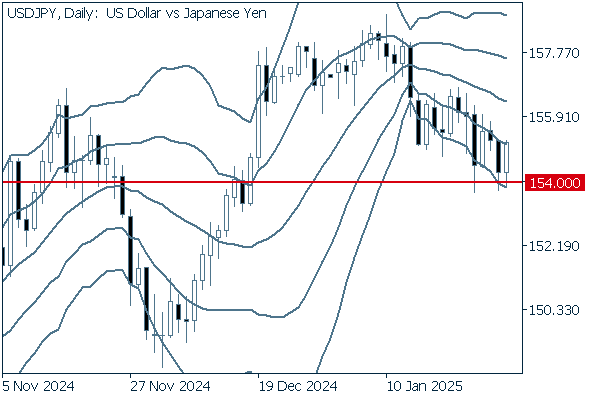
Last week, the pair rebounded after breaking below 154 yen. Meanwhile, its upward momentum is fading. A break below -2σ may accelerate the downward trend.
We continue with an analysis of the USDJPY weekly chart.
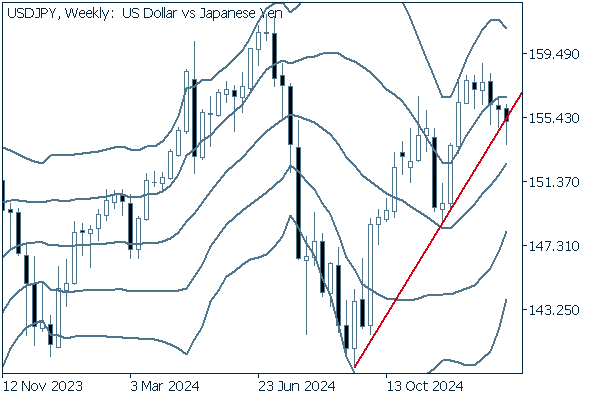
While the middle line is maintaining its upward trend, the pair is about to break below the extended trend line formed by connecting the two previous trend reversal points. It may be high time to start expecting a downward trend.
EURUSD
In the Eurozone, there are no major economic releases this week other than the HICP on February 3rd. It is necessary to watch the behavior of the dollar as important U.S. economic releases await.
Next is an analysis of the EURUSD daily chart.
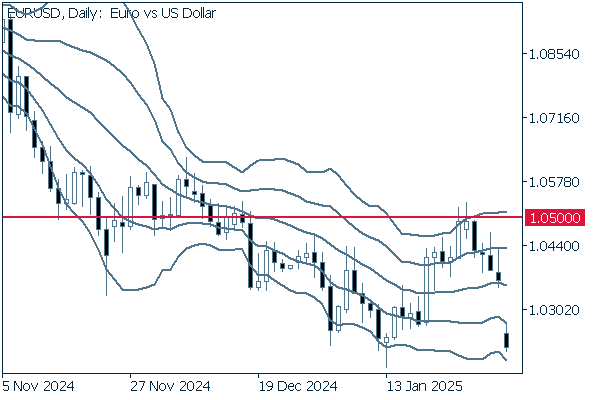
On the daily chart, the pair has fallen since touching +2σ and is about to break clearly below the middle line. Nevertheless, it is still difficult to say that it now has a clear direction. If the pair can rebound to the 1.05 level, it can be said that the pair is forming a box-shaped range. On the other hand, if it breaks clearly below the middle line, the downtrend will gain momentum.
We continue with an analysis of the EURUSD weekly chart.
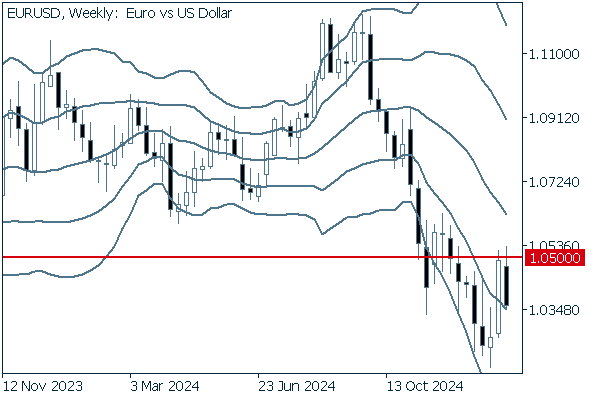
The weekly chart shows a negative candlestick with an upper whisker after two consecutive positive candlesticks. If the pair rebounds but fails to cross above the 1.05 level, this small and short-lived rally could trigger a sharp decline.
GBPUSD
The BOE is expected to announce a 0.25% rate cut on February 6th. If the dollar holds steady, downward pressure could intensify.
Now, we analyze the daily GBPUSD chart.
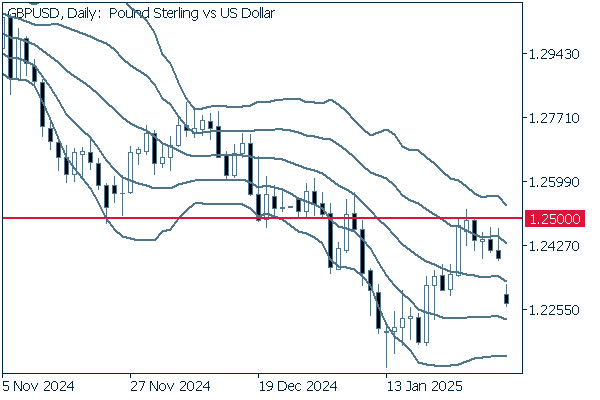
Last week, the pair was pushed back by +1σ and is now approaching the middle line. Although it is difficult to determine the direction, if the pair fails to break above 1.25, the current rally will likely be offset, and the downtrend will strengthen.
We continue with an analysis of the GBPUSD weekly chart.
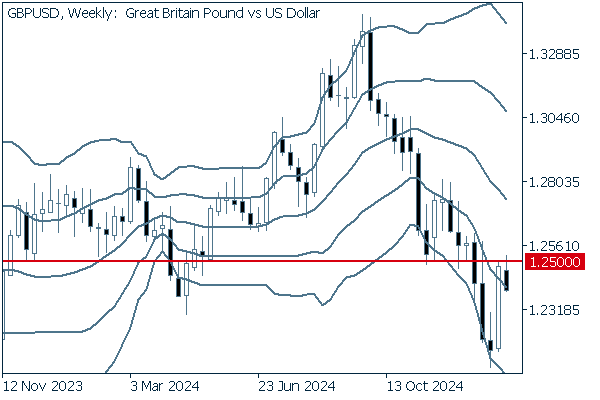
After skyrocketing two weeks ago, the pair formed a negative candlestick with an upper whisker last week. If it breaks above 1.25, the pair could extend its uptrend. However, the downward middle line indicates that the downtrend is likely to continue.
Was this article helpful?
0 out of 0 people found this article helpful.
Thank you for your feedback.
Send