


2025.01.27
This article was :
published
updated
Weekly FX Market Review and Key Points for the Week Ahead
In the foreign exchange market for the week that ended on January 26th, the dollar weakened against the yen, and the opposite also happened. Overall, the selling of the dollar dominated the market.
Despite some major events, the USDJPY lacked direction and fluctuated between the 154 yen and 156 yen ranges. The weakening dollar pushed the EURUSD higher and helped the GBPUSD soar.
January 20 (Mon)
Donald Trump has officially become the President of the United States, and "Trump 2.0" has now begun. Although the USDJPY rose to the upper 156 yen range earlier in the day, it then temporarily fell to 155.40 yen following reports that Trump would not impose tariffs on his first day in office.
The weakening dollar pushed the EURUSD from 1.02 to 1.04 and the GBPUSD from 1.21 to 1.23.
January 21 (Tue)
The USDJPY rose to around 156.20 yen after President Trump announced a plan to impose tariffs on imports from Canada and Mexico starting February 1st. However, the pair fell back to around 154.70 yen as traders turned to a risk aversion stance to buy the yen.
In response to the weakening dollar, the EURUSD temporarily surged to 1.04, while the GBPUSD touched 1.236.
January 22 (Wed)
On day one, President Trump refrained from imposing an additional 10% tariff on Chinese imports. However, he did indicate his intention to impose the tariff on this day. This comment triggered traders to buy the dollar, but the momentum didn't last long as the pair fell back again. The USDJPY eventually rose to the 156.70 yen level in the New York session due to mixed factors such as dollar buybacks, stock market rallies, and the weakening yen.
The EURUSD touched 1.045, and the GBPUSD touched 1.237. However, each pair was unable to maintain its upward momentum throughout the day.
January 23 (Thu)
As fears about the policy risks of the Trump administration eased, stock markets continued to rally. In the foreign exchange market, the dollar weakened against the yen and the opposite was also observed.
After reaching the upper 156 yen range, the USDJPY formed a downtrend for the remainder of the day, falling as low as 155.70 yen. Meanwhile, the EURUSD fell to 1.037 and then rebounded to 1.043. The GBPUSD bottomed out after breaking below 1.23 and then rebounded to around 1.237, the high of the previous day.
January 24 (Fri)
As expected, the Bank of Japan (BOJ) decided to raise its benchmark interest rate by 25 basis points to 0.50%, the highest level in 17 years. At the press conference after the Monetary Policy Meeting, BOJ Governor Kazuo Ueda stated that the central bank will continue to raise interest rates if its economic and price forecasts are realized according to the Outlook for Economic Activity and Prices. This stance sparked the temporal yen buying.
The USDJPY fell to the upper 154 yen range. However, the yen buying momentum subsided soon afterward as the governor offered few clues on the timing and pace of future rate hikes. The pair closed the weekly trading session in the upper 155 yen range.
Meanwhile, the steady EURUSD broke above the 1.05 level, and the GBPUSD touched the 1.25 level.
Economic Indicators and Statements to Watch this Week
(All times are in GMT)
January 27 (Mon)
- 15:00 U.S.: December new home sales
January 28 (Tue)
- 23:50 Japan: Minutes of Bank of Japan Monetary Policy Meeting
January 29 (Wed)
- 19:00 U.S.: Federal Reserve Open Market Committee (FOMC) meeting, post-meeting policy rate announcement
- 19:30 U.S.: Regular press conference by Federal Reserve Chairman Jerome Powell
January 30 (Thu)
- 10:00 Europe: October-December quarterly regional gross domestic product (preliminary regional GDP)
- 13:15 Europe: European Central Bank (ECB) Governing Council policy interest rate announcement
- 13:30 U.S: October-December quarterly real gross domestic product (preliminary GDP)
- 13:45 Europe: Regular press conference by ECB President Christine Lagarde
January 31 (Fri)
- 13:30 U.S.: December personal consumption expenditures (PCE deflator)
This Week's Forecast
The following currency pair charts are analyzed using an overlay of the ±1 and ±2 standard deviation Bollinger Bands, with a 20-period moving average.
USDJPY
While it remains difficult to predict the impact of President Trump's statements and policies, key events await in the U.S. this week, including the FOMC and the release of December PCE. Now that the BOJ has raised interest rates, the markets are focusing on the U.S. monetary policy.
Next is an analysis of the USDJPY daily chart.
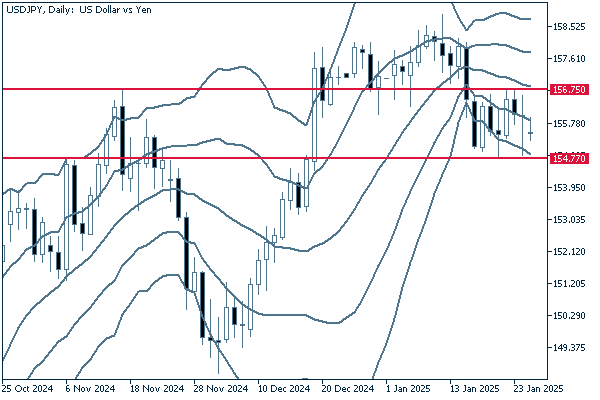
Last week, the USDJPY fluctuated around -1σ, forming a range between 156.75 yen and 154.77 yen. Despite the downward trend of the middle line, it is better to determine whether the pair breaks above or below the range and then follow the direction.
We continue with an analysis of the USDJPY weekly chart.
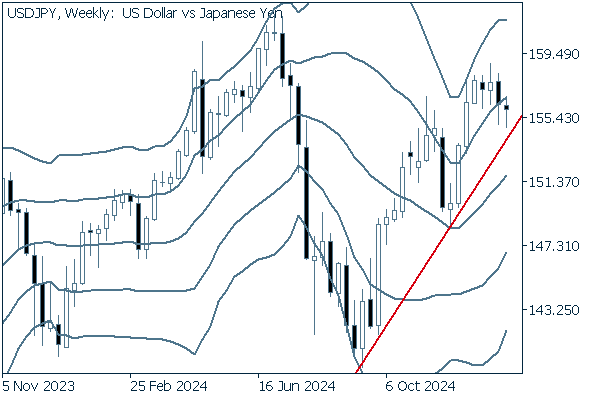
On the weekly chart, the USDJPY appears to have entered a downtrend after hitting a ceiling. However, the pair could also rebound at the extended trend line formed by connecting the previous two trend reversal points from last year's bottom and continue to rally. If so, it could continue to make new highs and target the 160 yen level.
EURUSD
The weakening dollar helped the EURUSD avert parity (1.00), and the market seemed to be entering the rebound phase. However, the economic problems in Europe and the region's gloomier economic outlook than the U.S. are keeping traders from becoming optimistic.
Next is an analysis of the EURUSD daily chart.
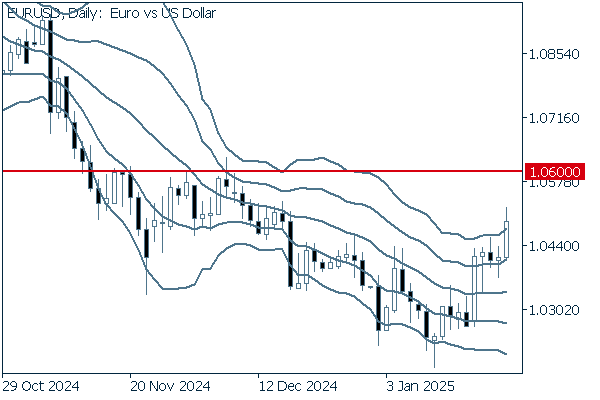
Last week, the pair surged to break above +2σ. Meanwhile, the long-running downtrend of the middle line seems to have ended, and the line is finally about to flatten out. If the current trend continues, the pair is likely to reach the 1.06 level.
We continue with an analysis of the EURUSD weekly chart.
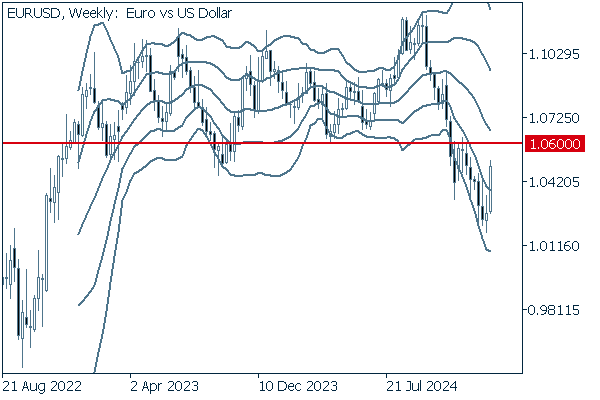
The pair finally got out of the downward band walk and broke above -1σ. If it breaks above the 1.06 level, the pair may return to the range that has been formed by the fluctuation since 2022.
GBPUSD
The GBPUSD is performing well as the dollar weakens. However, concerns about the U.K.'s financial problems linger. Since no major economic data is scheduled to be released in the U.K. this week, the market will likely focus on the dollar's behavior.
Now, we analyze the daily GBPUSD chart.
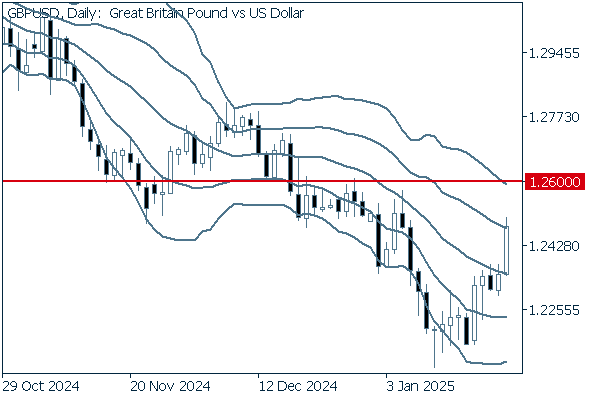
Last week, the pair finally erased the plunge that began on January 8th and temporarily broke above +1σ. Although the middle line remains downward, if the pair continues to rise, it will be able to target 1.26.
We continue with an analysis of the GBPUSD weekly chart.
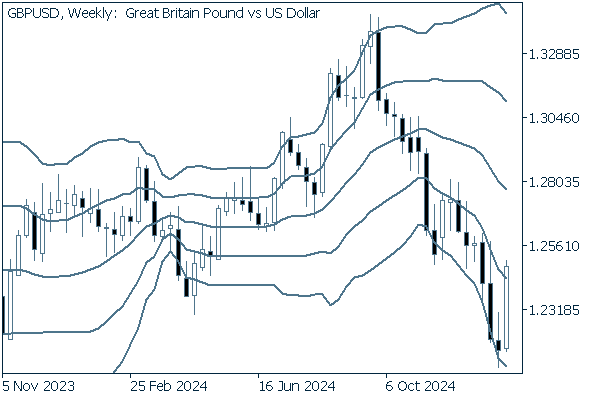
On the weekly chart, the pair finally snapped the negative candlestick streak at three and formed a long positive candlestick. However, the middle line, with its steep angle, is still in the midst of the downtrend. Therefore, it is better to think that the downtrend will continue.
Was this article helpful?
0 out of 0 people found this article helpful.
Thank you for your feedback.
Send