2024.11.18
This article was :
published
updated
Weekly FX Market Review and Key Points for the Week Ahead
Foreign exchange markets in the week that ended on November 17 featured a strong dollar. In particular, the market focused on the policies proposed by President-elect Donald Trump. In addition, U.S. long-term interest rates were increased. As a result, the dollar strengthened further against other major currencies.
USDJPY surged from the 152 yen range to the 156 yen range, while EURUSD and GBPUSD both weakened. Let's review the market movements through the week.
November 11 (Mon)
The USDJPY opened the trading week in the upper 152 yen range.
During the New York session, the Dow Jones Industrial Average hit a record high. As traders remained risk-on, the dollar strengthened against the yen, rising to just below 154 yen on expectations of Trump's fiscal expansionism.
November 12 (Tue)
After briefly falling to the lower 153 yen range, the dollar strengthened against the yen following a rise in U.S. long-term interest rates and continued to climb to the upper 154 yen range.
While there was no major economic data released on this day, the trend in U.S. bond yields supported the dollar.
November 13 (Wed)
The U.S. Consumer Price Index (CPI) for October, released at 13:30 GMT, met the market forecast with an increase of 0.2% MoM (versus the forecast of 0.2%) and 2.6% YoY (versus the forecast of 2.6%).
The dollar briefly weakened against the yen, falling to the 154 yen level. The EURUSD and GBPUSD both fell to new lows.
However, after Federal Reserve Bank of Dallas President Lorie Logan expressed a cautious stance on further rate cuts, the dollar was bought again, and the USDJPY rose to the mid-155 yen range during the New York session.
November 14 (Thu)
After the Republican Party reportedly secured a majority in both the House of Representatives and the Senate, the dollar strengthened on growing expectations that Trump's policies would be implemented.
USDJPY continued to rise from the upper 155 yen range to the 156 yen range following the release of a stronger-than-expected U.S. Retail Sales report in the morning of the New York session, which registered a 0.4% increase over the previous month versus expectations for a 0.3% increase.
Meanwhile, the impact of the revised Eurozone GDP figures for the July-September period, which registered an expected 0.9% increase over the previous year, was limited. The EURUSD fell to the 1.04 range as the dollar continued to strengthen.
November 15 (Fri)
Japan's preliminary GDP figures for the July-September period released in the morning beat the forecasts, registering 0.9% on an annualized basis versus a forecast of 0.7%. However, this result gave the USDJPY a limited impact.
The pair hit a peak in the mid-morning Tokyo session and then fell to the 154 yen range to close the weekly trade.
Economic Indicators and Statements to Watch this Week
(All times are in GMT)
November 19 (Tue)
10:00 Europe: October Harmonised Index of Consumer Prices (revised HICP)
10:00 Europe: October Harmonised Index of Consumer Prices (revised HICP core index)
November 21 (Thu)
23:30 Japan: October Consumer Price Index (CPI, all items)
23:30 Japan: October Consumer Price Index (CPI, all items less fresh food)
23:30 Japan: October Consumer Price Index (CPI, all items less fresh food and energy)
This Week's Forecast
The following currency pair charts are analyzed using an overlay of the ±1σ and ±2σ standard deviation Bollinger Bands, with a period of 20 days.
USDJPY
The Trump Trade lifted the USDJPY above the 156 yen level. Amid growing speculation that the Bank of Japan will raise interest rates at its December Monetary Policy Meeting, BOJ Governor Ueda's comments on November 18th and 21st may accelerate the yen selling if the Governor expresses reluctance to the rate hike.
Next is an analysis of the USDJPY daily chart.
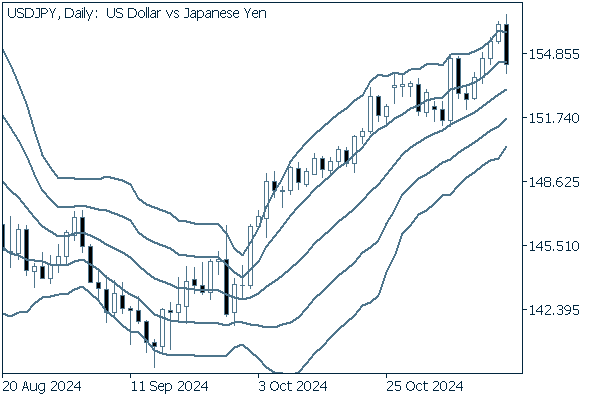
The middle line is maintaining its uptrend. The USDJPY has been fluctuating between +1σ and +2σ. It is possible to see that the uptrend will continue. However, if the pair falls below the middle line, a trend reversal may occur.
We continue with an analysis of the USDJPY weekly chart.
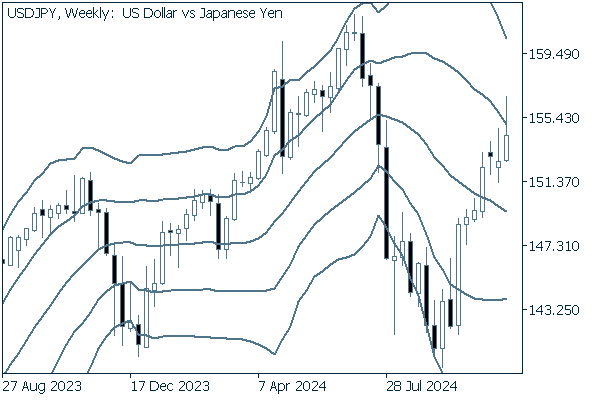
On the weekly chart, the USDJPY remains in an upward trend as a series of bullish candlesticks appear. However, it is worth noting that the long upper wick of the latest bullish candlestick may indicate a shift to a downtrend.
EURUSD
As the dollar remains strong, the EURUSD has continued to fall. Last week, the pair briefly fell below the 1.05 level.
Growing concerns that Trump's tariff policy could have a negative impact on the Eurozone economy, especially Germany, also contributed to further EURUSD weakness.
There is also speculation that the European Central Bank may announce a large interest rate cut following its December Governing Council. Therefore, it is necessary to be vigilant against further declines in the euro.
Next is an analysis of the EURUSD daily chart.
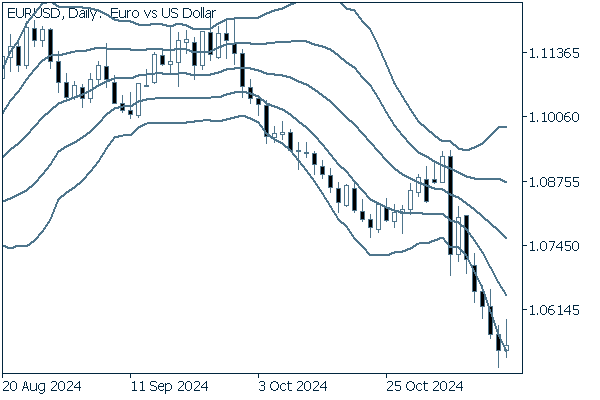
As the middle line continued its downtrend, the EURUSD fluctuated around -2σ. However, Friday's session ended with a bullish candlestick after five consecutive daily bearish candlesticks. While it is still safe to say that the pair may continue to move downward, it is worth considering the possibility of a turnaround.
We continue with an analysis of the EURUSD weekly chart.
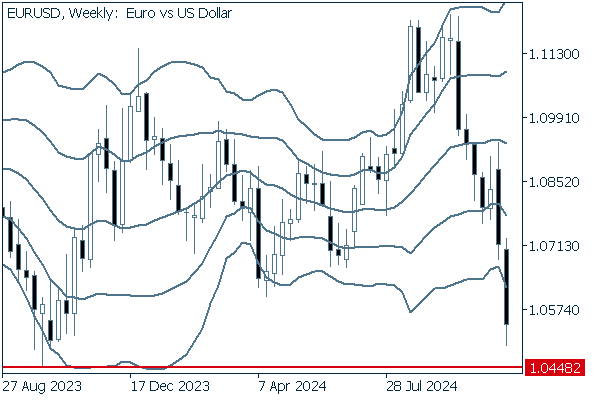
On a weekly basis, the EURUSD experienced another sharp decline last week, breaking below -2σ. In addition, The angle of the middle line is about to turn down. The fresh support level is likely to be 1.0448, the low marked on May 16th.
GBPUSD
The GBPUSD fell from the 1.29 level to the 1.26 level following the weaker-than-expected July-September UK GDP figures, which registered a 1.0% year-over-year increase versus the 1.1% forecast.
In the coming week, it seems likely that the GBPUSD will again be affected by the dollar's behavior.
Now, we analyze the daily GBPUSD chart.
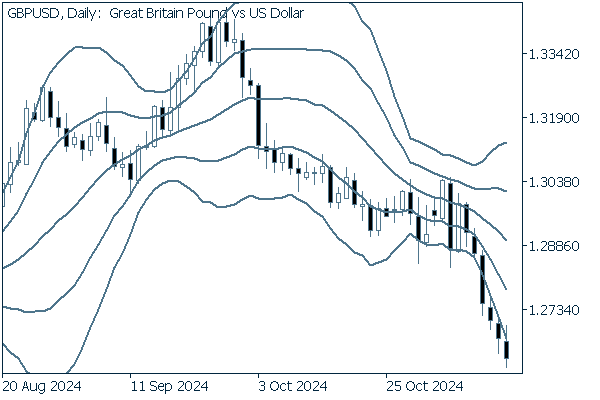
With volatility increasing and the middle line moving downward, the pair broke below -2σ last week. It will be best to remain bearish.
We continue with an analysis of the GBPUSD weekly chart.
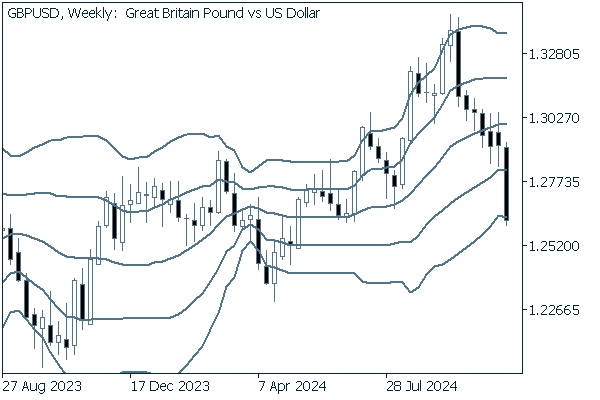
On the weekly chart, seven consecutive bearish candlesticks have formed. The latest one crossed below -1σ, indicating that the downward trend is gaining momentum. This trend is likely to continue.
Was this article helpful?
0 out of 0 people found this article helpful.
Thank you for your feedback.
Send