2024.11.11
- Features
-
Services/ProductsServices/ProductsServices/Products

Learn more about the retail trading conditions, platforms, and products available for trading that FXON offers as a currency broker.
You can't start without it.
Trading Platforms Trading Platforms Trading Platforms
Features and functionality comparison of MetaTrader 4/5, and correspondence table of each function by OS
Two account types to choose
Trading Account Types Trading Account Types Trading Account Types
Introducing FXON's Standard and Elite accounts.
close close

-
SupportSupportSupport

Support information for customers, including how to open an account, how to use the trading tools, and a collection of QAs from the help desk.
Recommended for beginner!
Account Opening Account Opening Account Opening
Detailed explanation of everything from how to open a real account to the deposit process.
MetaTrader4/5 User Guide MetaTrader4/5 User Guide MetaTrader4/5 User Guide
The most detailed explanation of how to install and operate MetaTrader anywhere.
FAQ FAQ FAQ
Do you have a question? All the answers are here.
Coming Soon
Glossary Glossary GlossaryGlossary of terms related to trading and investing in general, including FX, virtual currencies and CFDs.
News News News
Company and License Company and License Company and License
Sitemap Sitemap Sitemap
Contact Us Contact Us Contact Us
General, personal information and privacy inquiries.
close close

- Promotion
- Trader's Market
- Partner
-
close close
Learn more about the retail trading conditions, platforms, and products available for trading that FXON offers as a currency broker.
You can't start without it.
Features and functionality comparison of MetaTrader 4/5, and correspondence table of each function by OS
Two account types to choose
Introducing FXON's Standard and Elite accounts.
Support information for customers, including how to open an account, how to use the trading tools, and a collection of QAs from the help desk.
Recommended for beginner!
Detailed explanation of everything from how to open a real account to the deposit process.
The most detailed explanation of how to install and operate MetaTrader anywhere.
Do you have a question? All the answers are here.
Coming Soon
Glossary of terms related to trading and investing in general, including FX, virtual currencies and CFDs.
General, personal information and privacy inquiries.
Useful information for trading and market information is posted here. You can also view trader-to-trader trading performance portfolios.
Find a trading buddy!
Share trading results among traders. Share operational results and trading methods.
- Legal Documents TOP
- Client Agreement
- Risk Disclosure and Warning Notice
- Order and Execution Policy
- Complaints Procedure Policy
- AML/CFT and KYC Policy
- Privacy Policy
- eKYC Usage Policy
- Cookies Policy
- Website Access and Usage Policy
- Introducer Agreement
- Business Partner Agreement
- VPS Service Terms and Condition

This article was :
published
updated
Weekly FX Market Review and Key Points for the Week Ahead
In the trading week that ended on November 10th, the U.S. presidential election and the FOMC's policy interest rate decision led to sharp fluctuations, especially in USDJPY. The dollar surged on speculation that Donald Trump's victory would lead to inflation. However, by the end of the week, the market regained calmness with some profit-taking.
November 4 (Mon)
With the Tokyo market closed for a public holiday in Japan, the USDJPY continued to trade in a directionless manner between the mid-151 yen level and the 152 yen range.
Traders apparently refrained from active trading as they closely watched the outcome of the U.S. presidential election.
November 5 (Tue)
During the Tokyo session, the Nikkei 225 rallied as the presidential election approached, pushing the USDJPY up to the mid-152 yen level. However, as the market became more cautious about the election results, the pair fell back to the lower 151 yen level in the New York session.
Meanwhile, the ISM announced that the Services PMI registered 56.0 percent in October, beating the forecast of 53.8 percent. The result indicated the strength of the U.S. economy, and the dollar rallied temporarily. However, caution over the presidential election prevailed.
November 6 (Wed)
As the vote counting for the presidential election progressed, media reports of Donald Trump's lead accelerated yen selling and dollar buying. The USDJPY briefly soared to the 154 yen level, marking a three-month high.
As it became clear that Trump would be elected, the dollar was bought further in anticipation of his policies, and the USDJPY reached the upper 154 yen level. In addition, the EURUSD fell to the 1.06 level, and the GBPUSD briefly hit the lower 1.28 level.
The market expected that Trump would raise tariffs and implement expansionary policies for the domestic economy and that these policies would trigger inflation. At the same time, U.S. long-term interest rates rose, adding to the upward pressure on the dollar.
November 7 (Thu)
The dollar-buying trend that followed Trump's victory faded, and dollar-selling prevailed, pushing the USDJPY down to the upper 152 yen level.
Meanwhile, the Bank of England (BoE) decided to cut interest rates by 0.25% to 4.75%. However, the GBPUSD climbed to around the 1.30 level as the BoE predicted that the British government's first budget would lead to higher inflation, triggering the pound buying.
In addition, as expected, the FOMC lowered the policy interest rate by 0.25% to a range of 4.5% to 4.75%. Meanwhile, the FOMC statement dropped the phrase "the Committee had gained greater confidence, and inflation was progressing toward its two percent goal." Federal Reserve Chair Jerome Powell explained that the deletion was accompanied by the start of rate cuts and that the FRB would continue to cut rates at its normal pace of 0.25 percent going forward.
November 8 (Fri)
Strong selling pressure on the dollar following the previous day's FOMC meeting pushed the USDJPY down to the lower 152 yen level.
In the week starting on November 11th, the US CPI and US Retail Sales for October will be released. The market will continue to focus on the Fed's interest rate outlook.
Economic Indicators and Statements to Watch this Week
(All times are in GMT)
November 13 (Wed)
13:30 U.S.: October Consumer Price Index (CPI)
13:30 U.S.: October Consumer Price Index (CPI core index)
November 14 (Thu)
10:00 Europe: July-September quarterly regional gross domestic product (revised regional GDP)
12:30 Europe: European Central Bank (ECB) Governing Council meeting minutes
20:00 U.S.: Conference by Federal Reserve Chair Jerome Powell
23:50 Japan: July-September quarterly real gross domestic product (preliminary GDP)
November 15 (Fri)
07:00 U.K.: July-September quarterly gross domestic product (preliminary GDP)
07:00 U.K.: September monthly gross domestic product (GDP)
13:30 U.S.: October retail sales (month-on-month data)
13:30 U.S.: October retail sales (month-on-month data, excluding automobiles)
This Week's Forecast
The following currency pair charts are analyzed using an overlay of the ±1 and ±2 standard deviation Bollinger Bands, with a period of 20 days.
USDJPY
With two major events, the U.S. presidential election and the FOMC meeting, now in the rearview mirror, it is necessary to watch for market volatility in response to President-elect Donald Trump's comments.
Next is an analysis of the USDJPY daily chart.
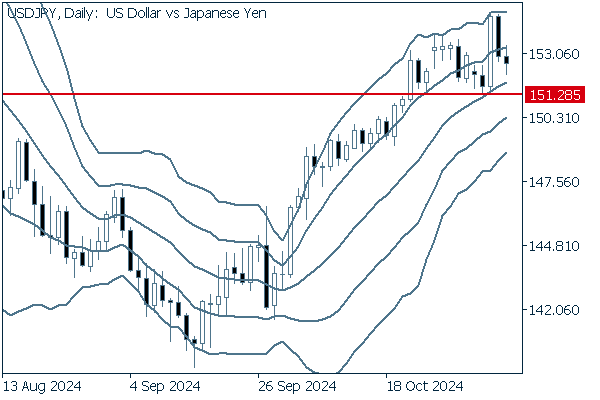

Since the USDJPY has been traded above the middle line, the uptrend is likely to continue. However, if the pair breaks below the recent low of 151.28 yen, the current trend could be reversed.
We continue with an analysis of the USDJPY weekly chart.
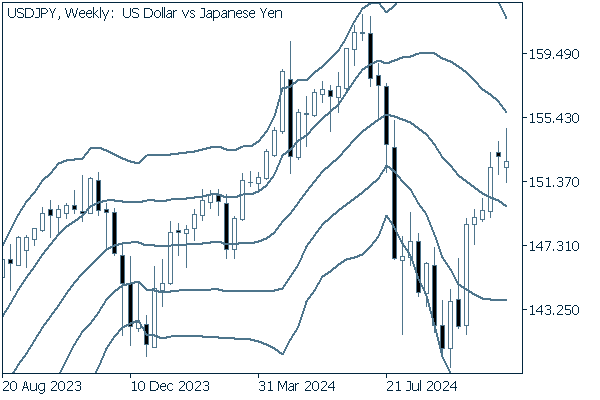

The USDJPY had remained in an uptrend, with weekly highs and lows higher than the previous week's. However, last week, a short-body white candlestick with a long upper wick appeared between the middle line and +1σ. Therefore, it is necessary to take into account the possible trend reversal.
EURUSD
The EURUSD fell again as the dollar strengthened in the wake of the U.S. presidential election. This week, it is necessary to follow the minutes of the European Central Bank (ECB) meeting, which will be released on November 14th, as well as the behavior of the dollar.
Next is an analysis of the EURUSD daily chart.
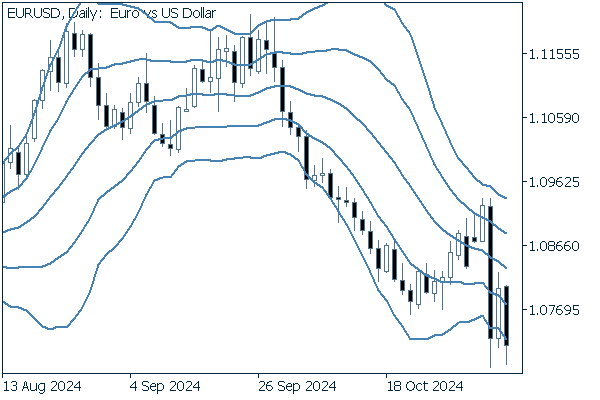

Wednesday's plunge wiped out the recent gains made during the rebound phase. It confirmed the continuation of the downtrend. Unless the pair breaks above -1σ, it is safe to say that the downtrend will continue.
We continue with an analysis of the EURUSD weekly chart.
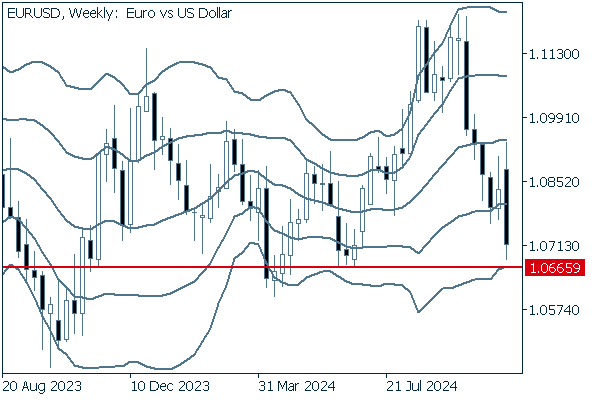

While the bandwidth has been widening since this summer, the EURUSD closed last week below -1σ. The next support level will be seen at 1.0665, which was the June 26th low.
GBPUSD
Like other pairs, the GBPUSD will demonstrate a sensitivity to the behavior of the dollar. It seems that we will see different trends depending on whether the pair goes above or below 1.30.
Now, we analyze the daily GBPUSD chart.
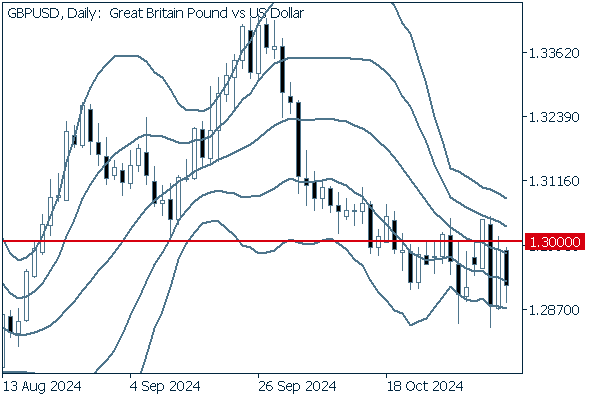

The GPBUSD is likely to continue to fluctuate around the 1.30 milestone. While the pair has been traded below this level, it has also lost direction as bullish and bearish candlesticks alternate. The low volatility of the pair and the descending middle line indicate the continuation of a mild downtrend.
We continue with an analysis of the GBPUSD weekly chart.
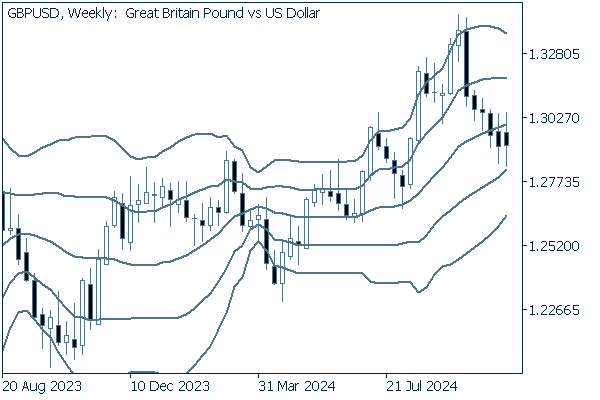

The bearish candlesticks have appeared for six consecutive weeks. The GBPUSD has clearly broken below the middle line. However, the middle line itself is trending upward. Therefore, it is possible that the recent low will turn into a support level, and the pair will bounce back.
Was this article helpful?
0 out of 0 people found this article helpful.
Thank you for your feedback.
FXON uses cookies to enhance the functionality of the website and your experience on it. This website may also use cookies from third parties (advertisers, log analyzers, etc.) for the purpose of tracking your activities. Cookie Policy
